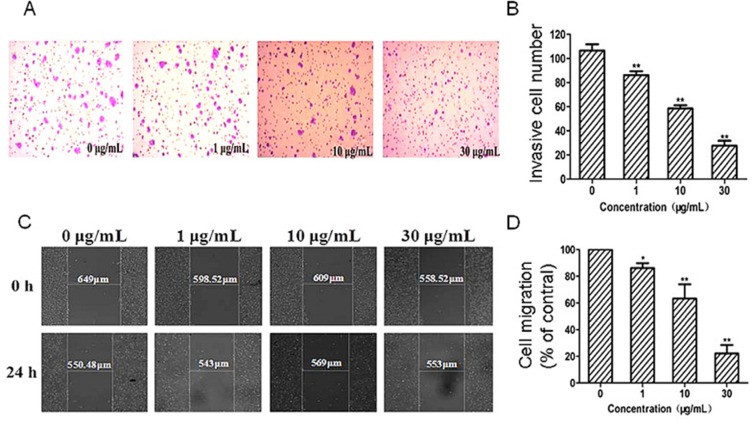
Figure 5. Effects of G on mobility and invasion capacity of HT29 cells.
(A) Representative images of the transwell invasion of HT29 cells treated with G (0, 1, 10 and 30 μg/mL) for 24 h. (B) Quantitative analysis of the effect of G on cell invasion. (C) Representative images of the scratch mobility of HT29 cells treated with G (0, 1, 10, 30 μg/mL) for 24 h. (D) Quantitative analysis of the effect of G on cell mobility. *P < 0.05; and **P < 0.01, compared with the control.

