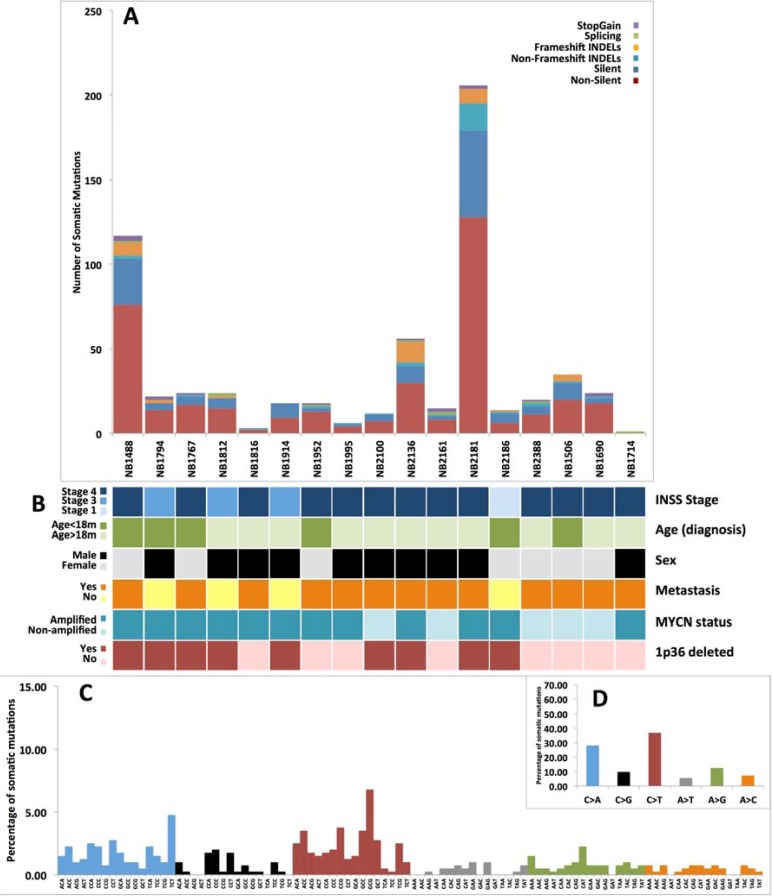
Figure 1. Somatic variants annotation and somatic signature.
A. The top bar plot shows the functional classes frequencies for the annotated variants in each case of tumor. B. The data grid summarize clinical information of neuroblastoma samples. C. The bottom histogram shows the detailed spectrum of somatic SNVs. The Y axis reports the frequency of nucleotide substitutions, while X axis shows the trinucleotides context in which the somatic changes occur. D. The nested top right box indicates the frequency of the six types of base substitutions caused by somatic mutations.

