Abstract
Diet contributes to the increasing incidence of chronic diseases. Thus, fast, accurate, and convenient dietary assessment tools are in demand. We designed an internet-based diet and lifestyle questionnaire for Chinese (IDQC). The objective of this study was to validate its applicability and assess the dietary habits of Chinese college students.
Six hundred forty-four college students from northern China were recruited and asked to complete the IDQC for the last 4 months (135 food items) and 3-day diet records (3DDRs). Food and nutrient intakes recorded in the IDQC were validated against those in the 3DDRs using the Wilcoxon matched-pairs t test, correlation analysis, and cross-classification. The Student t and χ2 tests were used in the dietary assessment.
There were significantly positive correlations in the dietary intakes of 9 food groups and 23 nutrients between the IDQC and 3DDRs. All participants consumed low levels of fruits, vegetables, legumes, dairy, and certain micronutrients (ie, vitamin A, vitamin B1, vitamin B2, folic acid, vitamin C, calcium, selenium, and iodine), and high levels of iron and manganese. Male students consumed higher intakes of the food groups and nutrients than female students.
The IDQC represents an accurate and convenient dietary assessment tool that can be used in large populations. Inadequate and excessive nutrition co-existed in college students, and more fruits, vegetables, legumes, dairy, and various vitamins and minerals were needed in this population's daily diet. The IDQC is free of access at www.yyjy365.org/diet.
INTRODUCTION
Nutritional factors are strongly associated with the development, treatment, and prevention of chronic diseases such as hypertension, hyperlipidemia, diabetes mellitus, and cardiovascular diseases.1–4 As the incidence of chronic diseases has increased dramatically worldwide,5,6 it is urgent to investigate nutrient and food intakes and evaluate dietary patterns, which is beneficial for improving etiologic research on diet.
To assess dietary habits accurately, many epidemiological studies had been conducted. The food frequency questionnaire (FFQ) is a simple, convenient, and economic dietary assessment tool for a large study population. It includes a series of questions on the frequency and amount of certain food items, and it provides a general understanding of the subjects’ actual dietary food intakes.7 However, traditional, face-to-face, paper-based FFQs are expensive, time-consuming, and impossible to conduct in a short period,8 especially in China, which has a large population and vast territory. The internet is a fast, effective, widespread, and convenient tool used for daily communication, and various information and online courses can be found online. As people's health consciousness is growing, more individualized and professional evaluations of healthy diets are needed. Considering the aforementioned, we developed an internet-based diet and lifestyle questionnaire for Chinese (IDQC), which contains both a lifestyle survey and FFQ. Personal feedback on the subjects’ long-term or current lifestyle and diet is provided when the survey is completed. The IDQC will be a valuable tool for assessing individual health, and it may serve as a diet survey for experts and facilitate health policy making by the government.
The present study was conducted to explore the applicability of the IDQC in real life. We recruited college students as volunteers for the following several reasons. (1) It was a convenience sample. (2) College students are a special population with different characters, such as a high education, open mind, and low-income sources. These factors all affect their daily food and nutrient selection,9,10 leading to unhealthy dietary patterns such as meal skipping, the consumption of unhealthy snacks, and participation in unhealthy weight-loss diets, and so on.11 (3) Diet assessment among college students is limited in China. Thus, we validated the utility of the IDQC in college students as a dietary survey and assessed their diet quality.
METHODS
Participants and the Study Design
Participants were randomly recruited by telephone or e-mail from 4 colleges in Harbin, China, from March 1 through April 29, 2014. Three hundred fifty male and 350 female students were enrolled. The students were not taking any medications, had no diseases or conditions that affected their dietary habits, and were not following any weight-loss diets or programs. The enrolled students were asked to complete the IDQC online, which recorded their demographic data (ie, age, sex, educational level, smoking status, alcohol use, height, weight, and waist circumstance [WC]), health information (ie, physical activity, sleep duration, and diseases), FFQ for the last 4 months, and 3-day diet records (3DDRs) within 1 week (2 workdays and 1 weekend). Physical activity included the frequency (times/wk), duration (h), and sport type in leisure time, and categorized into 3 groups: inactive, moderate, and vigorous, according the guidelines in International Physical Activity Questionnaire.12 Totally, 95.4% female and 93.7% male students completed the IDQC. After excluding participants who emptied ≥10 food items and had implausible high- or low-energy intakes (>4500 kcal/day and < 500 kcal/day, respectively), 315 male and 329 female students completed the IDQC and were included in our current analyses.
We obtained online informed consents from all students. The study followed the guidelines of the Declaration of Helsinki, and the survey protocol was approved by the Medical Ethics Committee of the Harbin Medical University (No. [2008]018).
IDQC Design
To design an accurate and suitable questionnaire, we developed the IDQC in 4 steps. First, experts in the fields of nutrition, epidemiology, and bio-statistics discussed the feasibility and implementation of the questionnaire. Considering the dietary habits in different regions of China, the food items were determined according to the diet patterns in northern, southern, eastern, western, and the middle regions of China. However, because of limited financial and manpower resources, we only selected individuals in Harbin, China. Second, 250 adult volunteers of both sexes who had not lived in Harbin for no more than 1 year were asked to complete a 24-h dietary record. Two hundred five participants completed the questionnaire. Third, all questionnaires were recorded in a spreadsheet along with the food item types (n = 136), frequencies, and amounts. The food items (n = 135) consumed by 2 or more participants were assigned to 1 of 16 food categories (ie, grains, potatoes, legumes, vegetables, fungus, fruits, seeds and nuts, livestock, poultry, dairy, eggs, fish, snacks, sugar, condiments, and beverages). Finally, we uploaded the questionnaire to a secure website (www.yyjy365.org/diet). Images of each food item's weight/volume were used as references to assist the participants in making accurate estimations.
The IDQC can be completed in 30 to 40 min. The frequency and amount of each food item must be selected before continuing with the next food item. For example, with rice, the frequency (8 options: never [<1 time/month], 1–3 times/month, 1 time/wk, 2–3 times/wk, 4–5 times/wk, 1 time/day, 2 times/day, or 3 times or more/day) and amount (6 levels: < 1 liang [1 liang = 1 Chinese serving = 50 g], 2–3 liang, 4–5 liang, 6–7 liang, 8–9 liang, or ≥10 liang) must been selected, and then the next food item can be chosen. The amount of each food item was listed according to its proportion consumed, for example, a small portion of food in one's daily diet, such as ginger, was counted as: < 10 g, 20 to 30 g, 40 to 50 g, 60 to 70 g, 80 to 90 g, or >100 g. Beverages were recorded as the volume per bottle (550 mL/bottle). Personal food and nutrient intakes will be listed as soon as a volunteer completes the IDQC. Personal guidelines are provided simultaneously, according to the criteria of the Dietary Reference Intakes (DRIs).13
Food Group and Nutrient Intakes
The weight of food was calculated by multiplying the food consumption frequency by the amount. We added the food items to corresponding food categories and obtained the total intakes from each of the 16 food categories. The daily nutrient intakes were determined from the total nutrient content from the 135 food items according to the Food Nutrition Calculator (V1.60; Shixinghengxun, Beijing, China). Sixteen food categories and 23 nutrients were calculated, including the amounts of energy (kcal), protein (g), carbohydrates (g), fiber (g), cholesterol (g), vitamin A (VA, μgRE), vitamin B1 (VB1, mg), vitamin B2 (VB2, mg), folic acid (μg), niacin (mg), vitamin C (VC, mg), vitamin E (VE, mg), calcium (Ca, mg), phosphorus (P, mg), potassium (K, mg), sodium (Na, mg), magnesium (Mg, mg), iron (Fe, mg), zinc (Zn, mg), selenium (Se, μg), copper (Cu, mg), manganese (Mn, mg), and iodine (I, μg).
Dietary Assessment
Based on the Chinese Food Guide Pyramid, the 16 food categories were merged into 9 food categories:14 grains, fruits, vegetables, meat, eggs, legumes, dairy, oil, and salt. Food group intakes lower than the recommended level established by the Chinese Food Guide Pyramid were labeled as inadequate. In the case of oil and salt, excessive intake was defined as consumption levels higher than the maximum limit. Dietary reference intakes were used in the nutrient assessment. Nutrient intake levels lower than the recommended nutrient intakes (RNI), adequate intakes (AI), or estimated average requirement (EAR) were inadequate, whereas nutrient intake levels higher than the tolerable upper intake level were categorized as excessive.
Statistical Analysis
To validate the IDQC, the Wilcoxon matched-pairs t test, Pearson correlation, partial correlation (adjusted by the total energy), and cross-classification were used. Agreement between the 2 surveys was defined as having the same or adjacent quartiles, disagreement was defined as having a difference in one of the quartiles, and extreme disagreement was defined as having a difference in 2 or more of the quartiles. For the dietary assessment, the Student t and χ2 tests were used for continuous and categorical variables. Prior to analysis, all data were log-transformed for skewed distribution and residual adjusted in general linear models by the total energy. SPSS software (version 18.0; Beijing Stats Data Mining Co., Ltd, Beijing, China) was used in all the statistical analyses. P < 0.05 was set as the threshold for significance.
RESULTS
Demographic Characteristics
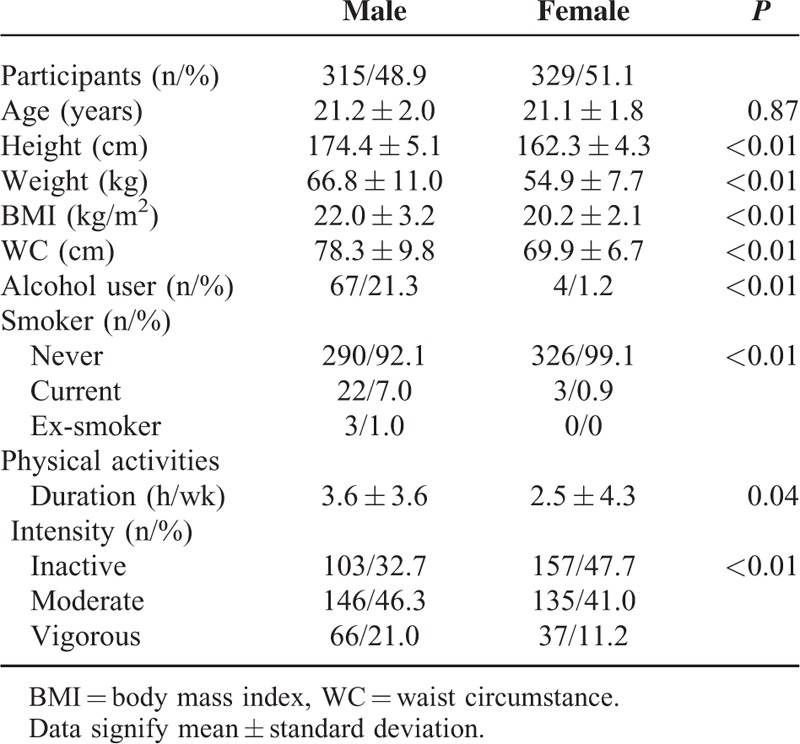
The demographic characteristics of all participants are summarized in Table 1. All male students (n = 315) were of a similar age as the female students (n = 329); however, male students had a higher body mass index (BMI), WC, alcohol consumption, and smoking rates. Among the men, 21.3% consumed alcohol, 7.0% were smokers, and 1.0% were ex-smokers. Male students spent (3.6 ± 3.6) h/wk in physical activities, longer than that of females (2.5 ± 4.3) h/wk. A total of 21.0% males took part in vigorous activities, higher than that in female students (11.2%). Around 47.7% girls were inactive.
TABLE 1.
Demographic Characteristics of All College Students Recruited by Telephone or E-mails
Comparisons Between the IDQC and 3DDRs by the Food Groups and Nutrients
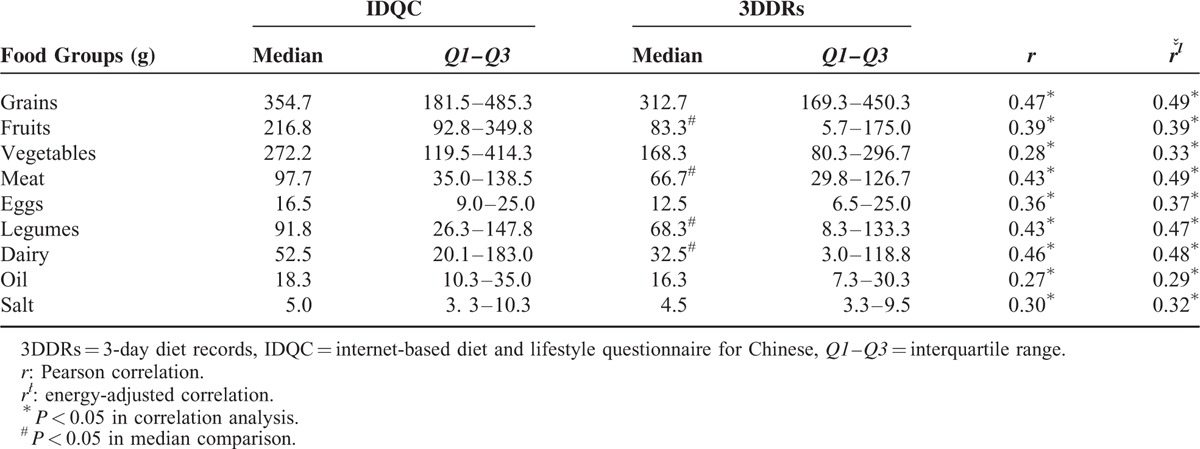
Intakes of the 9 food groups were calculated by the IDQC and 3DDRs. The correlations are presented in Table 2. The correlation coefficients of grain, meat, legumes, and dairy were all >0.4. The correlation coefficients of fruits, eggs, and salt were <0.4. Significant but lower correlations were obtained for vegetables and oil (0.28 and 0.27, respectively). After adjustments for energy were made, all the coefficients increased at an average of 0.40.
TABLE 2.
Comparisons Between the IDQC and 3DDRs by Food Groups
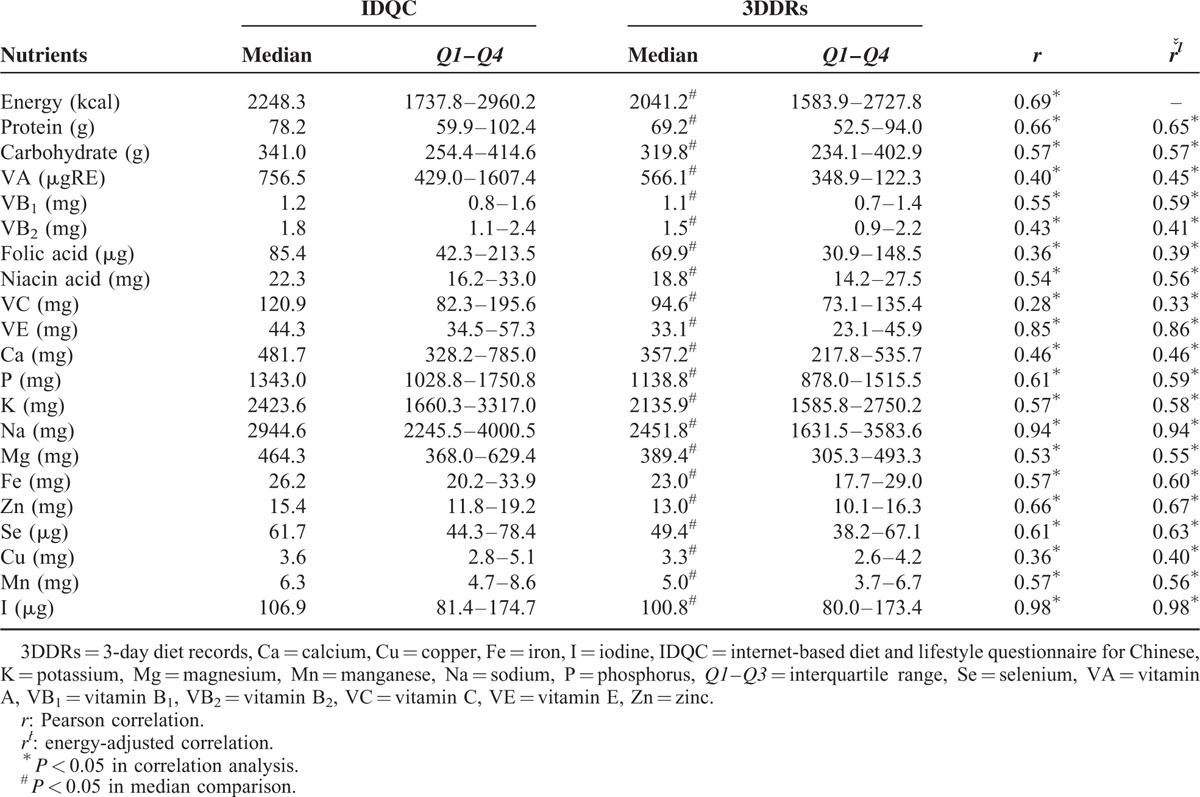
All macro- and micronutrient intakes are listed in Table 3. The correlation coefficients of total energy, protein, VE, P, Na, Zn, Se, and I were > 0.6. The correlation coefficients of carbohydrates, fiber, cholesterol, VA, VB1, VB2, niacin, Ca, K, Mg, and Fe were all <0.6, but >0.4. Others nutrients (folic acid, VC, and Cu) ranged between 0.28 and 0.36 (all < 0.4). Almost all median nutrient intakes in the IDQC were higher than those in the 3DDRs.
TABLE 3.
Comparisons Between the IDQC and 3DDRs by Nutrients
Joint Classification of the Food Groups and Nutrients
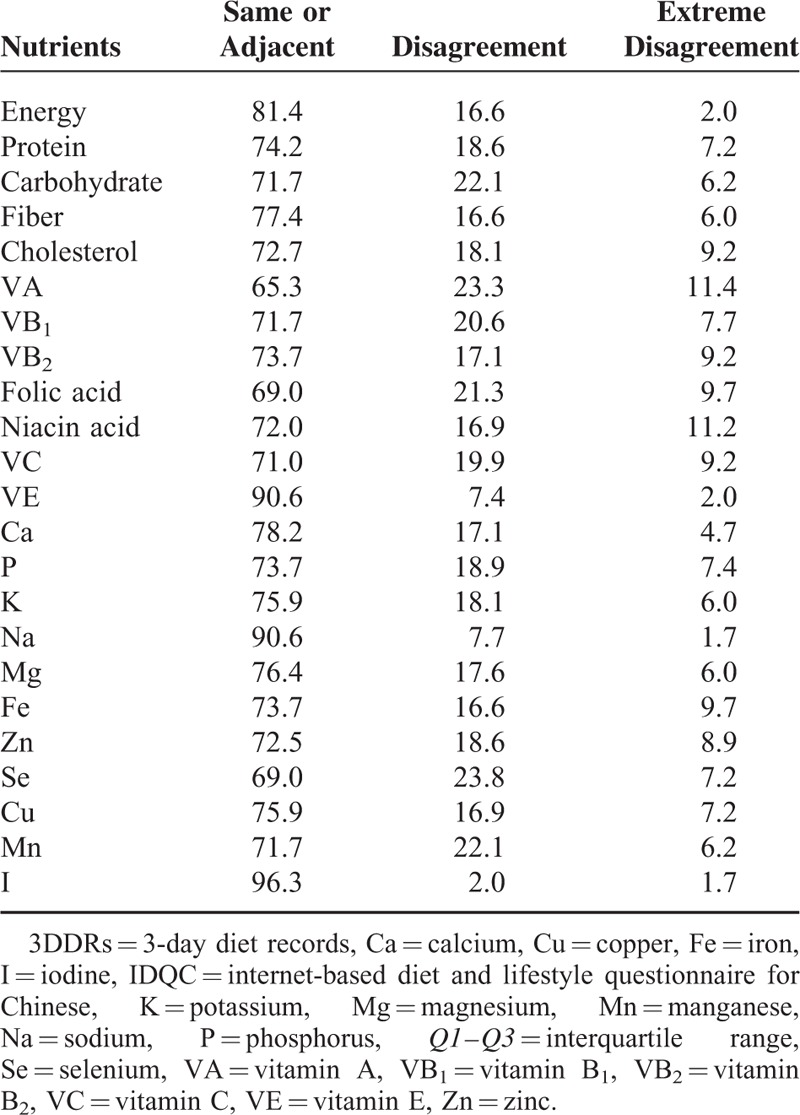
The joint classifications of food groups and nutrients in the IDQC and 3DDRs are shown in Tables 4 and 5. Within the food groups, the agreement rates ranged from 68.9% for oil to 84.8% for dairy, whereas the disagreement rates ranged from 12.3% for legumes to 21.0% for vegetables. The rates of extreme disagreement for oil and salt were 11.5% and 11.9%, respectively, and < 8% for the rest of the food groups. Among the nutrients, 20 of 23 had high agreement rates (>70%). The agreement rates of VE, Na, and I were >90%, and that for energy was 81.39%. The agreement rates of VA, folic acid, and Se were 65.3%, 69.0%, and 69.0%, respectively (Table 5).
TABLE 4.
Agreements (%) Between Quartiles of the IDQC and 3DDRs in Food Groups
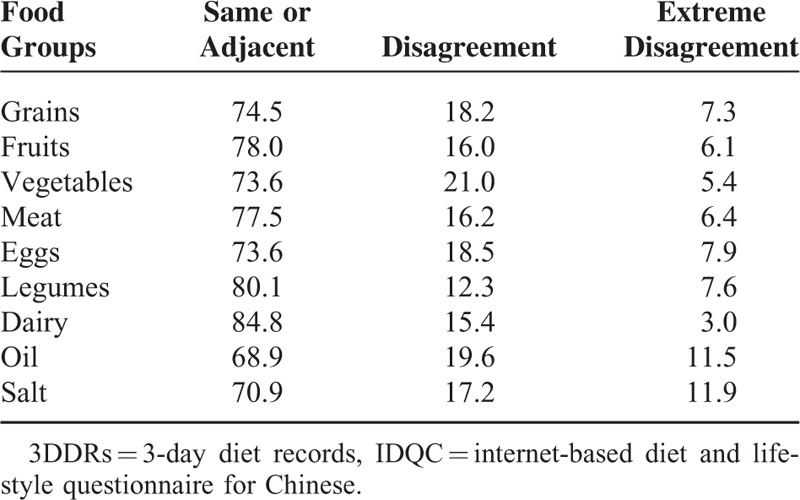
TABLE 5.
Agreements (%) Between Quartiles of IDQC and 3DDRs in Nutrients
Dietary Assessment in College Students
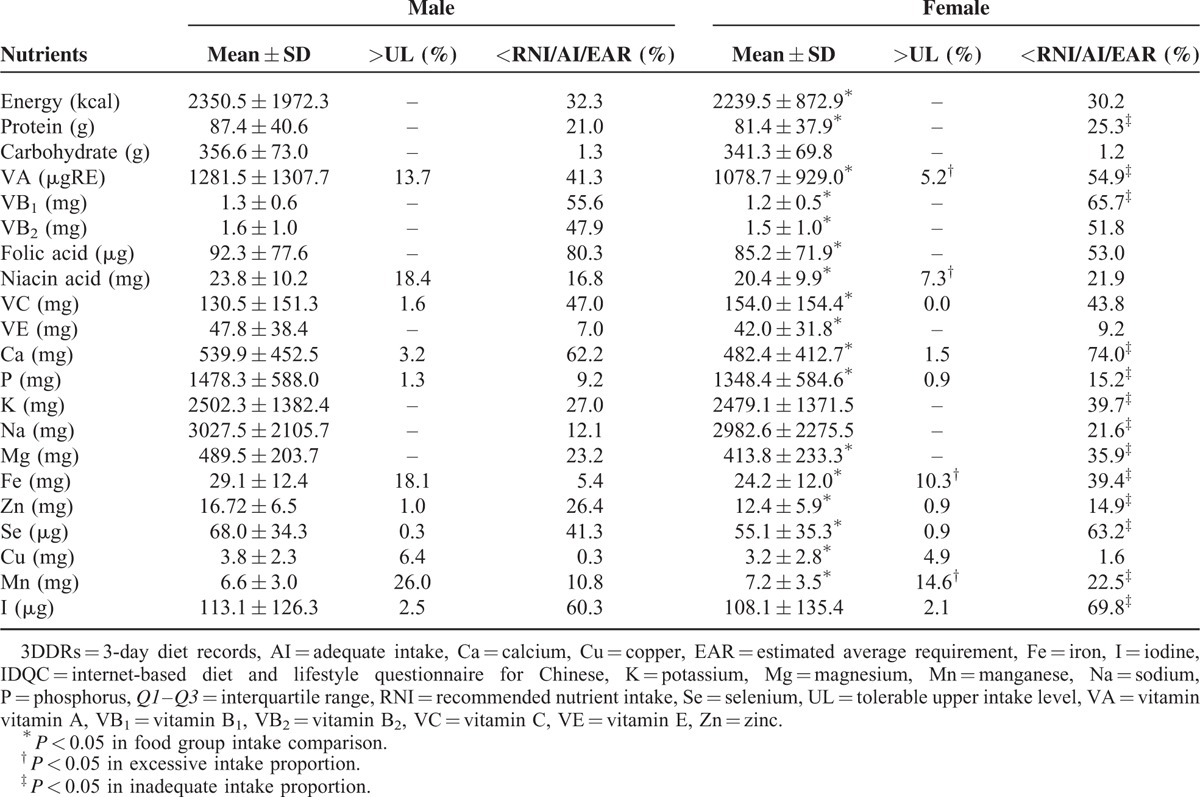
Intakes of all the food groups are summarized in Table 6. Compared to female students, male students consumed more grains, meat, eggs, legumes, and oil, and fewer vegetables. A higher proportion of female students had inadequate intakes of grains and meat, whereas a higher proportion of male students had inadequate intakes of fruit and excessive intakes of oil. Among 9 food groups, the inadequate intake proportion of the whole population for vegetables and eggs was >50% and that for dairy was >90%. With respect to nutrients, the proportions of excessive and inadequate intakes are summarized in Table 7. Male students consumed excessive levels of VA, niacin, Fe, and Mn. Female students had inadequate nutrient intakes of VA, VB1, Ca, P, K, Na, Mg, Fe, Zn, Se, Mn, and I. Deficiencies in VA, VB1, VB2, folic acid, VC, Ca, Se, and I were quite common; >40% of participants consumed less than the RNI, AI, or EAR. Excessive intakes of niacin, Fe, and Mn were observed in ∼10% of the participants.
TABLE 6.
Food Group Intakes in Male and Female College Students
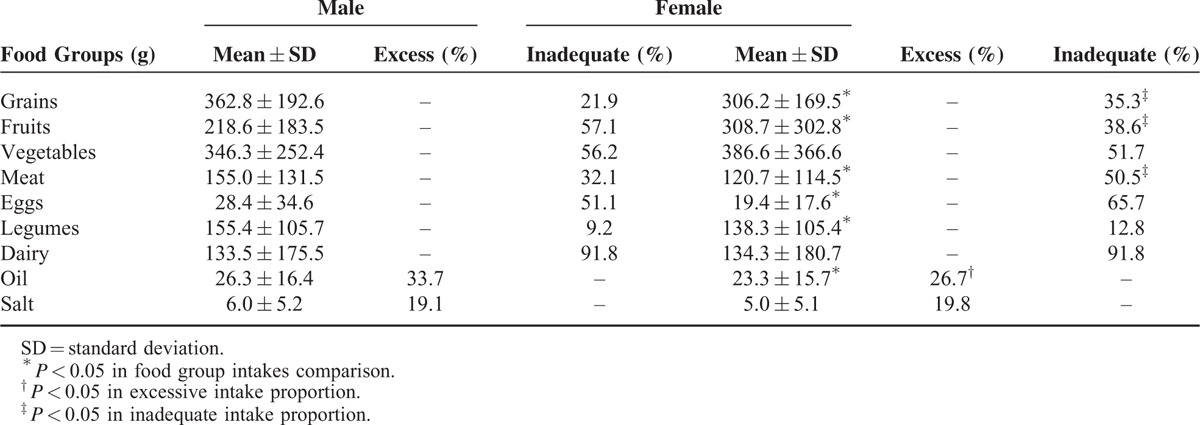
TABLE 7.
Nutrient Intakes and Evaluation in Male and Female College Students
DISCUSSION
The present study validated the IDQC and provided a useful estimate of food and nutrient intakes among college students. The applicability of the IDQC was evaluated by comparing the results with those obtained from the 3DDRs. The food categories and nutrients in the IDQC were well correlated with those in the 3DDRs.
In a similar validation of the FFQ for national health and nutrition monitoring, the Spear rank correlations of food groups between the FFQ and 24-h dietary recalls ranged from 0.18 to 0.80 in a German Health Examination Survey for adults.8 The validation of certain food groups conducted by German EPIC showed a similar range: 0.14 to 0.90.15 The correlation coefficient of all nutrients ranged from 0.44 to 0.6916 in a DASH online FFQ and 0.26 to 0.76 in a Spanish dietary study.17 Other studies for certain nutrients have reported similar results. Validation of an FFQ for daily fat, fiber, alcohol, caffeine, and theobromine intakes among post-menopausal women had coefficients ranged from 0.47 for poly-unsaturated fatty acid to 0.94 for alcohol.18 The FFQ in Dutch cohorts of the European Prospective Investigation into Cancer and Nutrition was applied in assessment of glycemic index and glycemic load. The correlation coefficients was 0.63, when validated against with 12 24-h dietary recalls.19 In the present study, the coefficients and agreement rates for oil and salt between the IDQC and 3DDRs were low, and this may be partly explained by the fact that college students tend to do less housework and cooking, and have no experience using oil and salt.
Willett20 reported that the correlation coefficients between the FFQ and dietary records were 0.6 to 0.7 for the food groups. A correlation coefficient of 0.40 has been proposed as the threshold for a strong correlation between the FFQ and diet records.21 However, it is not easy to reach this threshold value because of the limitations in the methodology and errors. For example, sample populations with a different age, sex, weight, job, educational level, race, and so on, generate different results. Furthermore, the coefficients can be affected by the study time, technique errors, and individuals’ attitudes.22–26
In our present validation study, the correlation coefficients of all the food groups and nutrients correlated well between the IDQC and 3DDRs. The internet-based questionnaire, which has an acceptable accuracy, repeatability, and utility, represents a useful assessment tool of food and nutrient intakes. Following the validation of the IDQC, we assessed the diet quality of the college students.
College students in good health are a special subgroup of the whole population, they are young, and in a crucial period of lifestyle habit formation. But they tend to care less about food quality, follow unhealthy eating patterns (eg, a diet high in fat, sugar, and salt but low in fruits and vegetables).11 In China, college students consume less vegetables, fruits, beans, fish, and dairy products than the recommended intakes in Chinese Food Guide Pyramid. Although they eat insufficient or/and excessive amount of grains or/and meat,27 high energy, high lipid, and low micronutrients are common problems in Chinese college students’ diet, and it has been reported that <10% students took adequate VA, VC, and Ca in daily diet.28 Furthermore, female and male students have different dietary problems: females consume lower grains and meat, but higher vegetables and fruits than male students do; nutritional assessment in females tends to nutrient deficiency, whereas nutrient intakes in males are more likely to be excessive.27,28 In our present study, college students from northern China consume lower levels of fruits, vegetables, meat, eggs, legumes, and dairy, but higher levels of oil. Insufficient and excess nutrient intakes existed at the same time, and had gender differences: female students showed higher rates of inadequate nutrient intakes and males had higher rates of excessive nutrient intakes.
On the other hand, the mean time spent in physical activities was ∼3 h/wk in the present study (male: 3.6 h/wk; female: 2.5 h/wk), and female students have higher inactive proportion than males (47.7% and 32.7%). In a cross-sectional study among 23 countries in Central and Eastern Europe, the prevalence of inactivity in leisure time ranged from 23% to 44%, and it varied with cultural and economic factors.29 Male students were more active than females in other study.30 Physical activity and healthy diet are all closely associated with physical health. The 2 health behaviors are co-existed and inter-related in daily life. It has been proven that the interventions on the 2 behaviors conducted simultaneously were more likely to promote long-term beneficial behavior changes.31
Therefore, it is crucial to establish health programs for college schools to promote and popularize health education, provide professional nutritional guidelines, improve health, and lay the foundation for future comprehensive dietary survey. Compared with the general population, students in school, especially college, are highly educated and centralized. Thus, health education is more practical in this population. Many nutrition interventions have been conducted in schools, and they have all achieved good results and improved their diet quality.11,32–36
Along with the progress in science and technology, health education can be conducted through not only traditional face-to-face lessons, but also internet. Face-book, Twitter, YouTube, and many other social media all created health communication platform.37 It has been reported that over one-third US adults look for health advice online, and online health service will be a popular and important tool for both individual and public health.38 Researches on internet-based professional health assessment and management tool have been conducted all over the world, such as America, Europe, Australia, and so on35,39,40. However, to date, there are no available tools in China. Thus, the IDQC was developed in accordance with dietary habits in China, and it will be an effective and promising electronic tool for long-term health management.
The IDQC was designed to be a comprehensive dietary assessment tool in China and covered a wide range of food items. However, we did not list fast-food as a separate food group. Fast-food is also an important part of Chinese daily diet. Western fast-food, such as hamburger, hot dog, potato chips, and so on, changed Chinese lifestyle a lot. Its convenience and taste make it spread worldwide quickly, especially among adolescents and young adults.41 But these foods are characterized by high fat, sugar, or sodium, which all contributed to obesity.42 Fast-food is also transforming and updating, and traditional Chinese food can also be included in fast-food, such as noodle, box lunch, set meal, and so on. Meanwhile, the combinations of western fast-food and local food materials often give some new nutritional characteristics to them. Accurate nutritional assessment could be developed based on food components. Considering all above, we did not list fast-food as a single group. They were separated, assigned, and analyzed into corresponding food groups.
Studies on vegetarians were limited in China. The proportion of vegetarians might be low in China, for example, 0.77% (0.45% were lactovegetarians and 0.12% were vegans) in a representative sample of Shanghai.43 Sources of energy and nutrients are grains, potatoes, legumes, vegetables, fungus, fruits, and seeds and nuts,44 which all have been fully considered in our questionnaire. In the Internet-based food frequency questionnaire, we list 88 plant foods from these 7 food groups (total 135 food items in questionnaire) and give a wide range of intake frequency and amount. Participants can select nearly all food items according to their diet habits. Vegetarians is a population with specific diet characteristics, and the validation of this online questionnaire is necessary. Our present study was conducted among college students, and more validation studies will be conducted among various populations.
LIMITATIONS
There were some limitations in our study. First, it had geographical restrictions, as our study was conducted among college students from 4 colleges in Harbin, China; thus, it may lack generalizability to other areas in China. Second, regarding the dietary intake measurement, we obtained dietary records for 3 days, which may have contributed to lower dietary food and nutrient intakes in the 3DDRs, and low correlations between the IDQC and 3DDRs. Third, regarding the completion time, the study was conducted from March to April; thus, future studies should evaluate the consumption of seasonal foods to assess the applicability of the IDQC over 1 year. Finally, regarding the questionnaire's applicability in health education, the present study suggested that the IDQC was a useful tool in cross-sectional study. Its applicability in intervention or cohort studies needs evaluated in further dietary survey and evaluation.
In conclusion, the IDQC was developed as a comprehensive, time-saving, and convenient dietary assessment tool. In the validation among college students, the intakes of the food groups and nutrients in IDQC were well correlated with those in 3-day diet records. It is an accurate tool that could be used in health education and population survey among college students in northern China. College students have unbalanced dietary habits. Both under- and over-nutrition are serious. More fruits, vegetables, legumes, dairy, and various vitamins and minerals are needed in their daily diet.
Footnotes
Abbreviations: 3DDRs = 3-day diet records, AI = adequate intake, BMI = body mass index, Ca = calcium, Cu = copper, DRIs = Dietary Reference Intakes, EAR = estimated average requirement, Fe = iron, FFQ = food frequency questionnaire, I = iodine, IDQC = internet-based diet and lifestyle questionnaire for Chinese, K = potassium, Mg = magnesium, Mn = manganese, Na = sodium, P = phosphorus, RNI = recommended nutrient intake, Se = selenium, UL = tolerable upper intake level, VA = vitamin A, VB1 = vitamin B1, VB2 = vitamin B2, VC = vitamin C, VE = vitamin E, WC = waist circumstance, Zn = zinc.
S-SD and Y-SJ equally contributed to this study.
All authors had access to the data and contributed to conception, design, data analysis, or interpretation. The manuscript has been read and approved by all the authors. Funding: the project was supported by the National Natural Science Fund of China (No. 81573133) and the National 12th Five-Year Scientific and Technical Support Program of China (2012BAI02B02).
The authors have no conflicts of interest to disclose.
REFERENCES
- 1.Hu FB, Liu Y, Willett WC. Preventing chronic diseases by promoting healthy diet and lifestyle: public policy implications for China. Obes Rev 2011; 12:552–559. [DOI] [PubMed] [Google Scholar]
- 2.Kuwabara M, Nishi Y, Niwa K, et al. High protein diet may be an independent risk factor of hypertension. Eur Heart J 2013; 34 suppl 1:4652. [Google Scholar]
- 3.Choi JH, Woo HD, Lee JH, et al. Dietary patterns and risk for metabolic syndrome in Korean women: a cross-sectional study. Medicine 2015; 94:e1424. [DOI] [PMC free article] [PubMed] [Google Scholar]
- 4.Estruch R, Ros E, Martinez-Gonzalez MA. Mediterranean diet for primary prevention of cardiovascular disease. N Engl J Med 2013; 369:676–677. [DOI] [PubMed] [Google Scholar]
- 5.Beltrán-Sánchez H, Harhay MO, Harhay MM, et al. Prevalence and trends of metabolic syndrome in the adult US population, 1999–2010. J Am Coll Cardiol 2013; 62:697–703. [DOI] [PMC free article] [PubMed] [Google Scholar]
- 6.Wang Y, Mi J, Shan X, et al. Is China facing an obesity epidemic and the consequences? The trends in obesity and chronic disease in China. Int J Obes 2007; 31:177–188. [DOI] [PubMed] [Google Scholar]
- 7.Sublette ME, Segal-Isaacson CJ, Cooper TB, et al. Validation of a food frequency questionnaire to assess intake of n-3 polyunsaturated fatty acids in subjects with and without major depressive disorder. J Am Diet Assoc 2011; 111:117–123. [DOI] [PMC free article] [PubMed] [Google Scholar]
- 8.Haftenberger M, Heuer T, Heidemann C, et al. Relative validation of a food frequency questionnaire for national health and nutrition monitoring. Nutr J 2010; 9:36. [DOI] [PMC free article] [PubMed] [Google Scholar]
- 9.Bonell C, Wells H, Harden A, et al. The effects on student health of interventions modifying the school environment: systematic review. J Epidemiol Community Health 2013; 67:677–681. [DOI] [PubMed] [Google Scholar]
- 10.Morin P, Demers K, Robitaille E, et al. Do schools in Quebec foster healthy eating? An overview of associations between school food environment and socio-economic characteristics. Public Health Nutr 2015; 18:1635–1646. [DOI] [PMC free article] [PubMed] [Google Scholar]
- 11.Ha EJ, Caine-Bish N. Effect of nutrition intervention using a general nutrition course for promoting fruit and vegetable consumption among college students. J Nutri Educ Behav 2009; 41:103–109. [DOI] [PubMed] [Google Scholar]
- 12.Fan M, Lyu J, He P. Chinese guidelines for data processing and analysis concerning the International Physical Activity Questionnaire. Zhonghua Liu Xing Bing Xue Za Zhi 2014; 35:961–964. [PubMed] [Google Scholar]
- 13.Yang YX, Wang GY, Pan XC. China food composition. Beijing: Peking University Medical Press; 2009. [Google Scholar]
- 14.Ge K. The transition of Chinese dietary guidelines and food guide pagoda. Asia Pac J Clin Nutr 2011; 20:439–446. [PubMed] [Google Scholar]
- 15.Bohlscheid-Thomas S, Hoting I, Boeing H, et al. Reproducibility and relative validity of food group intake in a food frequency questionnaire developed for the German part of the EPIC project. European Prospective Investigation into Cancer and Nutrition. Int J Epidemiol 1997; 26 suppl 1:S59–S70. [DOI] [PubMed] [Google Scholar]
- 16.Apovian CM, Murphy MC, Cullum-Dugan D, et al. Validation of a web-based dietary questionnaire designed for the DASH (Dietary Approaches to Stop Hypertension) diet: the DASH Online Questionnaire. Public Health Nutr 2010; 13:615–622. [DOI] [PMC free article] [PubMed] [Google Scholar]
- 17.Guallar-Castillón P, Sagardui-Villamor J, Balboa-Castillo T, et al. Validity and Reproducibility of a Spanish Dietary History. PloS one 2014; 9:e86074. [DOI] [PMC free article] [PubMed] [Google Scholar]
- 18.Bolca S, Huybrechts I, Verschraegen M, et al. Validity and reproducibility of a self-administered semi-quantitative food-frequency questionnaire for estimating usual daily fat, fibre, alcohol, caffeine and theobromine intakes among Belgian post-menopausal women. Int J Environ Res Public Health 2009; 6:121–150. [DOI] [PMC free article] [PubMed] [Google Scholar]
- 19.Du H, van der A DL, van Bakel MM, et al. Reproducibility and relative validity of dietary glycaemic index and glycaemic load assessed by the food-frequency questionnaire used in the Dutch cohorts of the European Prospective Investigation into Cancer and Nutrition. Br J Nutr 2009; 102:601–604. [DOI] [PubMed] [Google Scholar]
- 20.Willett WC. Future directions in the development of food-frequency questionnaires. Am J Clin Nutr 1994; 59 (1 Suppl):171S–174S. [DOI] [PubMed] [Google Scholar]
- 21.Cade J, Thompson R, Burley V, et al. validation and utilisation of food-frequency questionnaires—a review. Public Health Nutr 2002; 5:567–587. [DOI] [PubMed] [Google Scholar]
- 22.Nelson M, Atkinson M, Darbyshire S. Food photography II: use of food photographs for estimating portion size and the nutrient content of meals. Br J Nutr 1996; 76:31–49. [DOI] [PubMed] [Google Scholar]
- 23.Robson PJ, Livingstone MB. An evaluation of food photographs as a tool for quantifying food and nutrient intakes. Public Health Nutr 2000; 3:183–192. [DOI] [PubMed] [Google Scholar]
- 24.Nelson M, Atkinson M, Darbyshire S. Food photography I: the perception of food portion size from photographs. Br J Nutr 1994; 72:649–663. [DOI] [PubMed] [Google Scholar]
- 25.Palaniappan U, Cue RI, Payette H, et al. Implications of day-to-day variability on measurements of usual food and nutrient intakes. J Nutr 2003; 133:232–235. [DOI] [PubMed] [Google Scholar]
- 26.Matthys C, Pynaert I, De Keyzer W, et al. Validity and reproducibility of an adolescent web-based food frequency questionnaire. J Am Diet Assoc 2007; 107:605–610. [DOI] [PubMed] [Google Scholar]
- 27.Tang HY, Chen H, Yang SD, et al. Evaluation of dietary quality of university students in Shanxi province by DBI. Chin J Sch Health 2013; 34:1412–1417. [Google Scholar]
- 28.Zhang L, Liang MH. Energy and nutrients intakes of university students. Chin Rural Health Serv Adm 2014; 34:1486–1488. [Google Scholar]
- 29.Haase A, Steptoe A, Sallis JF, et al. Leisure-time physical activity in university students from 23 countries: associations with health beliefs, risk awareness, and national economic development. Prev Med 2004; 39:182–190. [DOI] [PubMed] [Google Scholar]
- 30.Yahia N, Wang D, Rapley M, et al. Assessment of weight status, dietary habits and beliefs, physical activity, and nutritional knowledge among university students. Perspect Public Health 2015. [DOI] [PubMed] [Google Scholar]
- 31.James EL, Stacey FG, Chapman K, et al. Impact of a nutrition and physical activity intervention (ENRICH: Exercise and Nutrition Routine Improving Cancer Health) on health behaviors of cancer survivors and carers: a pragmatic randomized controlled trial. BMC Cancer 2015; 15:710. [DOI] [PMC free article] [PubMed] [Google Scholar]
- 32.Robinson-O’Brien R, Story M, Heim S. Impact of garden-based youth nutrition intervention programs: a review. J Am Diet Assoc 2009; 109:273–280. [DOI] [PubMed] [Google Scholar]
- 33.Boucher D, Gagne C, Cote F. Effect of an intervention mapping approach to promote the consumption of fruits and vegetables among young adults in junior college: a quasi-experimental study. Psychol Health 2015; 30:1306–1325. [DOI] [PubMed] [Google Scholar]
- 34.Aboul-Enein BH, Bernstein J. Feasibility of internet-based post-secondary nutrition education: incorporating features of the mediterranean diet. Health Promot Perspect 2015; 5:92–97. [DOI] [PMC free article] [PubMed] [Google Scholar]
- 35.Monroe JT, Lofgren IE, Sartini BL, et al. The Green Eating Project: web-based intervention to promote environmentally conscious eating behaviours in US university students. Public Health Nutr 2015; 18:1–11. [DOI] [PMC free article] [PubMed] [Google Scholar]
- 36.Schroeter C, House L, Lorence A. Fruit and vegetable consumption among college students in Arkansas and Florida: food culture vs. health knowledge. Int Food Agribus Man 2007; 10:63–89. [Google Scholar]
- 37.Moorhead SA, Hazlett DE, Harrison L, et al. A new dimension of health care: systematic review of the uses, benefits, and limitations of social media for health communication. J Med Internet Res 2013; 15:e85. [DOI] [PMC free article] [PubMed] [Google Scholar]
- 38.Jha A, Lin L, Savoia E. The use of social media by State Health Departments in the US: analyzing health communication through facebook. J Community Health 2015. [DOI] [PubMed] [Google Scholar]
- 39.Gurinovic M, Milesevic J, Novakovic R, et al. Improving nutrition surveillance and public health research in Central and Eastern Europe/Balkan countries using the Balkan Food Platform and dietary tools. Food Chem 2016; 193:173–180. [DOI] [PubMed] [Google Scholar]
- 40.Swierk M, Williams PG, Wilcox J, et al. Validation of an Australian electronic food frequency questionnaire to measure polyunsaturated fatty acid intake. Nutrition 2011; 27:641–646. [DOI] [PubMed] [Google Scholar]
- 41.Ebbeling CB, Sinclair KB, Pereira MA, et al. Compensation for energy intake from fast food among overweight and lean adolescents. JAMA 2004; 291:2828–2833. [DOI] [PubMed] [Google Scholar]
- 42.An R, Liu J. Fast-food and full-service restaurant consumption in relation to daily energy and nutrient intakes among US adult cancer survivors, 2003–2012. Nutr Health 2015. [DOI] [PubMed] [Google Scholar]
- 43.Mao XX, Shen XH, Tang WJ, et al. Prevalence of vegetarians and vegetarian’ s health dietary behavior survey in Shanghai. Wei Sheng Yan Jiu 2015; 44:237–241. [PubMed] [Google Scholar]
- 44.Li XJ, Yan B, Yang SY. The influences and mechanism of vegetarian diets on metabolism. Yi Xue Zong Shu 2010; 16:1351–1353. [Google Scholar]


