Abstract
International collaboration is important in healthcare quality evaluation; however, few international comparisons of general surgery outcomes have been accomplished. Furthermore, predictive model application for risk stratification has not been internationally evaluated. The National Clinical Database (NCD) in Japan was developed in collaboration with the American College of Surgeons National Surgical Quality Improvement Program (ACS-NSQIP), with a goal of creating a standardized surgery database for quality improvement. The study aimed to compare the consistency and impact of risk factors of 3 major gastroenterological surgical procedures in Japan and the United States (US) using web-based prospective data entry systems: right hemicolectomy (RH), low anterior resection (LAR), and pancreaticoduodenectomy (PD).
Data from NCD and ACS-NSQIP, collected over 2 years, were examined. Logistic regression models were used for predicting 30-day mortality for both countries. Models were exchanged and evaluated to determine whether the models built for one population were accurate for the other population.
We obtained data for 113,980 patients; 50,501 (Japan: 34,638; US: 15,863), 42,770 (Japan: 35,445; US: 7325), and 20,709 (Japan: 15,527; US: 5182) underwent RH, LAR, and, PD, respectively. Thirty-day mortality rates for RH were 0.76% (Japan) and 1.88% (US); rates for LAR were 0.43% versus 1.08%; and rates for PD were 1.35% versus 2.57%. Patient background, comorbidities, and practice style were different between Japan and the US. In the models, the odds ratio for each variable was similar between NCD and ACS-NSQIP. Local risk models could predict mortality using local data, but could not accurately predict mortality using data from other countries.
We demonstrated the feasibility and efficacy of the international collaborative research between Japan and the US, but found that local risk models remain essential for quality improvement.
INTRODUCTION
Improving the quality of surgical procedures is dependent on the collection of accurate data. The National Clinical Database (NCD) in Japan was developed in collaboration with the American College of Surgeons National Surgical Quality Improvement Program (ACS-NSQIP), with a shared goal of creating a standardized surgery database for quality improvement. NCD and ACS-NSQIP have developed systems using standardized variable definitions to collect data on risk factors and outcomes after surgery. These databases collect prospective rather than retrospective data. Both use web-based data collection software, contributing to effective quality improvement, via benchmarking and risk-adjusted feedback reports to hospitals; this enables the identification of specific problems and works towards their improvement. The ACS initiated ACS-NSQIP in 2006 and demonstrated improved surgical outcomes among participating private sector hospitals.1 More than 500 hospitals participated in ACS-NSQIP. NCD in Japan, which was launched in 2010, is a nationwide prospective registry linked to the surgical board certification system. NCD systematically collects accurate data on structures, processes, and outcomes, to develop a standardized surgery database for quality improvement and healthcare quality evaluation.2 NCD contains the records of >1,200,000 surgical cases collected in 2011, with approximately 4000 institutions participating in 2013.
One of the important advantages of NCD and ACS-NSQIP is the ability to benchmark and compare risk-adjusted outcomes. This ability allows fair comparisons to be made along with collaborative learning. International collaboration is important in healthcare quality evaluation and produces meaningful results; however, few international comparisons of general surgery outcomes using clinical registry data have been accomplished. There is a lack of data regarding outcomes of Japanese patients undergoing gastroenterological surgery and comparison with the United States (US). Furthermore, predictive model application for clinical risk stratification has not been internationally evaluated. Differences in the prevalence of patient comorbidities and their association with outcomes remain unknown. The purpose of this study was to compare patient characteristics; procedure details; operative outcomes; the consistency and impact of risk factors for 3 major gastroenterological surgery procedures: right hemicolectomy (RH), low anterior resection (LAR), and pancreaticoduodenectomy (PD) in Japan and US; and to examine whether risk prediction models built for one population were accurate for the other population. To the best of our knowledge, this is the first study to use large, high-quality data from different patient populations.
METHODS
Study Design and Outcomes
Patient cohorts and risk subcategories for RH, LAR, and PD were selected from both NCD/Japan and ACS-NSQIP/US data. Univariate analysis of each selected predictors for the 3 procedures was conducted for both datasets. Subsequent multivariate models were separately constructed using data from NCD and ACS-NSQIP. Finally, risk models were exchanged and evaluated to determine whether risk prediction models built for one population were accurate for the other population.
Data from NCD and ACS-NSQIP collected over 2 years (2011–2012) were examined. The primary outcome measure of this study was 30-day mortality. Thirty-day mortality was defined as death within 30 days after the operation date regardless of whether the patient had been discharged from initial admission.
Data Acquisition and Patient Selection
The NCD project was approved on November 2010 by the Japan Surgical Society Ethics Committee. The developmental history and current status of the NCD, including sampling strategy, data abstraction procedures, variables collected, outcomes, and structure, are described elsewhere.2,3 NCD recruits individuals to approve the inputted data from members of various departments in charge of annual cases, as well as data entry officers through a web-based data management system to assure the traceability of the data. NCD conducted onsite audits using source data randomly for mortality, and the results were found to be accurate. Currently, NCD is planning to perform onsite and remote audit for verifying the accuracy of existing data for morbidities. The ACS-NSQIP program and dataset have been described elsewhere.4,5 Data are abstracted by trained Surgical Clinical Reviewers using standardized definitions, including patient demographics, comorbidities, laboratory values, operative variables, and complications.
Patients who underwent RH, LAR, and PD were identified using Current Procedural Terminology (CPT) (US) and NCD codes (Japan). Both NCD and ACS-NSQIP contain patient cohorts limited to malignant tumor patients only. Any records with entry denied by patients were excluded from this analysis. Records with missing information regarding age, sex, or status at 30 days postoperation were also excluded. For the PD procedure, we excluded cases with simultaneous major hepatectomy.
All variables, definitions, and inclusion criteria in NCD/Japan are accessible on the NCD website (http://www.ncd.or.jp/). Descriptions of the qualifications, auditing of data collection personnel, case inclusion criteria, sampling data collection strategy, and variable and outcome definitions in ACS-NSQIP/US are available online in ACS-NSQIP user guide.6
Variables
Two sets of predictive variables were constructed from the NCD/Japan and ACS NSQIP/US data fields. Patient demographic variables considered were age and sex. General factors considered were as follows: preoperative functional status (independent, partially dependent, or totally dependent); American Society of Anesthesiologists (ASA) class; dyspnea (none, moderate exertion, or at rest); emergency cases; and body mass index (BMI: normal, underweight, overweight, and 3 categories of obesity). ASA class was not considered in further multivariate analysis because the criterion to determine class was inconsistent between countries. Comorbidities included were diabetes (oral medication or insulin-dependent); a history of chronic obstructive pulmonary disease (COPD); hypertension requiring medication; congestive heart failure; bleeding disorders; sepsis (systemic inflammatory response syndrome, sepsis, and septic shock); disseminated cancer; chronic kidney disease (CKD) stage; and weight loss (>10% in previous 6 mo). Length of hospital stay was also compared.
Preoperative laboratory variables examined included albumin, white blood count, prothrombin time-international normalized ratio (PT-INR), total bilirubin, and aspartate aminotransferase (AST). Missing laboratory data continued as separate categories. It should be noted that missing values are virtually nonexistent for predictors, except for laboratory variables, where clinical issues have a substantial impact on the ordering of tests.
Statistical Analysis
Raw frequencies and chi-square tests were used to assess differences in the distribution of general factors, comorbidities, and laboratory values, as well as their association with 30-day mortality. Because of the low number of deaths, the risk models were developed with a limited number of variables.7 To identify these variables, we first used a logistic regression technique with forward selection to identify the most significant predictor variables. Sharing the same SAS code, we generated 3 models (1 for each surgical group) in each country, with lists of the top predictors (data not shown). We used these lists to select a common set of predictors to be used in the final risk models. For the final risk models, logistic regression techniques with forced selection were used to develop models that predict 30-day mortality using a set of relevant comparably defined risk factor variables in both countries. Model fit was assessed using Hosmer–Lemeshow goodness-of-fit statistic for calibration and c-statistic for discrimination.8,9 The c-statistic allows model discrimination to be measured, with 1.0 indicating perfect discrimination and 0.5 being no better than chance. These models were then used to predict mortality using data from the other dataset (ie, the NCD model was used to predict mortality using the ACS-NSQIP data and vice versa). Observed and expected mortality rates were compared. All data manipulation and analysis were performed with SAS version 9.3 (SAS Institute Inc.).
RESULTS
Risk Profiles and Outcomes
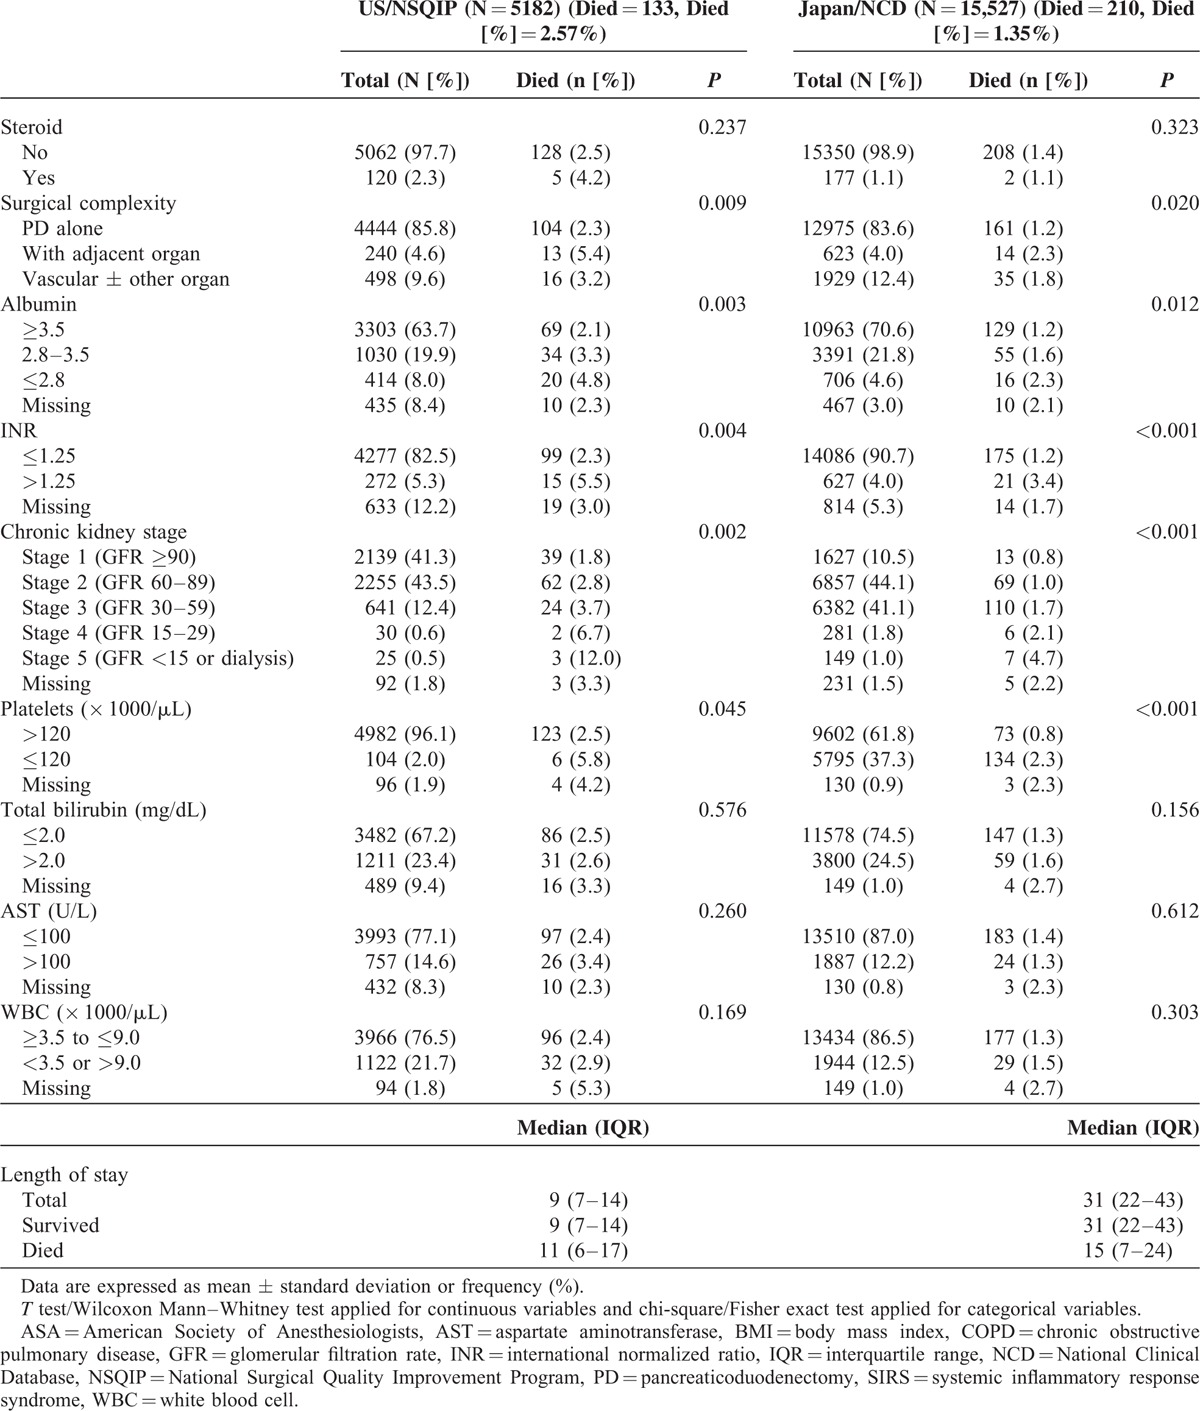
During the study period, a total of 50,501 patients underwent RH (Japan, 34,638; US, 15,863), 42,770 patients underwent LAR (Japan, 35,445; US, 7325), and 20,709 patients underwent PD (Japan, 15,527; US, 5182). Thirty-day unadjusted mortality rates for RH were 0.76% in Japan and 1.88% in US; mortality rates for LAR were 0.43% in Japan and 1.08% in US; and mortality rates for PD were 1.35% in Japan and 2.57% in US. The risk profiles and outcomes of each procedure from both databases are described in Table 1 (RH), Table 2 (LAR), and Table 3 (PD). The ACS-NSQIP population for each procedure tended to be younger. When we looked at the 30-day mortality associated with age, we observed that in both countries, mortality increases as age increases; however, the effect was more pronounced in the ACS-NSQIP data. Laparoscopy was conducted in 36.6% of the Japanese and 56.9% of the US RHs, and 42.9% of the Japanese and 44.2% of the US LARs. Notably, the percentage of patients with a high BMI substantially differed between cohorts. The ACS-NSQIP cohort had a significantly shorter length of hospital stay. The prevalence of patients with CKD differed between Japan and US. Univariate analysis revealed the patient risk factors that were significant predictors of mortality after RH, LAR, and PD (Tables 1–3 ).
TABLE 1.
Univariate Analysis for 30-Day Mortality of Right Hemicolectomy
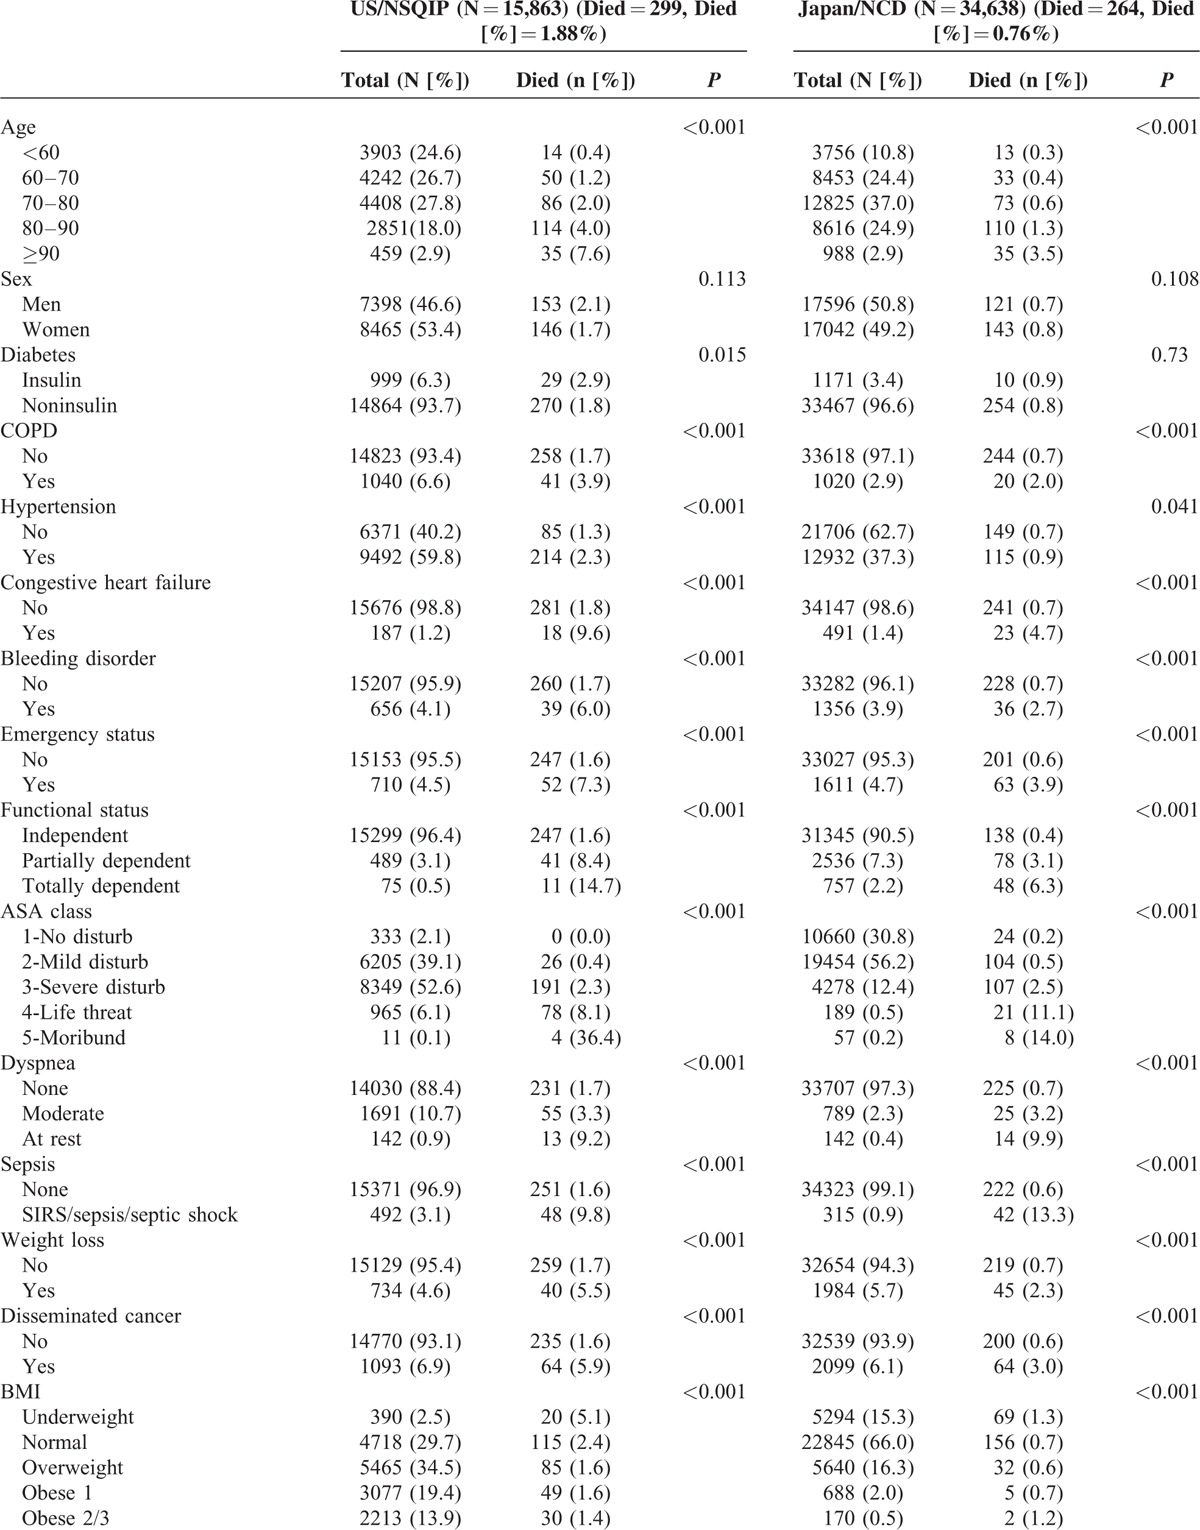
TABLE 1 (Continued).
Univariate Analysis for 30-Day Mortality of Right Hemicolectomy
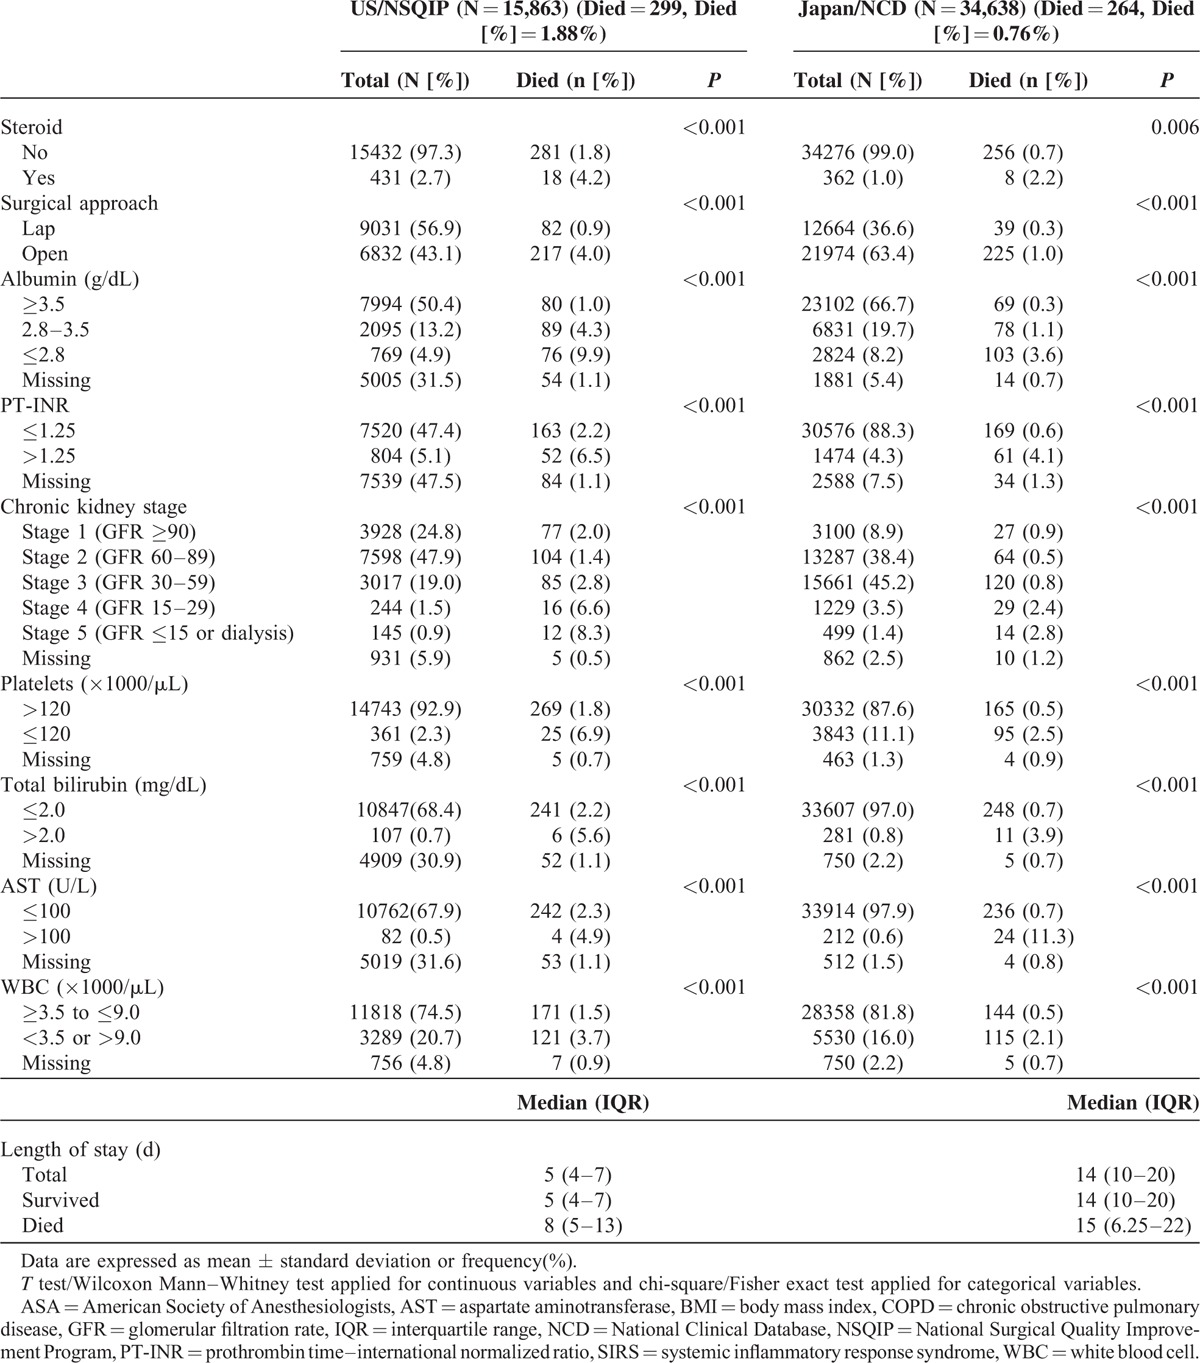
TABLE 2.
Univariate Analysis for 30-Day Mortality of Low Anterior Resection
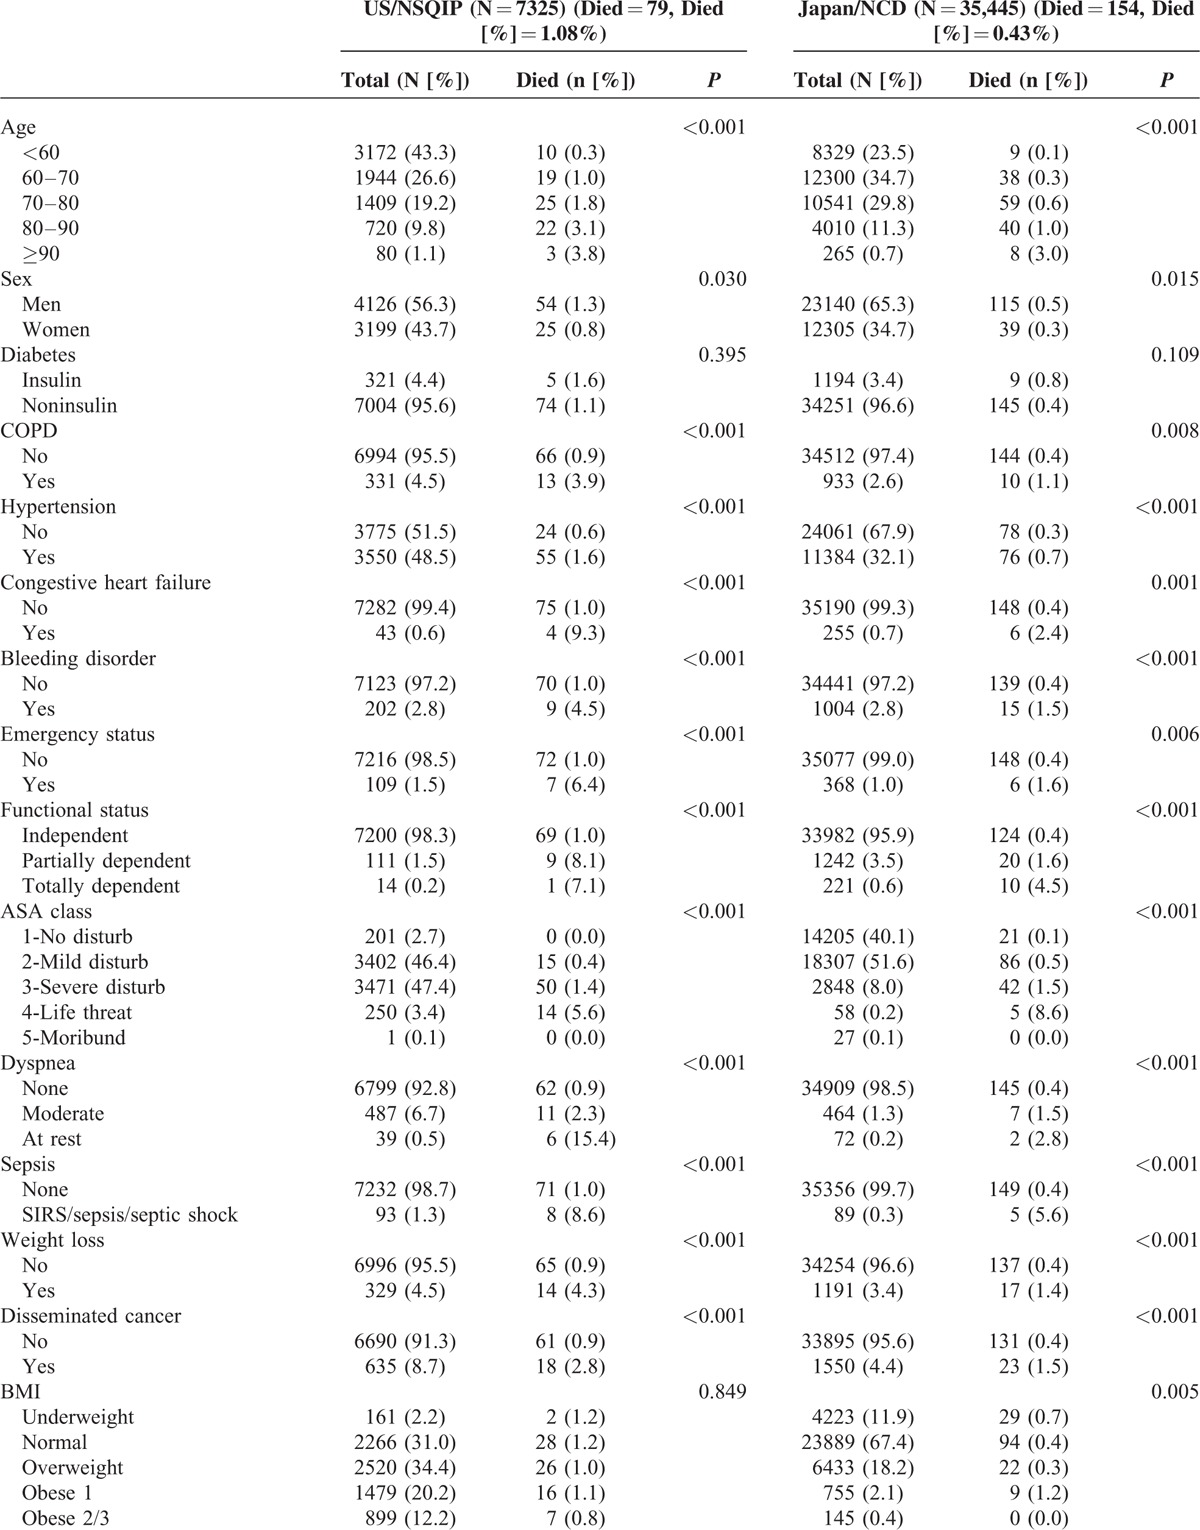
TABLE 3 (Continued).
Univariate Analysis for 30-Day Mortality of Pancreaticoduodenectomy
The Risk Models for Mortalities
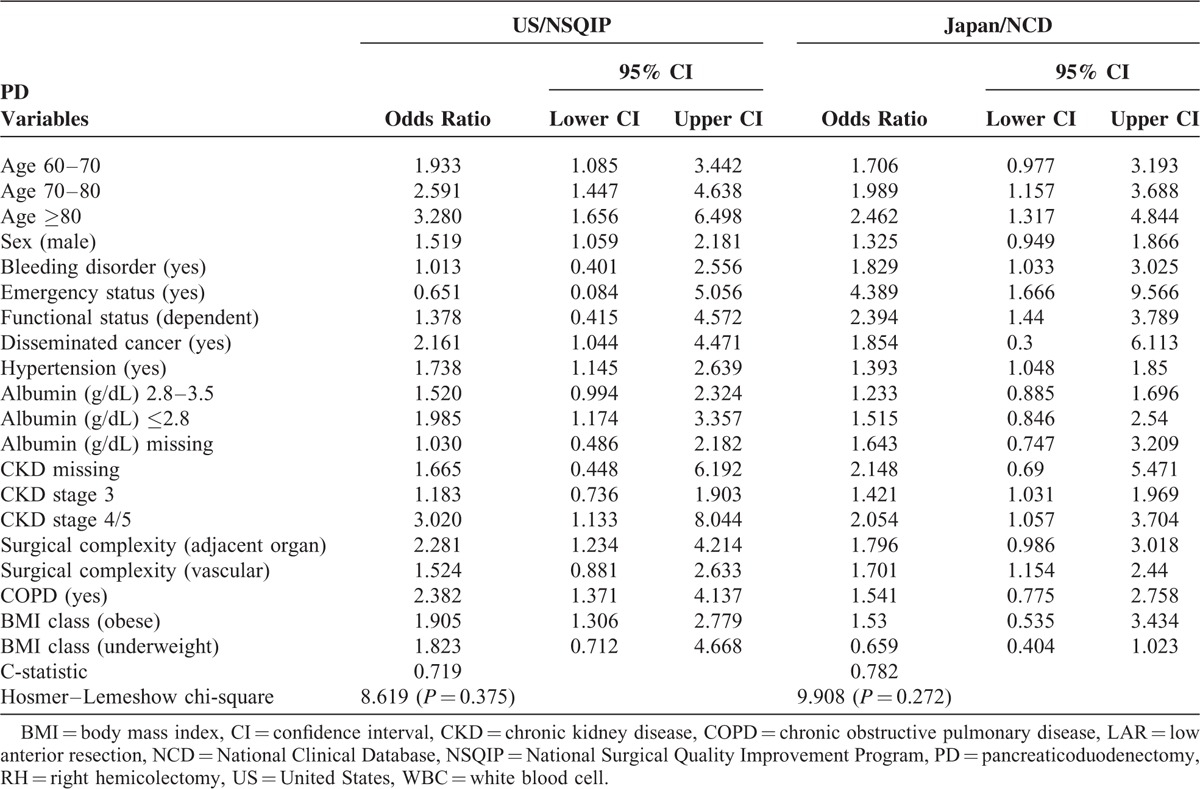
The final logistic model for 30-day mortalities of each procedure, along with odds ratios (ORs) and 95% confidence intervals (CIs), is presented in Table 4 . For RH, 14 significant risk factors for 30-day mortality were identified in Japan, and, in contrast, 17 significant risk factors were identified in US. The c-statistic was calculated to evaluate model performance. The c-statistic was 0.857 for the Japan model and 0.840 for the US model, indicating adequate discrimination. The Hosmer–Lemeshow statistic was 11.243 (P = 0.19) for the Japan model and 5.8660 (P = 0.66) for the US model, indicating both models adequately assigned risk. For LAR, 12 significant risk factors for 30-day mortality were identified in Japan; in contrast, 10 significant risk factors were identified in US. The c-statistic was 0.782 for the Japan model and 0.822 for the US model, indicating adequate discrimination. The Hosmer–Lemeshow statistic was 5.2355 (P = 0.63) for the Japan model and 10.9464 (P = 0.20) for the US model, indicating both models adequately assigned risk. For PD, 9 significant risk factors for 30-day mortality were identified in Japan; in contrast, 11 significant risk factors were identified in US. The c-statistic was 0.684 for the Japan model and 0.719 for the US model, indicating good discrimination. The Hosmer–Lemeshow statistic was 9.908 (P = 0.27) for the Japan model and 8.6192 (P = 0.38) for the US model, indicating both models adequately assigned risk. ORs for each variable were similar between countries.
TABLE 2 (Continued).
Univariate Analysis for 30-Day Mortality of Low Anterior Resection
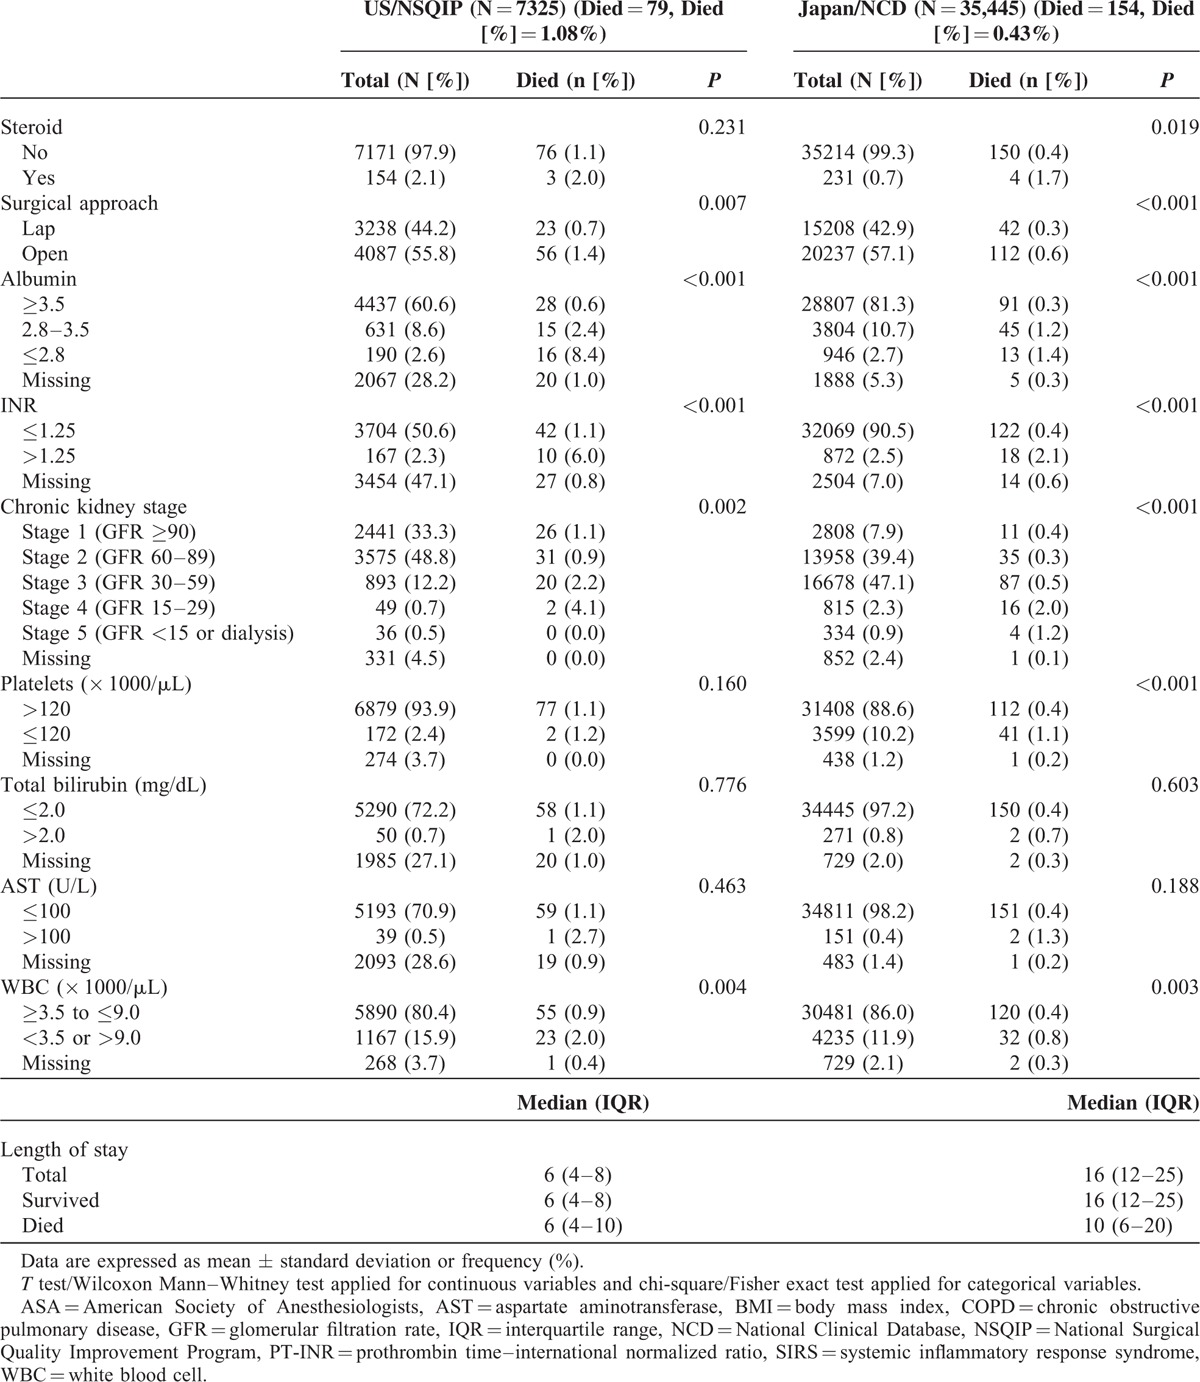
TABLE 4.
Risk Models of Preoperative Factors for 30-Day Mortality Rates After RH, LAR, and PD
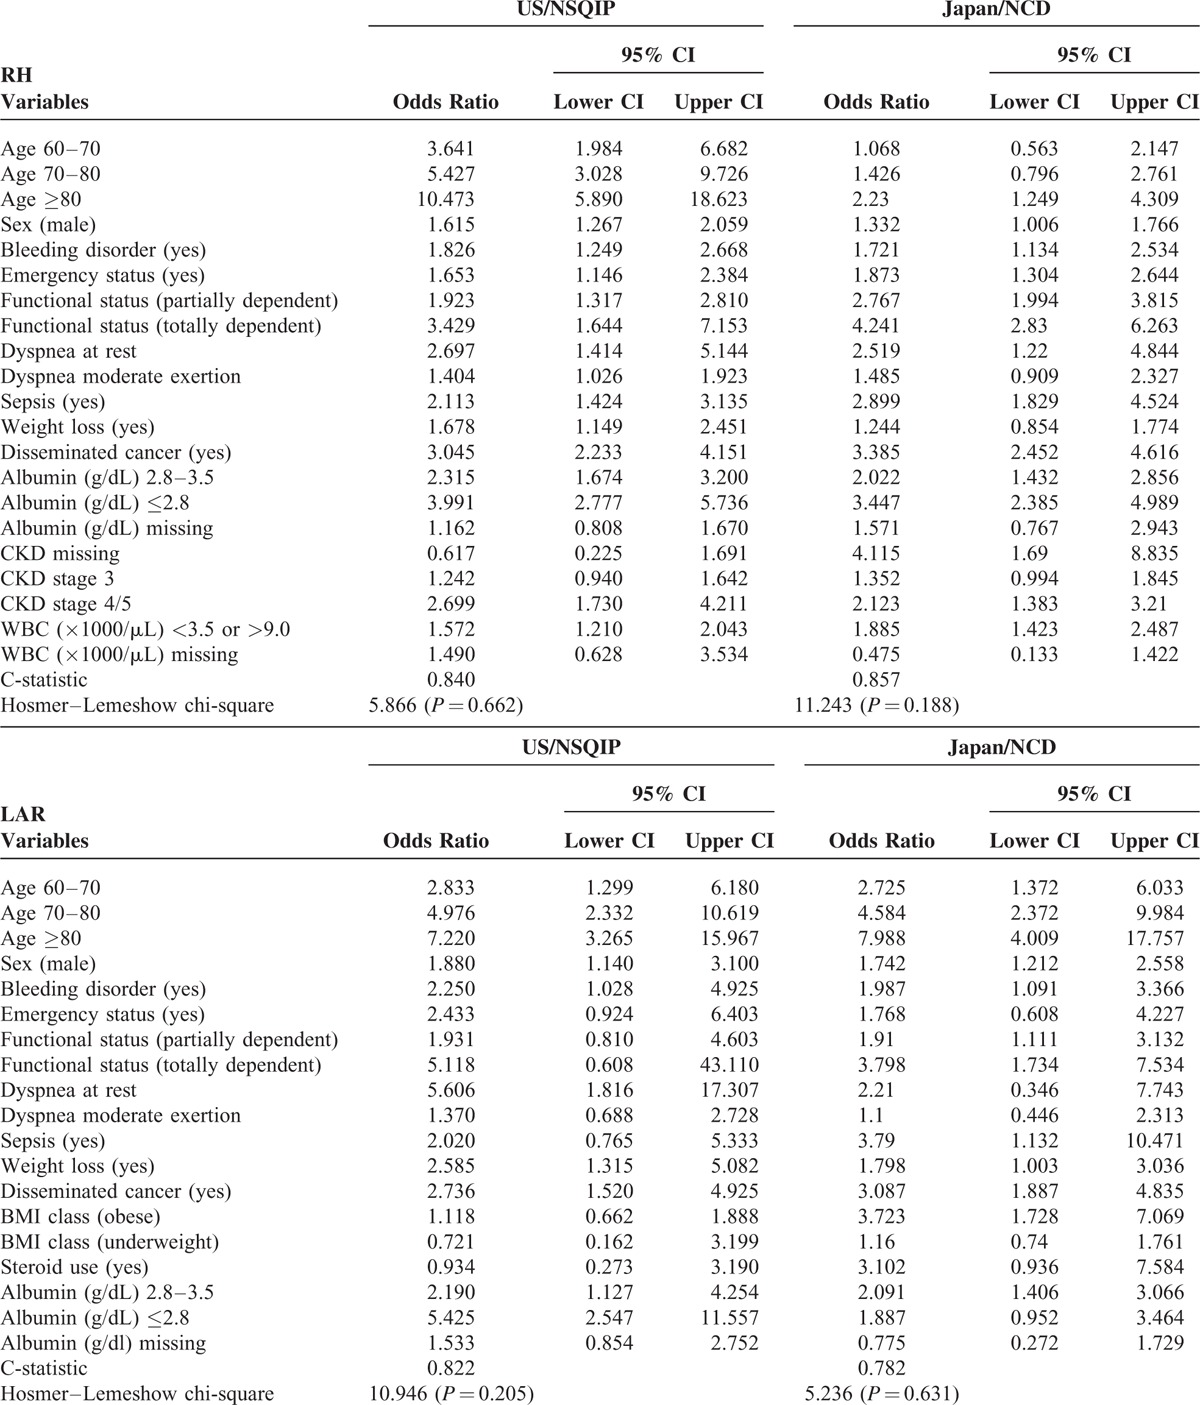
TABLE 4 (Continued).
Risk Models of Preoperative Factors for 30-Day Mortality Rates After RH, LAR, and PD
Exchange Each Risk Model
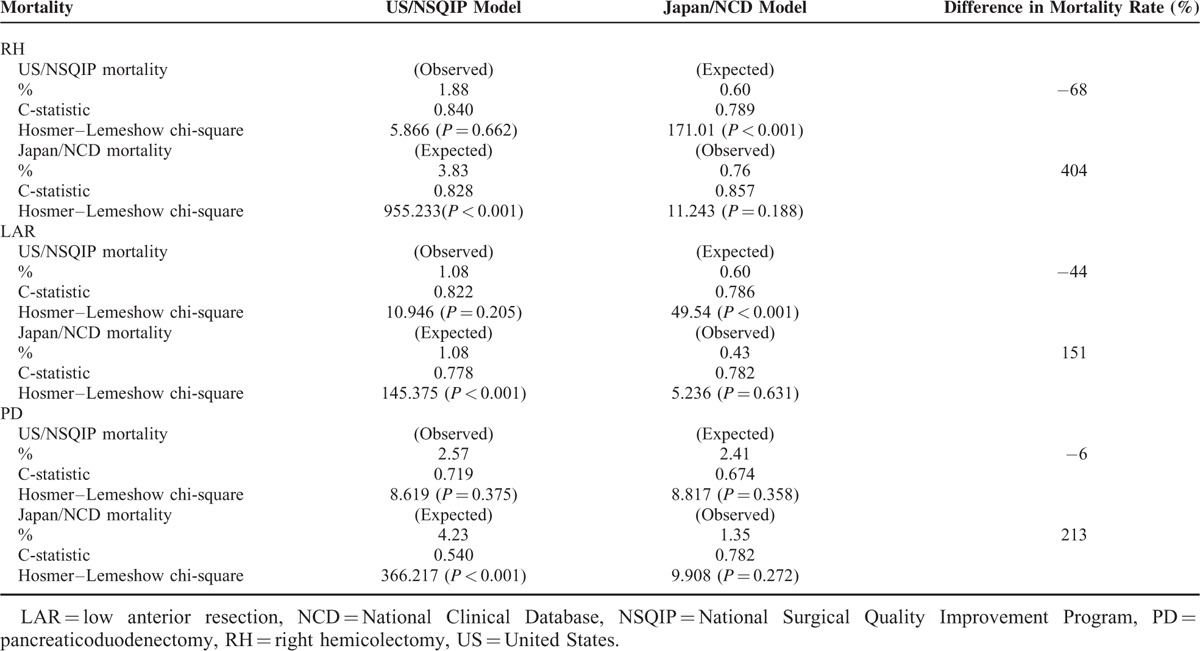
Models were exchanged between countries and were used to create new models with forced selection to evaluate model transferability (Table 5). For RH, the c-statistic was 0.789 based on US data using the Japan model formula and 0.828 based on Japanese data using the US model formula, indicating adequate but decreased discrimination. The Hosmer–Lemeshow statistic was 171.01 (P < 0.001) based on US data using the Japan model formula and 955.23 (P < 0.001) based on Japanese data using the US model, indicating neither model adequately assigned risk. For LAR, the c-statistic was 0.786 based on US data using the Japan model formula and 0.778 based on Japanese data using the US model formula, indicating good but decreased discrimination. The Hosmer–Lemeshow statistic was 49.54 (P < 0.001) based on US data using the Japan model formula and 145.37 (P < 0.001) based on Japanese data using the US model, indicating neither model adequately assigned risk. For PD, the c-statistic was 0.674 based on US data using the Japan model formula and 0.540 based on Japanese data using the US model formula, indicating inadequate discrimination. The Hosmer–Lemeshow statistic was 8.8173 (P = 0.36) based on US data using the Japan model formula and 366.22 (P < 0.001) based on Japanese data using the US model. In all three procedures, we ran each risk model using the other country's data to assess the discrimination of each model.
TABLE 3.
Univariate Analysis for 30-Day Mortality of Pancreaticoduodenectomy
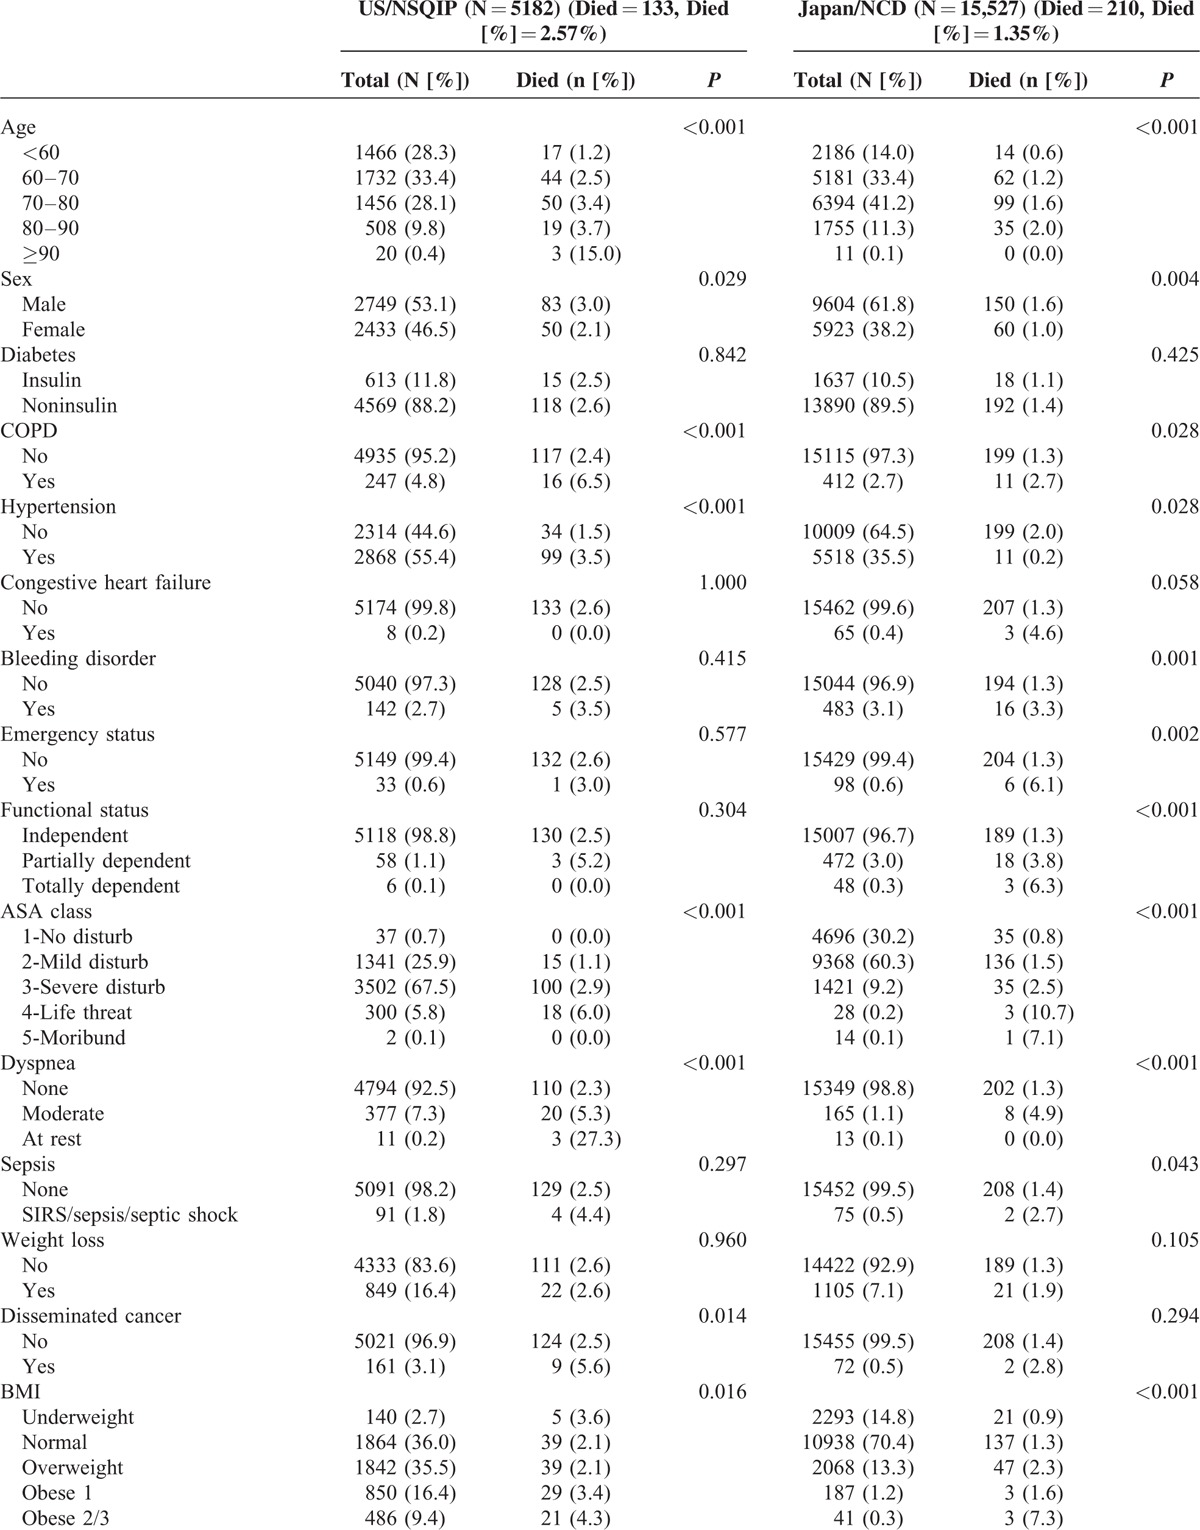
TABLE 5.
Observed and Expected Mortality after RH, LAR, and PD
Observed and Expected Mortality
Both NCD and ACS-NSQIP models were able to predict the number of deaths in the Japan dataset accurately. However, we decreased accuracy when using models from one country's dataset to predict the number of deaths in the other; we sound the ACS-NSQIP model overpredicted deaths in the NCD dataset, whereas the NCD model underpredicted deaths in the ACS-NSQIP dataset (Table 5). Figures 1 and 2 show the 30-day mortality model calibrations and observed event rates versus predicted rates. In measures of calibration (Hosmer–Lemeshow plots), the y axis gives the predicted number of deaths, and the x axis gives the actual number of deaths observed, that is, a perfect straight line would be a perfect model. Risk models based on local data accurately predicted mortality rates; however, risk models based on the other country's data could not accurately predict mortality rates.
FIGURE 1.
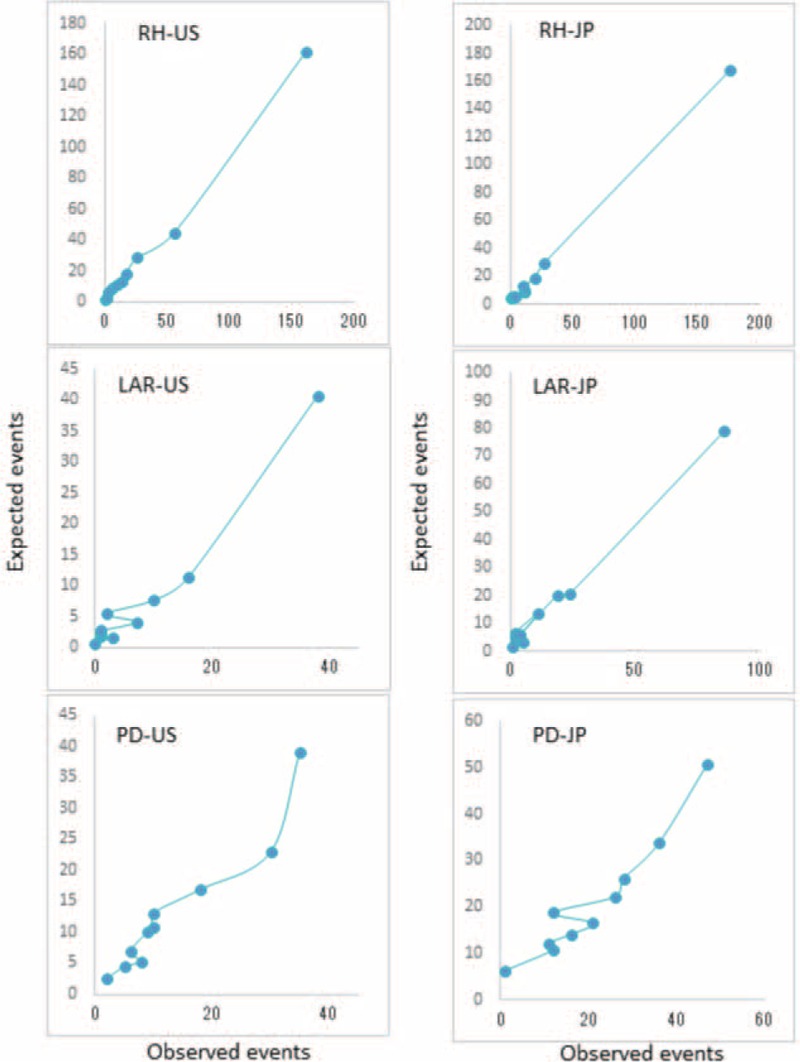
Calibration for 30-day mortality models for RH, LAR, and PD based on the US data using the US/ACS-NSQIP model (US) and the Japanese data using the Japan/NCD model (JP). ACS-NSQIP = American College of Surgeons National Surgical Quality Improvement Program, JP = Japan, LAR = low anterior resection, PD = pancreaticoduodenectomy, RH = right hemicolectomy, US = United States.
FIGURE 2.
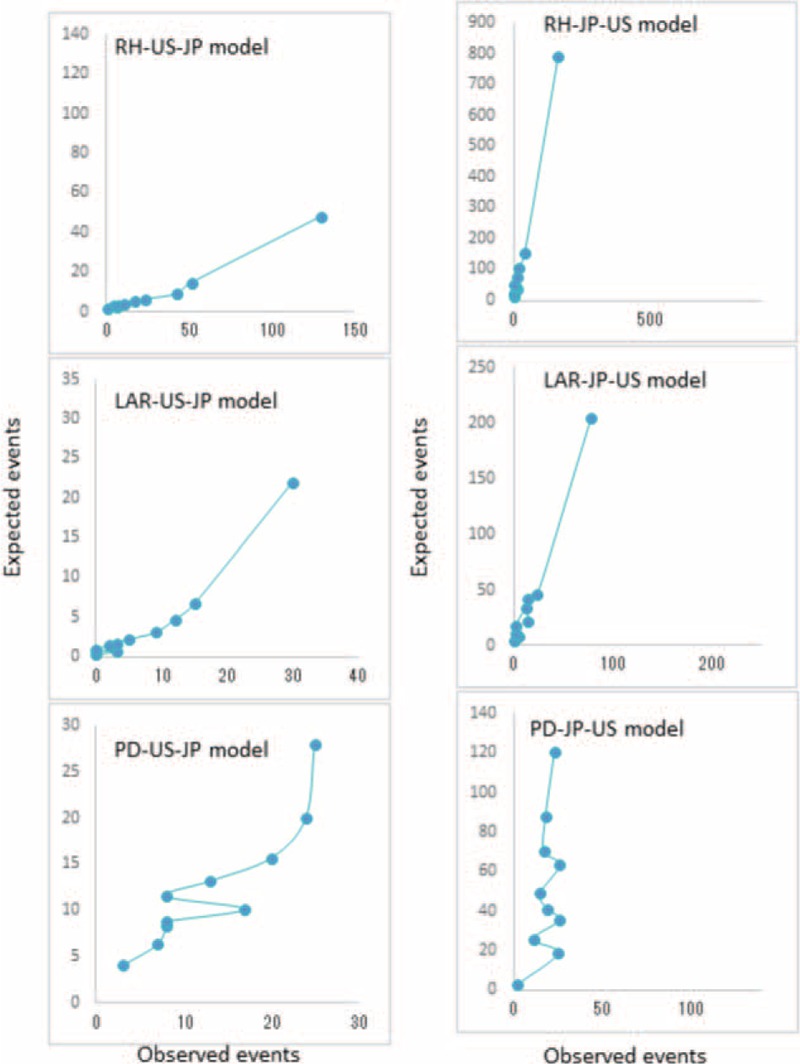
Calibration for 30-day mortality models for RH, LAR, and PD based on the US data using the Japan/NCD model (US-JP model) and the Japanese data using the US/ACS-NSQIP model (JP-US model). ACS-NSQIP = American College of Surgeons National Surgical Quality Improvement Program, JP = Japan, LAR = low anterior resection, PD = pancreaticoduodenectomy, RH = right hemicolectomy, US = United States.
DISCUSSION
Our study is the first international comparison of nationwide operative mortality in gastroenterological surgery using similar web-based prospective data entry systems, with collaboration between the NCD/Japan and the ACS-NSQIP/US. Although some international comparative studies provided variations in mortality rate between countries,10,11 these studies were under the restriction of the inherent differences in the data collection methods between the datasets. Also, these studies did not examine whether risk prediction models built for one population were accurate for the other population. ACS-NSQIP participation have not offered a clear mechanism for quality improvement12,13; however, these are undeniably considered the highest clinical quality standards for evaluating risk-adjusted surgical outcomes. Both use rigorous, standardized data collection methods. Preoperative variables are clearly defined with the same definitions used in both databases and the same defined data collection methodology, including a strict follow-up period for outcomes.2,14 By comparing the 2 datasets, we found differences in the following: descriptive data including preoperative patient variables; definitions and interpretation of ASA classifications; missing data from preoperative blood tests; duration of hospital stay after surgery; and 30-day mortality. We then created risk models based on local data for each country to predict mortality after each procedure. We found that although the exchanged models had adequate discrimination for mortality after each procedure, the models failed to yield adequate calibration between countries. This finding clearly indicated that risk models based on local data remain essential for quality assessment and improvement.
More than 2000 hospitals performing gastrointestinal (GI) tract surgery joined NCD, and 95% of surgical cases (949,824 cases in 2011 and 2012) were collected in this database, making NCD a nationally representative sample.15 Meanwhile, data submitted to ACS-NSQIP from participating hospitals include a considerable proportion of cases (442,149 cases from 315 sites in 2011) sufficient to provide benchmark support to individual hospitals. We identified a number of differences in risk factor prevalence between datasets. Mortality rates reported in this study differed slightly, with lower unadjusted mortality rates for all 3 procedures in Japan than in US. The duration of hospital stay also differed, being longer in Japan compared to the US for all 3 procedures. The Japanese patients were older and had a higher prevalence of CKD. In contrast, US patients were younger and substantially more obese.
The NCD and ACS-NSQIP data have been used in prediction tools to facilitate risk stratification before surgery in a procedure-targeted manner.16–24 More specifically, the ACS-NSQIP risk calculator works by utilizing information regarding the patient's risk factors related to the planned surgical procedure. The calculator then provides a predicted risk of complications after surgery.25 However, the ability of risk models created using nationwide databases to predict the surgical risk for patients undergoing the same procedure in other countries has yet to be evaluated. In this study, we used the NCD and NSQIP databases to develop independent 30-day mortality risk models, and identified significant variables from both datasets to create NCD/ACS-NSQIP risk models using a common set of variables. For the purpose of estimating risk, the 2 models based on the 2 country's own dataset were able to adequately predict mortality with a good c-index and similar ORs observed for each variable (Table 4 ).
We found that discrimination decreased when we ran each risk model using the other country's data. When we focused on a measure of calibration (the Hosmer–Lemeshow plot), we found that both NCD and ACS-NSQIP models accurately predicted the number of deaths in their respective datasets. However, calibration diminished when data from the other country were used. These results indicate that risk models based on local data accurately predict mortality rate; however, risk models based on data from other countries are unable to accurately predict mortality rate. When evaluating the performance of a prediction model in adherence to the transparent reporting of a multivariable prediction model for individual prognosis or diagnosis guideline,26 investigators should pay attention to the discrepancy, involving the use of participant data collected by another country for external validation.
We considered reasons for this discrepancy. Differences in the prevalence of risk factors are unlikely to have a significant impact on model performance since we conducted a risk-adjusted analysis. However, there may be several risk factors not included in our model. These are likely to be ethnicity; operative information (operation time, amount of bleeding, and transfusion amount); and incidence and management of postoperative complications. Cytokine response has been shown to differ between races27,28; it is reasonably assumed that this difference may lead to different outcomes. Because the incidence of severe morbidity affects mortality, successful prophylactic management as a team may reduce the incidence of morbidity and decrease mortality rates.10,29 Relatively longer hospital stays after surgery due to the insurance system in Japan30 may protect patients with high morbidity after surgery, but this assumption needs to be fully assessed in future comparative studies.
This study should be interpreted with the appreciation of several limitations. We were unable to combine data from the 2 datasets due to the prohibition by NCD for security reasons. The backgrounds of the databases may be different. Although the NCD/Japan contains nearly 95% of surgical cases from all hospitals in Japan, ACS-NSQIP contains samples from selected hospitals in US only. This may be a source of bias if there was a difference in surgical practice or hospital procedural volume. Other differences in patient factors, including social, economic, and racial differences, have not been considered. Secondly, 30-day mortality was the only outcome studied. The 30-day mortality likely underestimates treatment-associated mortality by not including mortality occurring 30 days after operations. Thirdly, the impact of perioperative and postoperative complications that potentially affects surgical mortality are unknown due to a lack of data regarding these variables.
In conclusion, we found significantly different mortality rates, comorbidity prevalences, and procedural practices between Japan and the US. Risk-prediction models that can be reasonably used for both patient groups should be developed while recognizing that some risk predictors may be population-specific. This study demonstrates the feasibility and utility of international collaborative research between Japan and the US, but risk models based on local data remain essential for quality assessment and improvement.
Acknowledgments
We wish to thank all of the data managers and hospitals that participated in the NCD project and the ACS-NSQIP for their great efforts in data entry. In addition, we wish to express appreciation to all the people and academies that cooperated in this project.
Footnotes
Abbreviations: ACS-NSQIP = American College of Surgeons National Surgical Quality Improvement Program, ASA = American Society of Anesthesiologists, AST = Aspartate aminotransferase, BMI = body mass index, CKD = chronic kidney disease, COPD = chronic obstructive pulmonary disease, LAR = low anterior resection, NCD = National Clinical Database, PD = pancreaticoduodenectomy, PT-INR = prothrombin time–international normalized ratio, RH = right hemicolectomy, SIRS = systemic inflammatory response syndrome, US = United States.
Funding: This study is partially supported from the Ministry of Health, Labour and Welfare, Japan.
Conflict of interest disclosures: The authors report no conflicting financial interests.
REFERENCES
- 1.Hall BL, Hamilton BH, Richards K, et al. Does surgical quality improve in the American College of Surgeons National Surgical Quality Improvement Program: an evaluation of all participating hospitals. Ann Surg 2009; 250:363–376. [DOI] [PubMed] [Google Scholar]
- 2.Miyata H, Gotoh M, Hashimoto H, et al. Challenges and prospects of a clinical database linked to the board certification system. Surg Today 2014; 44:1991–1999. [DOI] [PubMed] [Google Scholar]
- 3.Anazawa T, Miyata H, Gotoh M. Cancer registries in Japan: National Clinical Database and site-specific cancer registries. Int J Clin Oncol 2015; 20:5–10. [DOI] [PubMed] [Google Scholar]
- 4.Cohen ME, Ko CY, Bilimoria KY, et al. Optimizing ACS NSQIP modeling for evaluation of surgical quality and risk: patient risk adjustment, procedure mix adjustment, shrinkage adjustment, and surgical focus. J Am Coll Surg 2013; 217:336–346. [DOI] [PubMed] [Google Scholar]
- 5.Khuri SF, Henderson WG, Daley J, et al. Successful implementation of the Department of Veterans Affairs’ National Surgical Quality Improvement Program in the private sector: the Patient Safety in Surgery study. Ann Surg 2008; 248:329–336. [DOI] [PubMed] [Google Scholar]
- 6.User Guide for the 2013 Participant Use Data File, 2014. Available at: http://site.acsnsqip.org/participant-use-data-file/ Accessed January 1, 2015. [Google Scholar]
- 7.Dimick JB, Osborne NH, Hall BL, et al. Risk adjustment for comparing hospital quality with surgery: how many variables are needed? J Am Coll Surg 2010; 210:503–508. [DOI] [PMC free article] [PubMed] [Google Scholar]
- 8.Anderson RP, Jin R, Grunkemeier GL. Understanding logistic regression analysis in clinical reports: an introduction. Ann Thorac Surg 2003; 75:753–757. [DOI] [PubMed] [Google Scholar]
- 9.Kramer AA, Zimmerman JE. Assessing the calibration of mortality benchmarks in critical care: The Hosmer-Lemeshow test revisited. Crit Care Med 2007; 35:2052–2056. [DOI] [PubMed] [Google Scholar]
- 10.Pearse RM, Moreno RP, Bauer P, et al. Mortality after surgery in Europe: a 7 day cohort study. Lancet 2012; 380:1059–1065. [DOI] [PMC free article] [PubMed] [Google Scholar]
- 11.Munasinghe A, Markar SR, Mamidanna R, et al. Is it time to centralize high-risk cancer care in the United States? Comparison of outcomes of esophagectomy between England and the United States. Ann Surg 2015; 262:79–85. [DOI] [PubMed] [Google Scholar]
- 12.Osborne NH, Nicholas LH, Ryan AM, et al. Association of hospital participation in a quality reporting program with surgical outcomes and expenditures for Medicare beneficiaries. JAMA 2015; 313:496–504. [DOI] [PMC free article] [PubMed] [Google Scholar]
- 13.Etzioni DA, Wasif N, Dueck AC, et al. Association of hospital participation in a surgical outcomes monitoring program with inpatient complications and mortality. JAMA 2015; 313:505–511. [DOI] [PubMed] [Google Scholar]
- 14.Lawson EH, Wang X, Cohen ME, et al. Morbidity and mortality after colorectal procedures: comparison of data from the American College of Surgeons case log system and the ACS NSQIP. J Am Coll Surg 2011; 212:1077–1085. [DOI] [PubMed] [Google Scholar]
- 15.Konno H, Wakabayashi G, Udagawa H, et al. Annual Report of National Clinical Database in Gastroenterological Surgery 2011–2012. Jpn J Gastroenterol Surg 2013; 46:952–963. [Google Scholar]
- 16.Kenjo A, Miyata H, Gotoh M, et al. Risk stratification of 7,732 hepatectomy cases in 2011 from the National Clinical Database for Japan. J Am Coll Surg 2014; 218:412–422. [DOI] [PubMed] [Google Scholar]
- 17.Kimura W, Miyata H, Gotoh M, et al. A pancreaticoduodenectomy risk model derived from 8575 cases from a national single-race population (Japanese) using a web-based data entry system: the 30-day and in-hospital mortality rates for pancreaticoduodenectomy. Ann Surg 2014; 259:773–780. [DOI] [PubMed] [Google Scholar]
- 18.Kobayashi H, Miyata H, Gotoh M, et al. Risk model for right hemicolectomy based on 19,070 Japanese patients in the National Clinical Database. J Gastroenterol 2014; 49:1047–1055. [DOI] [PubMed] [Google Scholar]
- 19.Matsubara N, Miyata H, Gotoh M, et al. Mortality after common rectal surgery in Japan: a study on low anterior resection from a newly established nationwide large-scale clinical database. Dis Colon Rectum 2014; 57:1075–1081. [DOI] [PubMed] [Google Scholar]
- 20.Nakagoe T, Miyata H, Gotoh M, et al. Surgical risk model for acute diffuse peritonitis based on a Japanese nationwide database: an initial report of 30-day and operative mortality. Surg Today 2014; In press. [DOI] [PubMed] [Google Scholar]
- 21.Takeuchi H, Miyata H, Gotoh M, et al. A risk model for esophagectomy using data of 5354 patients included in a Japanese nationwide web-based database. Ann Surg 2014; 260:259–266. [DOI] [PubMed] [Google Scholar]
- 22.Watanabe M, Miyata H, Gotoh M, et al. Total gastrectomy risk model: data from 20,011 Japanese patients in a nationwide internet-based database. Ann Surg 2014; 260:1034–1039. [DOI] [PubMed] [Google Scholar]
- 23.Cohen ME, Bilimoria KY, Ko CY, et al. Development of an American College of Surgeons National Surgery Quality Improvement Program: morbidity and mortality risk calculator for colorectal surgery. J Am Coll Surg 2009; 208:1009–1016. [DOI] [PubMed] [Google Scholar]
- 24.Greenblatt DY, Kelly KJ, Rajamanickam V, et al. Preoperative factors predict perioperative morbidity and mortality after pancreaticoduodenectomy. Ann Surg Oncol 2011; 18:2126–2135. [DOI] [PubMed] [Google Scholar]
- 25.Bilimoria KY, Liu Y, Paruch JL, et al. Development and evaluation of the universal ACS NSQIP surgical risk calculator: a decision aid and informed consent tool for patients and surgeons. J Am Coll Surg 2013; 217:833–842. [DOI] [PMC free article] [PubMed] [Google Scholar]
- 26.Collins GS, Reitsma JB, Altman DG, et al. Transparent reporting of a multivariable prediction model for Individual Prognosis Or Diagnosis (TRIPOD): the TRIPOD Statement. Br J Surg 2015; 102:148–158. [DOI] [PubMed] [Google Scholar]
- 27.Hassan MI, Aschner Y, Manning CH, et al. Racial differences in selected cytokine allelic and genotypic frequencies among healthy, pregnant women in North Carolina. Cytokine 2003; 21:10–16. [DOI] [PubMed] [Google Scholar]
- 28.Ness RB, Haggerty CL, Harger G, et al. Differential distribution of allelic variants in cytokine genes among African Americans and White Americans. Am J Epidemiol 2004; 160:1033–1038. [DOI] [PubMed] [Google Scholar]
- 29.Haynes AB, Weiser TG, Berry WR, et al. A surgical safety checklist to reduce morbidity and mortality in a global population. N Engl J Med 2009; 360:491–499. [DOI] [PubMed] [Google Scholar]
- 30.Ikegami N, Yoo BK, Hashimoto H, et al. Japanese universal health coverage: evolution, achievements, and challenges. Lancet 2011; 378:1106–1115. [DOI] [PubMed] [Google Scholar]


