Abstract
Using spectral-domain optical coherence tomography (OCT) to observe the morphology and epithelial thickness (ET) of the palisades of Vogt (POV), and to evaluate the role of age and region on these structures.
One hundred twelve eyes of 112 healthy subjects were enrolled and divided into 4 groups: A (0–19), B (20–39), C (40–59), and D (≥60 years old). RTvue-100 OCT was applied on the cornea and the limbus. The morphology of the subepithelial stroma underneath the epithelium of POV was classified into typical and atypical types. Maximum ET of POV was measured manually from OCT images.
The positive rate of typical POV in superior, nasal, temporal, and inferior limbus was: Group A: 100%, 69.2%, 65.4%, 100%; Group B: 100%, 73.5%, 61.8%, 94.1%; Group C: 95.8%, 41.7%, 37.5%, 83.3%; Group D: 67.9%, 0%, 3.6%, 25%, showing a significant decreasing tendency with age. The maximum ET of POV in superior, nasal, temporal, and inferior limbus was: Group A: 103.5 ± 10.1 um, 89.2 ± 9.7 um, 87.9 ± 13.6 um, 104.7 ± 14.1 um; Group B: 111.4 ± 15.8 um, 85.3 ± 9.9 um, 88.2 ± 8.6 um, 112.6 ± 19.7 um; Group C: 116.4 ± 16.4 um, 82.8 ± 11.6 um, 87.0 ± 11.6 um, 120.0 ± 25.6 um; Group D: 96.3 ± 17.9 um, 73.8 ± 15.9 um, 79.2 ± 16.7 um, 87.4 ± 18.5 um. Age-dependent change was observed. In general, the maximum ET of POV in superior/inferior quadrants was thicker than the other 2 quadrants.
Spectral-domain OCT is a useful tool to observe the limbal microstructure and provide invaluable information. Aging and anatomic regions had significant effects on the microstructure of these areas.
Keywords: age, anterior segment OCT, limbus, palisades of vogt
1. Introduction
The limbus located between the cornea and the conjunctiva tissue, approximately 1.5 mm wide in adult human eyes, is important for not only providing a barrier frontier to prevent conjunctival tissue invasion into the cornea, containing nerves passing to the cornea, having blood and lymph vasculature for oxygen and nutrient delivery, but also the niche environment of limbal stem cells.[1] The human limbus contains radially oriented fibrovascular rides named palisades of Vogt (POV), a unique tissue first noted in 1866 and was further described in detail in 1921.[2] The POV has unique structure, configuration, and dimension which was commonly found in all types of epithelial stem cell niche all over the body, which include the complicated niche area providing a safe place to protect the stem cells from damage or injury. During the past few years, progress in stem cell research and cell therapy has focused attention on the POV as the location of the stem cells that keep the corneal epithelial homeostasis and clarity.[3–7] The POV also provide the niche environment for limbal stem cells. The niche cells surrounding the limbal stem cells, the stromal environment underneath the limbal epithelial cells, the blood vessels and nerve innervation around the limbal epithelium all help create the unique niche environment for limbal stem cells.[8] Understanding the limbal structure, especially the POV, is necessary for the treatment of limbal damage and the development of stem cell therapies targeted at restoring impaired function of limbal stem cells.[9]
So far, in vivo image systems are not able to visualize or identify the limbal stem cells directly. One alternative practical is to visualize the histological morphology of POV, and to speculate the possible status of the stem cells accordingly. However, the microstructure of POV is not well defined or understood in spite of awareness of its importance. Slit-lamp biomicroscopy can be used routinely for clinical examination of the limbal morphology. However, this technology does not allow for high-resolution imaging of structural details and only up to 20% of patients can be identified.[2,3,10,11] In vivo confocal microscopy has been used to visualize the POV and can provide cellular level resolution images, but the technique is limited by high magnification that restricts the area of the scan.[7,9–11] In addition, in vivo confocal microscopy requires direct contact with the eye.[10–15] Although the quality of these images is impressive, the disadvantages existed included the direct contact during examination, the small field of view (∼200 μm × 200 μm), and the limited axial resolution.[16] Besides, both slit lamp biomicroscopy and in vivo confocal microscopy have the limitation of not being able to give an overall view of the dimension and structure of the whole palisades region.
Optical coherence tomography (OCT) is an imaging modality that allows for noninvasive imaging of the morphology of biological tissue with micrometer scale resolution at imaging depths of 1 to 2 mm below the tissue surface.[17,18] During these few years, OCT has become a useful clinical and research tool for imaging of the ocular surface.[17,19,20] In addition to the mostly used application for observing the optic disc and retinal choroidal structure,[21–25] the usage in the anterior segment, especially cornea, was also widely developed. An anterior segment OCT (Visante; Carl Zeiss Meditec, Dublin, CA), a time-domain OCT, is a commercial available OCT designed especially for anterior segment. This OCT instrument has been used widely in LASIK, different lamellar keratoplasties, keratoconus screening, and evaluation of corneal diseases[26–32] in different layers. However, its limited resolution does not allow for the observation of the epithelial layer on the ocular surface. Spectral-domain OCT with a corneal module can provide much better resolution than time-domain OCT for the observation of epithelial layer on ocular surface. It has been used recently to evaluate the corneal epithelial layer with reliable results.[20,33–35] In this study, we used a spectral-domain OCT with a corneal-anterior module long lens adapter with low magnification, to observe the limbal structure (POV). We focused on the effects of aging on the POV, and observed the differences in the POV at different limbal locations. The maximum epithelial thickness (ET) and morphology of the POV in subepithelial structure were analyzed.
2. Methods
2.1. Subjects
This prospective study, involving 112 left eyes of 112 healthy subjects (47 men and 65 women; age rage, 7–87 years), was conducted in the Department of Ophthalmology, National Taiwan University Hospital. This study was conducted in accordance with the Declaration of Helsinki and approved by institutional review board of National Taiwan University Hospital. Written informed consent was obtained from the subjects after explanation of the study. All patients, recruited from August 2014 to February 2015, underwent a complete ophthalmologic examination, including visual acuity, slit-lamp examination, intraocular pressure measurement, and refraction before examination. The exclusion criteria included the history of contact lens wear, glaucoma, dry eye, active ocular pathology, current or long-term topical medication, systemic diseases that may affect the cornea and any history of ophthalmic injury or surgery. The healthy subjects were divided into 4 groups according to age. Group A: 0 to 19 years old; Group B: 20 to 39 years old; Group C: 40 to 59 years old; Group D: ≥60 years old. Characteristics of the enrolled subjects are summarized in Table 1.
Table 1.
Characteristics of the volunteers in the 4 different age groups.

2.2. Optical coherence tomography for the observation of POV
A spectral domain OCT system (RTVue-100; Optovue Inc, Fremont, CA) with a corneal anterior module long adaptor lens (1.96-mm scan depth and 6-mm scan width) was used in this study. The system worked at 830-nm wavelength and had a scan speed of 26,000 axial scans per second. The depth resolution was 5 μm (full-width half-maximum) in tissue. The wide-angle (corneal long) adaptor lens used in this study provided a 6 mm long scan width with a transverse resolution of 15 μm (focused spot size). Four different locations of limbus were examined using the cross-line scan mode, including the superior, nasal, inferior, and temporal regions. The subjects were asked to fixate at a peripheral target and keep looking extremely to the 4 different directions to maintain the perpendicularity of the OCT beam at the surface of the targeted tissue, which was essential to obtain the accurate pattern and the maximum ET of the POV.
2.3. Pattern of the POV
In this study, the patterns of POV evaluated by OCT were classified into typical and atypical types. Typical type was defined as having the easily identified sharp tapering tip of subepithelial stroma pointing to the corneal-limbal junction with the maximum ET of POV at least ×1.5 thicker than the central corneal epithelial thickness (CET). Those eyes without the typical pattern of POV were classified as atypical pattern.
2.4. Maximum ET of POV
Since POV is a convoluted structure without uniform epithelial thickness at different locations, we measured the maximum ET at POV. The measurement of the maximum ET of POV was based on a manual segmentation method reported by Francoz et al[36] and Yang et al[37] with some modification. At each limbal area, those images with high quality which can clearly show the interface of air-tear and epithelium-stroma were selected for further analysis. The maximum ET was selected manually as the distance between the air-tear interface and epithelial-stroma interface. The ET was determined as the average of 3 independent measurements, and the examiner was unaware of the subject's age. To avoid the interobserver variability, all the examinations were performed by 1 single examiner (H-CL). To demonstrate the reproducibility of the measured results, all eyes were measured twice at each region on 2 different days. The Bland and Altman method was used to determine the coefficients of repeatability as twice the standard deviation of the differences between 2 measurements.
2.5. Measurement of corneal ET
The OCT system automatically generated a total CET map for each pachymetry scan from built-in software, version A6 .9.0.27 (Optovue Inc). Data collected included the mean values in following 17 sectors: 1 central zone within 0- to 2-mm diameter, 8 paracentral zones from 2- to 5-mm diameter, and 8 peripheral zones from 5- to 6-mm diameter.
2.6. Statistical analysis
Statistical analyses were performed with statistical software (SPSS for Windows, version 19.0; SPSS Inc, Chicago, IL). The proportions of typical presentation of POV were compared by χ2 tests among different locations. As for the maximum ET of POV, it was evaluated by Spearman correlation analysis for its correlation among different age groups, and was tested by one-way ANOVA with post hoc Tukey test for its variation among different locations. The correlation between both eyes was determined by Pearson correlation. Paired t test was used to compare the epithelial thickness between each quadrant. Two-tailed P value of <0.05 was considered significant.
3. Results
Table 1 represents the characteristics of the volunteers in the 4 age groups, with 26, 34, 24, and 28 eyes in groups A, B, C, and D. The gender distribution was similar among each group (χ2 test, P = 0.601).
3.1. Typical pattern of POV shown by OCT
Figure 1 shows the typical healthy POV found in most young adults in this study. Most of the detailed structure of limbus (Fig. 1A, modified from [38,39]) can be shown by OCT (Fig. 1B), which included the corneal epithelium layer (CnE), the epithelium of POV, the conjunctival epithelium (CjE), the corneal stroma (CnS), the limbal stroma (LS), the conjunctival stroma (CjS), the episclera (ES), and the limbal vessels (Ves). Figure 1C shows the typical pattern of subepithelial stroma of POV measured by OCT. The easily identified sharp tapering tip of subepithelial stroma pointing to the corneal–limbal junction with the maximum ET of POV at least ×1.5 thicker than the central CET can be clearly defined.
Figure 1.
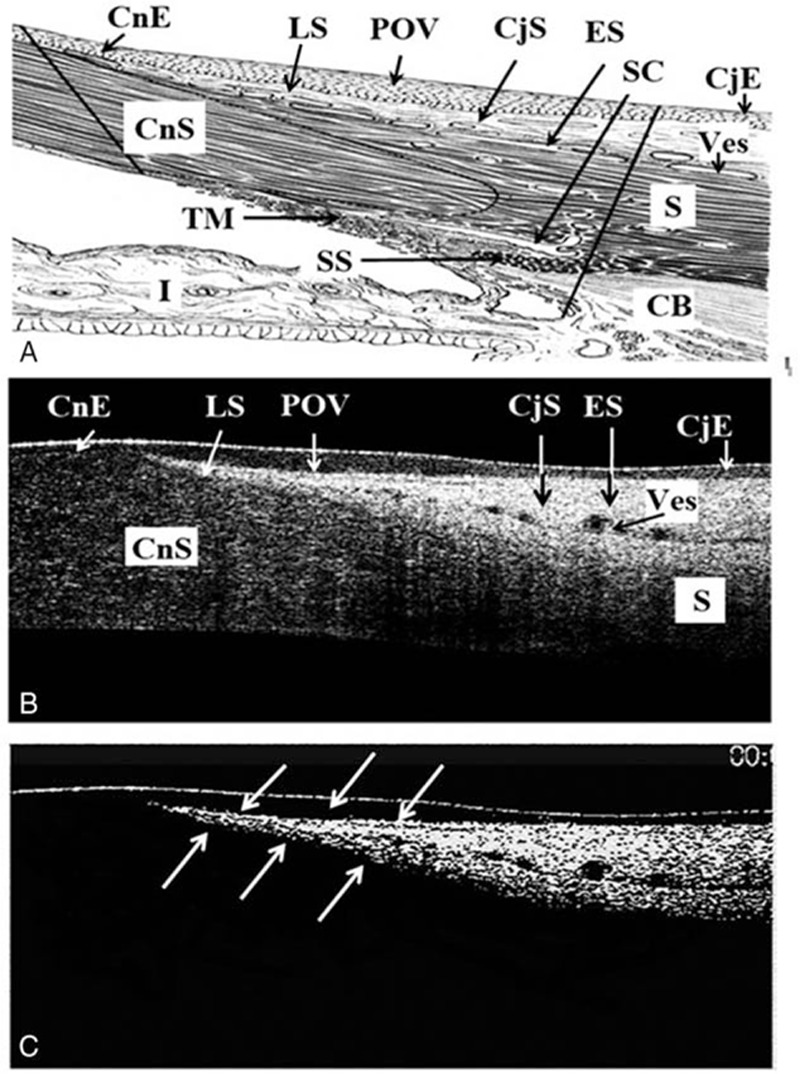
The typical healthy POV found in most young adults in this study. A, The detained anatomic structure of the cornea-sclera junction (modified from [38,39]). B, Typical pattern of POV was defined as having the easily identified sharp tapering tip of subepithelial stroma pointing to the corneal-limbal junction with the maximum ET of POV at least ×1.5 thicker than the central CET. C, To highlight the subepithelial stroma at POV, contrast was increased at Adobe Photoshop CS6 (Adobe System Inc) on the OCT images. The white arrows indicate the sharp tapering tip of subepithelial stroma pointing to the corneal-limbal junction as in (B). CjE = the conjunctival epithelium, CjS = the conjunctival stroma, CnE = corneal epithelium layer, CnS = the corneal stroma, ES = the episclera, LS = the limbal stroma, POV = the epithelium of POV, Ves = the limbal vessels.
3.2. The presentation of typical patterns of POV
The higher incidence of typical pattern of POV can be found in superior/inferior regions than in nasal/temporal locations in all age groups, with the incidence of more than 80% in the superior and inferior locations in age groups A, B, and C (Fig. 2A). The typical pattern of POV in the nasal/temporal locations was found to be less than 70% in group A, and decreased age-dependently. In group D, almost all eyes lost the typical pattern of POV in nasal/temporal locations (Fig. 2A). There is a trend of decreasing incidence of typical POV with age in all 4 quadrants (Fig. 2B).
Figure 2.
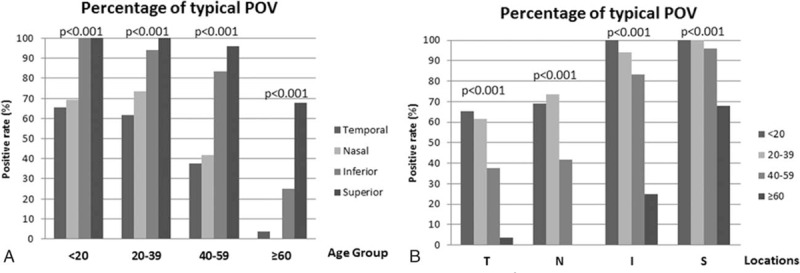
The positive rate (%) of typical POV among different (A) age groups and (B) locations (χ2 test, significance level at P <0.05). I = inferior, N = nasal, S = superior, T = temporal.
Figure 3A shows the typical POV and Fig. 3B to D demonstrates the various types of atypical POV found in this study. In Fig. 3B, there were no differences of the maximum ET of POV with the peripheral corneal epithelium. In addition, the typical pattern of subepithelial stroma also disappeared. In Fig. 3C, the epithelium of POV becomes wavy in appearance. There is no typical pattern of subepithelial stroma. In Fig. 3D, a nodule-like structure, which implies pinguecula formation, existed at the limbal area. The maximum ET of POV (occupied by pinguecula) is even thinner than corneal epithelium. In addition, the typical pattern of sublimbal stroma disappeared.
Figure 3.
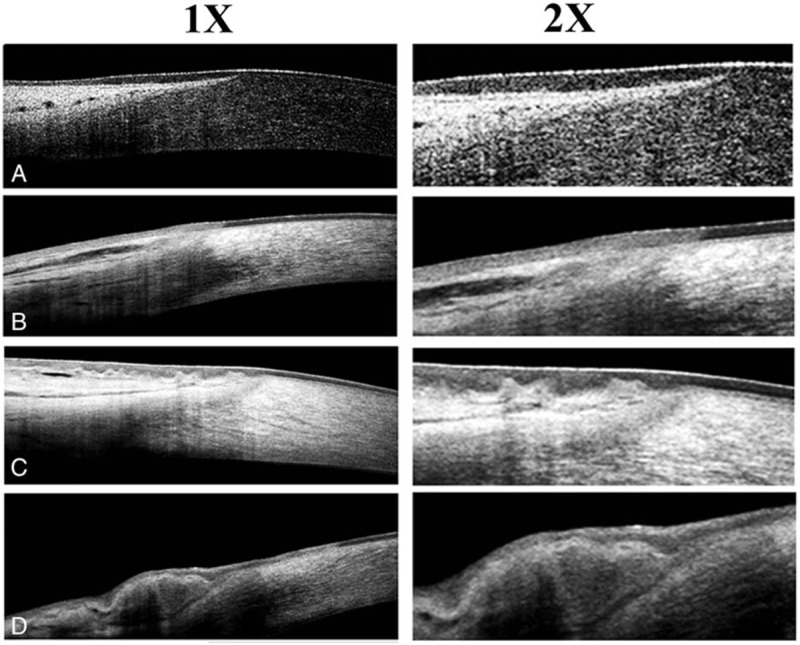
The representative images of typical (A) and atypical (B–D) patterns of POV. 1× = original images obtained from OCT, which showed the almost full thickness of the corneo-scleral junctions. 2× = 2× enlargement of the original images, which clearly demonstrated the epithelial morphology of POV.
3.3. Case presentations
Figures 4 and 5 are 2 representative cases from group B (30 years of age) and group D (82 years of age). In Fig. 4, the ET of superior and inferior POV is thicker than the nasal and temporal POV in both eyes. The typical sharp triangular shape of subepithelial stroma is found only in superior and inferior quadrates instead of nasal and temporal quadrants. In Fig. 5, typical pattern of POV was only found in the superior quadrant of the right eye. The thin ET of POV and the atypical stromal pattern of POV in other quadrants indicated the normal aging process.
Figure 4.
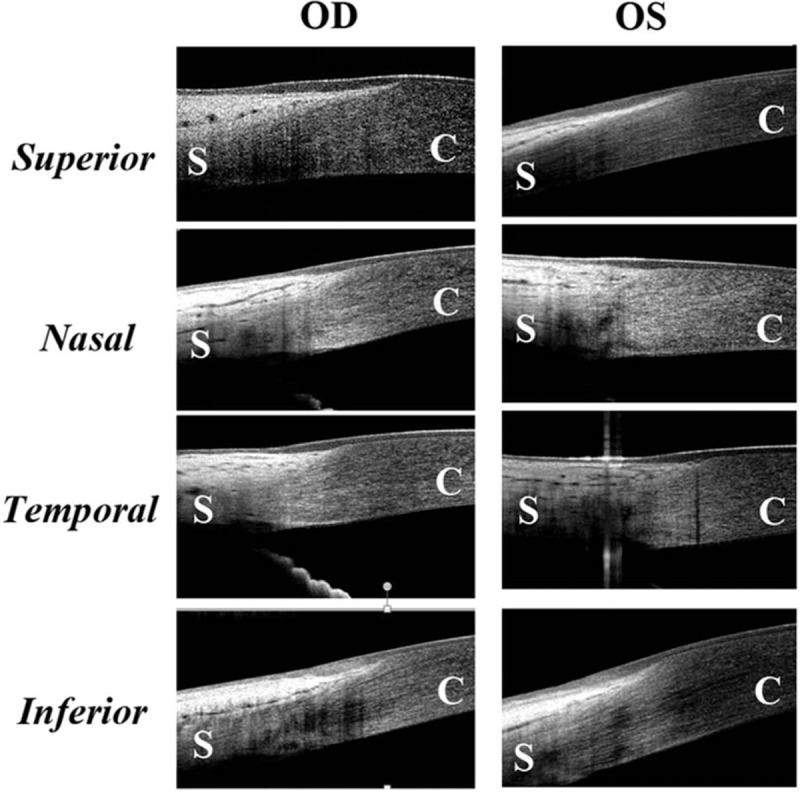
The representative images demonstrating the epithelium and pattern of POV at different locations in a healthy adult aged 30 years old. The maximum ET of superior and inferior POV is thicker than the nasal and temporal POV in both eyes. The typical sharp triangular shape of subepithelial stroma is found only in superior and inferior quadrates instead of nasal and temporal quadrants. C = cornea, S = sclera.
Figure 5.
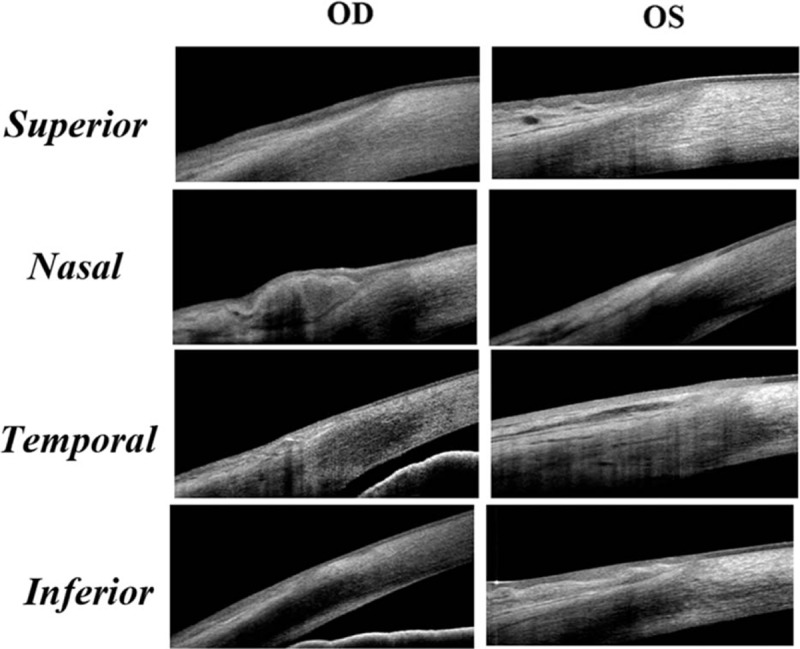
The representative images demonstrating the epithelium and pattern of POV at different locations in a healthy adult aged 82 years old. The typical pattern of POV was only found in the superior quadrant of the right eye. The epithelium was wavy in the superior quadrant in the left eye. There were pingueculae at the nasal limbus in both eyes, which made the maximum ET of POV even thinner than the peripheral cornea. In the temporal and inferior quadrants of both eyes, the POV lost the typical subepithelial stroma pattern.
3.4. Maximum ET of POV
The correlation between both eyes in the 4 measured quadrants demonstrated the high correlations between both eyes (r = 0.875, Pearson correlation). To demonstrate the reproducibility of the measured results, the maximum ET of POV in all eyes were measured twice at each quadrant of limbus. The difference between 2 measurements was −0.83 ± 5.67 μm (mean ± SD). The coefficient of repeatability measured by the Bland and Altman method was 11.34 μm. The maximum ET of POV at different locations in different age groups is shown in Table 2. In the superior and inferior quadrants, there is a tendency that the maximum ET increased from group A to group B, remained statistically indistinguishable from group B to group C, and decreased significantly from group C to group D. However, an age-related decrease of maximum ET of POV was found in nasal and temporal quadrants. In all age groups, the thickness of superior and inferior quadrants is significantly higher compared with the nasal and temporal quadrants. However, there was no significant differences between superior and inferior quadrants in age groups A, B, and C (P > 0.05, paired t test).
Table 2.
The maximum epithelial thickness (ET) of palisades of Vogt (POV) (μm) among different age groups and locations, and the correlation with age.

3.5. Measurement of corneal epithelial thickness (CET)
Figure 6 shows CET distribution of the 4 age groups. ANOVA test indicated that there was no significant difference of CET with aging in the majority of the central 5-mm cornea. However, the CETs in the upper areas are thinner than the corresponding lower areas in all age groups. Correlation analysis further demonstrated that CET was negatively correlated with age except for the central 2-mm sector and the inferior sectors in the paracentral area (Fig. 7).
Figure 6.
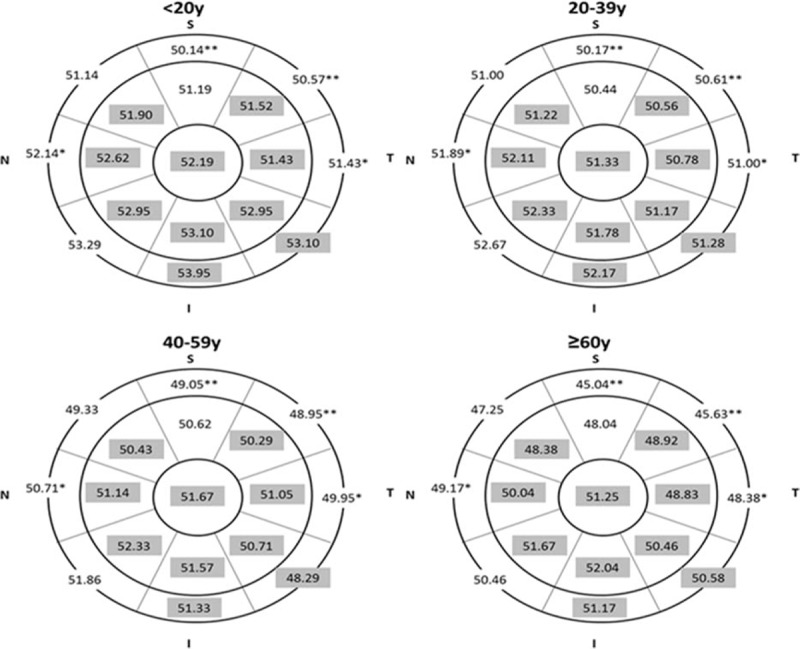
Distribution of corneal epithelial thickness (CET) (μm) in each age group. Gray sectors indicate no significant difference between each age group, and the white region indicates significant difference among each age group. (One-way ANOVA test, P <0.05; ∗P <0.01; ∗∗P <0.001).
Figure 7.
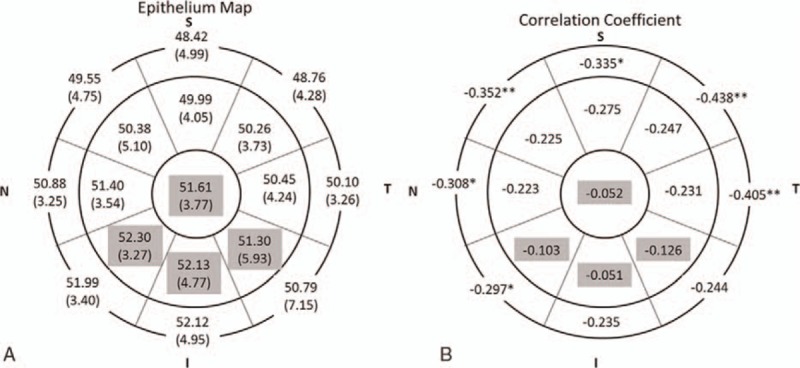
Distribution of corneal epithelial thickness (CET) (μm) and correlation with age. A, Mean (SD) CET in 17 sectors. B, Correlation coefficient in 17 sectors. Gray region indicates no significant correlation with age and the white region indicates negative linear correlation (Spearman test, P <0.05; ∗P <0.01; ∗∗P <0.001).
4. Discussion
Residing in a 1- to 2-mm band of the connective tissue on the corneoscleral limbus, the POV has a structure as unique as fingerprints.[1,3–7,9] In that particular area, the epithelium projects downward between the subepithelial papillaes, which appears as a radially oriented infold crossing the limbal corneal junctions. The size, shape, and configuration of POV changes over time and was reported to be response to acquired or congenital conditions, aging, surgery, and medication.[2,4,5,7,10,40–49] Injury to the POV and the limbal stem cells they contain may cause to corneal conjunctivalization, vascular invasion, corneal epithelialization problem, corneal melting, and concomitant blindness.
Although OCT has the advantage of rapidness, noninvasiveness, high repeatability, and high resolution, the literature regarding the use of OCT technology to assess limbal tissue is currently limited.[16,20,36–38,50–53] The reported usage of OCT include the visualization of ET on normal limbus, the reconstruction of 3D images, the observational changes of limbal tissue after contact lens wear, and imaging the human limbal rims in donor eyes. Recently, Yang et al[37] used spectral domain OCT to observe the age-related changes in ET in different quadrants of the human cornea and limbus. However, to the best of our knowledge, only limited studies using OCT imaging techniques have focused on the age-related changes of the POV morphological structure in different quadrants.[37]
The limbal region is a harbor for limbal stem cells during fetal development.[54] The human fetal epithelium develops through 3 different stages: minimal cell proliferation in the beginning, followed by a high proliferative activity in all parts of the epithelium, and proliferation restricted to the basal layer, especially in the limbal basal layer. Several studies have measured the postnatal changes, and shown that the POV in the human limbus declined with age.[2,11] Most of those studies only measured 1 or 2 regions of the limbus.
The regional variation of limbal tissue has long been recognized.[3,9,20] Superior and inferior regions are well known to have more prominent POV. However, there are limited studies using OCT to visualize the regional variations of the POV, especially focusing on the ET and the morphology of subepithelial stroma. Feng and Simpson[50] used time-domain OCT with the resolution of 10 to 20 μm to measure nasal and temporal limbus. They found no differences of ET in nasal and temporal limbus, no differences between both eyes, which were similar to our results. Our study results demonstrated that superior and inferior quadrants have more prominent POV than the nasal and temporal quadrants in all age groups, with the manifestation of thicker maximum ET of the POV and higher rate presenting the typical POV. Interestingly, we found that in superior and inferior quadrants, the maximum ET increased from group A (age 0 to 19) to group B (age 20–39), remaining stable from group B to group C (age 40–59), and decreased significantly from group C to group D (age ≥60). While in nasal and temporal quadrants, the thickness decreased constantly with age (Table 2). To the best of our knowledge, such a discrepancy of age-related stromal changes underneath the epithelium of POV among different limbal regions has never been reported before. Recently, Yang et al[37] used spectral-domain OCT and claimed that the limbal ET exhibited significant age-related decrease in the nasal and temporal quadrants while remaining constant in the superior and inferior quadrants. However, the raw data in that study pointed out the similar pattern as our study that the maximum ET of the POV increased from group A to group B, remained stable from group B to group C, and decreased from group C to group D in the superior and inferior quadrants. Although difficult to prove, several mechanisms contribute to these findings. The balance of age-related tissue growth, the different amount of accumulated damage from eyelid blinking and sunlight exposure in different regions, the age-related decrease of melanocytes (which may be more severe in nasal and temporal regions than the superior and inferior quadrants) help to explain our result.
Although our study provided some novel findings, there were some limitations. First of all, the POV is not a uniform tissue, which may make the measurement result inconsistent at times. The intraobserver, interobserver and intersessional repeatability may have influenced the study result. However, Huang et al[55] demonstrated that spectral-domain OCT offered high repeatability and reproducible measurements of central and mid-peripheral CET, which provide a solid support using this strategy to measure ocular surface epithelial thickness. Yang et al[37] also demonstrated the high reproducibility of using spectral-domain OCT to measure the ET of the POV in different locations. Our study using the same type of OCT obtained reliable results with the maximum ET of POV similar to that found in other studies using different measurement strategy. We also found a high interobserver reliability and high correlationship between both eyes. This may indirectly suggest that our study results are quite reliable. Second, the maximum ET of the POV and the presence of typical POV pattern may not reflect the density or health of the limbal stem cells. Functional or morphological studies with higher resolution and repeatability are needed to clarify the status of the limbal stem cells. Third, although all the patients in our study were not outdoor workers, and did not have a history of strong UV exposure, the different accumulative doses of UV exposure among the patients may still have affected the results, especially in older patients. Fourth, given the fact that the OCT system was unable to discriminate the precorneal tear film, the effects of tear film thickness from different subjects cannot be overlooked. However, since the thickness of the tear film was reported to be 4.79 ± 0.88 μm,[56] which is negligible compared with the maximum ET of POV measured in our study, the influence of tear film thickness on our measurement should have been insignificant.
In conclusion, this study used spectral-domain OCT to measure limbal condition and focused on age- and region- related changes. We found that spectral-domain OCT is a useful tool to evaluate the POV. The age of the subjects and region of the eye have significant effects on the microstructure of these areas.
Footnotes
Abbreviations: CET = corneal epithelial thickness, CjE = conjunctival epithelium, CjS = conjunctival stroma, CnE = corneal epithelium, CnS = corneal stroma, ES = episclera, ET = epithelial thickness, LS = limbal stroma, OCT = optical coherence tomography, POV = palisades of Vogt.
The authors have no commercial proprietary interest in the products or companies mentioned in the article.
This work is supported, in part, by the National Taiwan University Hospital Plan Asia One, Department of Medical Research at the NTUH, Jointed Research Grant between National Taiwan University Hospital and Min-Sheng General Hospital 100001, and Grant NSC 103-2314-B-002-074-MY3 from the Ministry of Science and Technology, Taiwan.
The authors have no conflicts of interest to disclose.
References
- 1.Van Buskirk EM. The anatomy of the limbus. Eye (Lond) 1989; 3 (Pt 2):101–108. [DOI] [PubMed] [Google Scholar]
- 2.Townsend WM. The limbal palisades of Vogt. Trans Am Ophthalmol Soc 1991; 89:721–756. [PMC free article] [PubMed] [Google Scholar]
- 3.Goldberg MF, Bron AJ. Limbal palisades of Vogt. Trans Am Ophthalmol Soc 1982; 80:155–171. [PMC free article] [PubMed] [Google Scholar]
- 4.Echevarria TJ, Di Girolamo N. Tissue-regenerating, vision-restoring corneal epithelial stem cells. Stem Cell Rev 2011; 7:256–268. [DOI] [PubMed] [Google Scholar]
- 5.Kinoshita S, Adachi W, Sotozono C, et al. Characteristics of the human ocular surface epithelium. Prog Retin Eye Res 2001; 20:639–673. [DOI] [PubMed] [Google Scholar]
- 6.Wolosin JM, Budak MT, Akinci MA. Ocular surface epithelial and stem cell development. Int J Dev Biol 2004; 48:981–991. [DOI] [PubMed] [Google Scholar]
- 7.Hong J, Zheng T, Xu J, et al. Assessment of limbus and central cornea in patients with keratolimbal allograft transplantation using in vivo laser scanning confocal microscopy: an observational study. Graefes Arch Clin Exp Ophthalmol 2011; 249:701–708. [DOI] [PubMed] [Google Scholar]
- 8.Li W, Hayashida Y, Chen YT, et al. Niche regulation of corneal epithelial stem cells at the limbus. Cell Res 2007; 17:26–36. [DOI] [PMC free article] [PubMed] [Google Scholar]
- 9.Shortt AJ, Secker GA, Munro PM, et al. Characterization of the limbal epithelial stem cell niche: novel imaging techniques permit in vivo observation and targeted biopsy of limbal epithelial stem cells. Stem Cells 2007; 25:1402–1409. [DOI] [PubMed] [Google Scholar]
- 10.Zheng T, Xu J. Age-related changes of human limbus on in vivo confocal microscopy. Cornea 2008; 27:782–786. [DOI] [PubMed] [Google Scholar]
- 11.Patel DV, Sherwin T, McGhee CN. Laser scanning in vivo confocal microscopy of the normal human corneoscleral limbus. Invest Ophthalmol Vis Sci 2006; 47:2823–2827. [DOI] [PubMed] [Google Scholar]
- 12.Lagali N, Eden U, Utheim TP, et al. In vivo morphology of the limbal palisades of vogt correlates with progressive stem cell deficiency in aniridia-related keratopathy. Invest Ophthalmol Vis Sci 2013; 54:5333–5342. [DOI] [PubMed] [Google Scholar]
- 13.Goldberg MF. In vivo confocal microscopy and diagnosis of limbal stem cell deficiency. Photographing the palisades of vogt and limbal stem cells. Am J Ophthalmol 2013; 156:205–206. [DOI] [PubMed] [Google Scholar]
- 14.Miri A, Al-Aqaba M, Otri AM, et al. In vivo confocal microscopic features of normal limbus. Br J Ophthalmol 2012; 96:530–536. [DOI] [PubMed] [Google Scholar]
- 15.Kobayashi A, Sugiyama K. In vivo corneal confocal microscopic findings of palisades of Vogt and its underlying limbal stroma. Cornea 2005; 24:435–437. [DOI] [PubMed] [Google Scholar]
- 16.Bizheva K, Hutchings N, Sorbara L, et al. In vivo volumetric imaging of the human corneo-scleral limbus with spectral domain OCT. Biomed Opt Express 2011; 2:1794–1702. [DOI] [PMC free article] [PubMed] [Google Scholar]
- 17.Huang D, Swanson EA, Lin CP, et al. Optical coherence tomography. Science 1991; 254:1178–1181. [DOI] [PMC free article] [PubMed] [Google Scholar]
- 18.Fercher AF. Optical coherence tomography. J Biomed Opt 1996; 1:157–173. [DOI] [PubMed] [Google Scholar]
- 19.Wojtkowski M. High-speed optical coherence tomography: basics and applications. Appl Opt 2010; 49:D30–61. [DOI] [PubMed] [Google Scholar]
- 20.Lathrop KL, Gupta D, Kagemann L, et al. Optical coherence tomography as a rapid, accurate, noncontact method of visualizing the palisades of Vogt. Invest Ophthalmol Vis Sci 2012; 53:1381–1387. [DOI] [PMC free article] [PubMed] [Google Scholar]
- 21.Leung CK. Diagnosing glaucoma progression with optical coherence tomography. Curr Opin Ophthalmol 2014; 25:104–111. [DOI] [PubMed] [Google Scholar]
- 22.Kanagasingam Y, Bhuiyan A, Abramoff MD, et al. Progress on retinal image analysis for age related macular degeneration. Prog Retin Eye Res 2014; 38:20–42. [DOI] [PubMed] [Google Scholar]
- 23.Mrejen S, Spaide RF. Optical coherence tomography: imaging of the choroid and beyond. Surv Ophthalmol 2013; 58:387–429. [DOI] [PubMed] [Google Scholar]
- 24.Adhi M, Duker JS. Optical coherence tomography—current and future applications. Curr Opin Ophthalmol 2013; 24:213–221. [DOI] [PMC free article] [PubMed] [Google Scholar]
- 25.Sung KR, Kim JS, Wollstein G, et al. Imaging of the retinal nerve fibre layer with spectral domain optical coherence tomography for glaucoma diagnosis. Br J Ophthalmol 2011; 95:909–914. [DOI] [PMC free article] [PubMed] [Google Scholar]
- 26.Ramos JL, Li Y, Huang D. Clinical and research applications of anterior segment optical coherence tomography—a review. Clin Exp Ophthalmol 2009; 37:81–89. [DOI] [PMC free article] [PubMed] [Google Scholar]
- 27.Simpson T, Fonn D. Optical coherence tomography of the anterior segment. Ocul Surf 2008; 6:117–127. [DOI] [PubMed] [Google Scholar]
- 28.Medina CA, Plesec T, Singh AD. Optical coherence tomography imaging of ocular and periocular tumours. Br J Ophthalmol 2014; 98 suppl 2:ii40–46. [DOI] [PMC free article] [PubMed] [Google Scholar]
- 29.Sayegh RR, Pineda R., 2nd Practical applications of anterior segment optical coherence tomography imaging following corneal surgery. Semin Ophthalmol 2012; 27:125–132. [DOI] [PubMed] [Google Scholar]
- 30.Wylegala E, Nowinska A. Usefulness of anterior segment optical coherence tomography in Descemet membrane detachment. Eur J Ophthalmol 2009; 19:723–728. [DOI] [PubMed] [Google Scholar]
- 31.Chew AC, Mehta JS, Tan DT. Deep lamellar keratoplasty after resolution of hydrops in keratoconus. Cornea 2011; 30:454–459. [DOI] [PubMed] [Google Scholar]
- 32.Lim LS, Aung HT, Aung T, et al. Corneal imaging with anterior segment optical coherence tomography for lamellar keratoplasty procedures. Am J Ophthalmol 2008; 145:81–90. [DOI] [PubMed] [Google Scholar]
- 33.Li Y, Tan O, Brass R, et al. Corneal epithelial thickness mapping by Fourier-domain optical coherence tomography in normal and keratoconic eyes. Ophthalmology 2012; 119:2425–2433. [DOI] [PMC free article] [PubMed] [Google Scholar]
- 34.Ma XJ, Wang L, Koch DD. Repeatability of corneal epithelial thickness measurements using Fourier-domain optical coherence tomography in normal and post-LASIK eyes. Cornea 2013; 32:1544–1548. [DOI] [PMC free article] [PubMed] [Google Scholar]
- 35.Kanellopoulos AJ, Asimellis G. Anterior-segment optical coherence tomography investigation of corneal deturgescence and epithelial remodeling after DSAEK. Cornea 2014; 33:340–348. [DOI] [PubMed] [Google Scholar]
- 36.Francoz M, Karamoko I, Baudouin C, et al. Ocular surface epithelial thickness evaluation with spectral-domain optical coherence tomography. Invest Ophthalmol Vis Sci 2011; 52:9116–9123. [DOI] [PubMed] [Google Scholar]
- 37.Yang Y, Hong J, Deng SX, et al. Age-related changes in human corneal epithelial thickness measured with anterior segment optical coherence tomography. Invest Ophthalmol Vis Sci 2014; 55:5032–5038. [DOI] [PubMed] [Google Scholar]
- 38.Li P, An L, Reif R, et al. In vivo microstructural and microvascular imaging of the human corneo-scleral limbus using optical coherence tomography. Biomed Opt Express 2011; 2:3109–3118. [DOI] [PMC free article] [PubMed] [Google Scholar]
- 39.Park DJJ, Karesh JW. Topographic anatomy of the eye: an overview. Lippincott Williams & Wilkins, Duane's Clinical Ophthalmology on CD-ROM. Philadelphia, USA:2006. [Google Scholar]
- 40.Kadar T, Dachir S, Cohen L, et al. Ocular injuries following sulfur mustard exposure—pathological mechanism and potential therapy. Toxicology 2009; 263:59–69. [DOI] [PubMed] [Google Scholar]
- 41.Baradaran-Rafii A, Javadi MA, Rezaei Kanavi M, et al. Limbal stem cell deficiency in chronic and delayed-onset mustard gas keratopathy. Ophthalmology 2010; 117:246–252. [DOI] [PubMed] [Google Scholar]
- 42.Baradaran-Rafii A, Eslani M, Tseng SC. Sulfur mustard-induced ocular surface disorders. Ocul Surf 2011; 9:163–178. [DOI] [PubMed] [Google Scholar]
- 43.Ditta LC, Shildkrot Y, Wilson MW. Outcomes in 15 patients with conjunctival melanoma treated with adjuvant topical mitomycin C: complications and recurrences. Ophthalmology 2011; 118:1754–1759. [DOI] [PubMed] [Google Scholar]
- 44.Dua HS, Azuara-Blanco A. Limbal stem cells of the corneal epithelium. Surv Ophthalmol 2000; 44:415–425. [DOI] [PubMed] [Google Scholar]
- 45.Fatima A, Iftekhar G, Sangwan VS, et al. Ocular surface changes in limbal stem cell deficiency caused by chemical injury: a histologic study of excised pannus from recipients of cultured corneal epithelium. Eye (Lond) 2008; 22:1161–1167. [DOI] [PubMed] [Google Scholar]
- 46.Hatch KM, Dana R. The structure and function of the limbal stem cell and the disease states associated with limbal stem cell deficiency. Int Ophthalmol Clin 2009; 49:43–52. [DOI] [PubMed] [Google Scholar]
- 47.Javadi MA, Jafarinasab MR, Feizi S, et al. Management of mustard gas-induced limbal stem cell deficiency and keratitis. Ophthalmology 2011; 118:1272–1281. [DOI] [PubMed] [Google Scholar]
- 48.Russell HC, Chadha V, Lockington D, et al. Topical mitomycin C chemotherapy in the management of ocular surface neoplasia: a 10-year review of treatment outcomes and complications. Br J Ophthalmol 2010; 94:1316–1321. [DOI] [PubMed] [Google Scholar]
- 49.Tseng SC. Concept and application of limbal stem cells. Eye (Lond) 1989; 3 (Pt 2):141–157. [DOI] [PubMed] [Google Scholar]
- 50.Feng Y, Simpson TL. Comparison of human central cornea and limbus in vivo using optical coherence tomography. Optom Vis Sci 2005; 82:416–419. [DOI] [PubMed] [Google Scholar]
- 51.Alonso-Caneiro D, Shaw AJ, Collins MJ. Using optical coherence tomography to assess corneoscleral morphology after soft contact lens wear. Optom Vis Sci 2012; 89:1619–1626. [DOI] [PubMed] [Google Scholar]
- 52.van der Merwe EL, Kidson SH. Advances in imaging the blood and aqueous vessels of the ocular limbus. Exp Eye Res 2010; 91:118–126. [DOI] [PubMed] [Google Scholar]
- 53.Sarunic MV, Asrani S, Izatt JA. Imaging the ocular anterior segment with real-time, full-range Fourier-domain optical coherence tomography. Arch Ophthalmol 2008; 126:537–542. [DOI] [PMC free article] [PubMed] [Google Scholar]
- 54.Yew DT, Sha O, Li WW, et al. Proliferation and apoptosis in the epithelium of the developing human cornea and conjunctiva. Life Sci 2001; 68:2987–3003. [DOI] [PubMed] [Google Scholar]
- 55.Huang J, Ding X, Savini G, et al. A comparison between Scheimpflug imaging and optical coherence tomography in measuring corneal thickness. Ophthalmology 2013; 120:1951–1958. [DOI] [PubMed] [Google Scholar]
- 56.Werkmeister RM, Alex A, Kaya S, et al. Measurement of tear film thickness using ultrahigh-resolution optical coherence tomography. Invest Ophthalmol Vis Sci 2013; 54:5578–5583. [DOI] [PubMed] [Google Scholar]


