

Supplemental Digital Content is available in the text
Keywords: DNA methylation 450K array, thyroid benign, thyroid cancer, thyroid hyperplasia
Abstract
Background:
During development, methylation permanently changes gene activity, while aberrant gene methylation is key to human tumorigenesis. Gene methylation is an epigenetic event leading to gene silencing and some tumor suppressor genes that are aberrantly methylated in both thyroid cancer and benign thyroid tumor, suggesting a role for methylation in early thyroid tumorigenesis. Specific gene methylation occurs in certain types of thyroid cancer and depends on particular signaling pathways. Most reports rely on data from varied samples that vary tremendously with respect to methylation.
Results:
We observed that hyperplastic/malignant (H/M) thyroid tissue and benign/manligant (B/M) tissue had the most profoundly methylated loci compared to hyperplastic/benign (H/B) tissue. These loci are mapped to 863 genes (|Δβ value| > 0.15) in B/M and 1082 genes (|Δβ value| > 0.15) in H/M. After bioinformatic analysis, these genes were found to be involved in T-cell receptor signaling pathway (B/M) and Jak–Stat signaling pathways (H/M).
Conclusion:
Our study offers the most comprehensive DNA methylation data for thyroid disease to date, using 1 patient with 3 tissue types and high-resolution 450K arrays. Our data may lay the foundation for future identification of novel epigenetic targets or diagnosis of thyroid cancer.
1. Introduction
Thyroid cancer is the most common endocrine cancer—the most prevalent type of the papillary thyroid cancer (PTC)—and it is frequently diagnosed before adulthood. Deaths due to thyroid cancer have been low and stable for several years, compared with other cancers, but a clinically significant thyroid nodule may develop in 5% to 10% of the general population during their lifetime.[1]
Thyroid cancer is known as a multifactorial disease, which can be infected by susceptibility genes and environmental factors. There is a piece of evidence suggesting that interindividual differences in cancer susceptibility can also depend on epigenetic changes.[2] Epigenetics does not consider changes to underlying DNA sequences, but instead focuses on heritable changes in gene expression. DNA methylation is a type of epigenetic modification found in the human genome. Both tumor suppressor gene or DNA repair gene hypermethylation and repetitious DNA hypomethylation are closely related to different tumor types. Recently,[3] researchers confirmed that DNA methylation in a genome can be changed by DNA methyltransferase or by other factors such as histone modification, diet, environment, and RNA interference. With histone modification and chromatin remodeling, DNA methylation is important for transcriptional regulation.
Recently, epigenetic regulation of gene expression has emerged as a potentially important factor in tissue differences within a single disease. In chromosomal regions of tumor-associated genes, the epigenetic modifications can change important associated regulatory mechanisms for pathogenic malignant transformation. With DNA methylation, a methyl group is added to the fifth carbon on the cytosine residue in a CpG dinucleotide. CpG dinucleotides's rich regions (CpG islands) are usually located in the 5′-flanking gene promoter areas. Gene promoter methylation, particularly near the transcription start site, is associated with chromatin remodeling, which affects gene silencing.[4] DNA methylation is crucial for regulation gene expression and is known to be essential for the normal cellular development and maintaining tissue characters. Tumor suppressor gene inactivation by promoter hypermethylation is thought to be important in carcinogenesis. Thus, measuring DNA methylation in a genome-wide manner would be valuable for studying mechanisms of epigenetic control involved in gene expression regulation.
For personalized therapy, molecularly-defined tumor subgroup identification appears promising. For example, gene expression panels associated with breast cancer are now used clinically to provide individualized therapy. These panels, which depict carcinogen exposure-associated differences in individual tumors, include DNA hypermethylation involved in gene silencing as well as DNA hypomethylation, which is associated with oncogene activation and genomic instability.[5,6] DNA methylation pattern alterations in cancer-related gene promoter regions may be associated with risk factors, clinical presentation, and thyroid cancer outcomes.
In this study, we use the Infinium Human Methylation 450 BeadChip platform to detect whole-genome methylation statistics of promoters and first exon sites (1st Exon) for thyroid cancerous, benign, and hyperplastic tissue. Data analysis includes a series of free-source software and package analyses of functional gene pathways. Also, significant biological functions and pathways related to these 3 tissue types are discussed. Our data should inform current opinions about gene methylation in thyroid tumorigenesis based on tissue epigenetics.
2. Materials and methods
2.1. Sample collection and DNA extraction
The patient thyroid samples were collected from the Zhongshan Hospital of Xiamen University. We obey the ethical standards of the Zhongshan Affiliated Hospital of Xiamen University committee when performing all procedures in this study involving human participants and with the 1964 Helsinki declaration and the comparable ethical standards or later amendments. The informed consent was obtained from all subjects. All experimental procedures were approved by the Zhongshan Affiliated Hospital of Xiamen University. Tissue was divided into 3 subtypes: papillary thyroid cancer, benign tissue, and hyperplastic tissue and stored at –80 oC. DNA from each tissue was extracted with a QIAamp DNA Mini Kit (QIAGEN) according to the manufacturer's instructions and stored at −80 °C to prevent degradation. Formalin-fixed, paraffin-embedded specimens were microscopically examined using H&E staining and reviewed by a pathologist (see in Supplement File).
2.2. Methylation chip experiment
This Infinium Human Methylation 450 BeadChip Kit can be used to acquire >450,000 methylation site. These sites cover 99% of RefSeq genes. These methylated region distributed across the whole body of gene, including its TSS, 5′-untranslated regions (UTR), 3′-UTR, first exon, and gene body. In this study, we filtered the transcription start site (TSS) and first exon sites (1st Exon), which have most significant influence on the gene.
According to the standard protocol, the microarray hybridization and scanning data were collected. After bisulfite treatment, the whole genome from each tissue was amplified, enzymatically fragmented and hybridized to the Illumina Infinium HumanMethylation450 BeadChip kits. Following hybridization, allele specific single-base extension and staining were performed. Then, the BeadChips were imaged on Illumina BeadArray Reader platform. The Illumina's BeadScan software was used for extracting the image intensities. The fluorescent signals from methylated and unmethylated alleles represented methylation data point from which the background intensity was then subtracted. Applying the default settings, DNA methylation data were processed using the GenomeStudio software (Illumina). For array data points, both methylated (Cy5) and unmethylated (Cy3) alleles were used to create the average methylation (β) value after 30 replicate methylation data collection. In addition, we excluded the methylation data on X chrome from the analysis. The filtered methylation sites were then mapped to its potential regulated gene defined in the UCSC Genome Browser HG19 RefSeq database.
2.3. Chip data analysis
We analyzed methylation data using the free and open-resources software R, which contains a suite of packages for data handling, such as ggplots2[7] (a powerful data visualization tool), clusterProfiler[8] (for analyzing and visualizing functional profiles-gene ontology (GO) and kyoto encyclopedia of genes and genomes (KEGG)-of genes and gene clusters). After clustering analysis, we identified common themes of particular gene clusters and compared biological themes among gene clusters. To bridge this gap, we choose clusterProfiler, for comparing and visualizing functional roles among gene clusters. All software parameters analyzed are shown in R script (See in Supplement File ).
3. Results and discussion
3.1. Chip data analysis across 3 types of thyroid tissue
In this study, we visualized these methylation data using the matrix chart (Fig. 1), which directly describes methylation at the whole genome level. Significant differences in gene methylation can be used to describe tissue differences Δβ values (difference among 3 samples) can be obtained and ranked (showing in Table 1) to show the top 5/5 hyper/hypomethylation genes among H/M, B/M, and B/M and this can be used (|Δβ value|>0.15) for bioinformatics analysis. Then, the methylation loci are mapped to 863 genes (|Δβ value|>0.15) in B/M and 1082 genes (|Δβ value|>0.15) in H/M. To understand hyper/hypomethylation of genes interaction with physiological processes, a biochemical (based R) package, clusterProfiler[8] was used for pathway analysis of KEGG (see Figs. 2–4). Data depict differences in gene methylation among hyperplastic, benign and malignant thyroid tissue involved in T-cell receptor signaling pathway (B/M), Jak−Stat signaling pathways (H/M).
Figure 1.

Comparisons of DNA methylation level in malignant, hyperplasia, and benign thyroid tissues. β value was used for estimation of methylation level using the ratio of intensities between methylated and unmethylated alleles, calculating by β value = methylated allele intensity (M)/(unmethylated allele intensity (U) + methylated allele intensity (M) + 100). β value reflects the methylation intensity at each CpG site. β value of 0 to 1 represented signifying percent methylation, from 0% to 100%, respectively, for each CpG site.
Table 1.
The top 5 hyper- and hypo-methylation genes in thyroid malignant, benign, and hyperplasia tissue.

Figure 2.

Category Net Plot of KEGG enrichment. The top 5 (most significant) categories of each cluster (A: benign and malignant; B: hyperplastic and malignant) was plotted: dot sizes were based on their corresponding row “percentage” as a default parameter to represent dot size. Some categories may contain many genes, so dots for those categories are too small to compare. Dots in the plot are colored based on their Δβ value. Color gradient ranging from green to red corresponds to order of increasing Δβ value. Δβ value displayed differential methylation levels of malignant compared with benign in A (malignant compared with hyperplastic in B). Green = hypomethylation, KEGG = kyoto encyclopedia of genes and genomes, red = hypermethylation.
Figure 4.
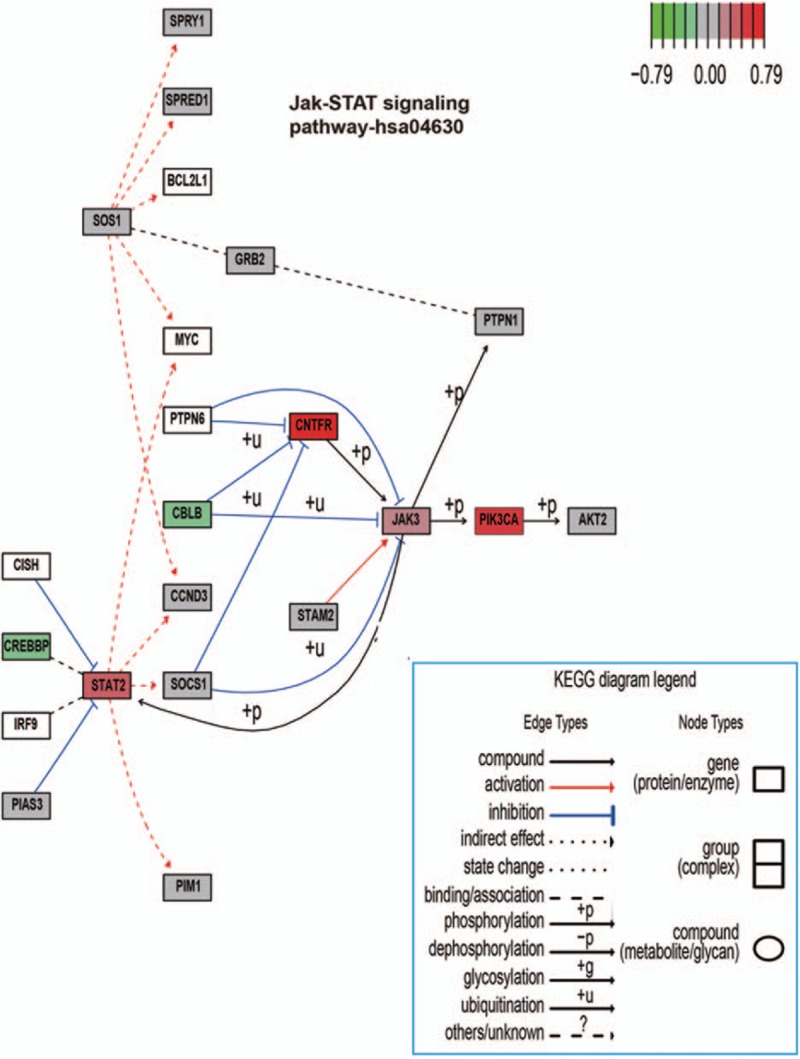
KEGG in Graphviz view of Jak–STAT signaling pathways on a canonical signaling pathway with gene methylation chip data. The methylation chip data were integrated, analyzed, and visualized in the Jak–STAT signaling pathways. Color gradient ranging from green to red corresponds to order of increasing Δβ value. Δβ value displayed differential methylation levels of malignant compared with hyperplastic. Green = hypomethylation, KEGG = kyoto encyclopedia of genes and genomes, red = hypermethylation.
3.2. T-cell receptor signaling pathway involved in benign and malignant thyroid tumor
The gene methylation status of B/M in the T-cell receptor signaling pathway is depicted in Figs. 2A and 3 Figs. 2 and 3. In the immune response, T-cell receptor (TCR) stimulation can induce a series of intracellular signaling cascades and these cascades regulate a series of important functions, such as T-cell development, homeostasis, activation, acquisition of effector functions, and apoptosis. CD3 molecules complexing with the TCR heterodimer form immunoreceptor tyrosine-based activation motifs (ITAMs), which are important for signal transduction in immune cells. ITAMs orchestrat sequential activation of transmembrane adaptors: linker activator for T-cells (LAT), which ultimately induce effector functions.[9–11] During T-cell activation, the CD28 molecule provides an essential co-stimulatory signal. This signal increases the IL-2 production, T-cell proliferation, and protects cell from increasing the immune response and preventing cell death. After be activated by the CD28 molecule, Lck subsequently stimulates and activates the tyrosine kinases: Fyn and ZAP70. ZAP70 remains associated with TCR and induces activation of LAT, which binds to the adaptor growth factor receptor-IL-2 inducible T-cell kinase (ITK). Besides this, LAT stimulates 1 critical protein phospholipase-C-γ1 that play important role for the production of the second messengers diacylglycerol (DAG) and inositol triphosphate (IP3).[12–15] The activated LAT interacts with GRB2, by this manner GRB2 and GRAP-associated SOS are pooled to the cell membrane and then potentially activate Ras.[14] The activated Ras will lead to the activation of serine/threonine kinases: Raf1, MAPK/ERK kinase.[9,14–16] In this pathway, cytotoxic T-lymphocyte antigen-4 (CTLA4), which serves as a natural inhibitor, negatively regulates T-cell activation, so that once T-cells become activated by the disease that turns them on and the body can naturally decrease T-cell pathways to control activity. CTLA4 can interact with SHP2 and inhibits TCR phosphorylation. When control of TCR signaling is needed, ZAP70 recruit CTLA4 to the membrane.[17,18]
Figure 3.

KEGG in Graphviz view of T-cell receptor signaling pathways on a canonical signaling pathway with gene methylation chip data. The methylation chip data were integrated, analyzed, and visualized in the T-cell receptor signaling pathways. Color gradient ranging from green to red corresponds to order of increasing Δβ value. Δβ value displayed differential methylation levels of malignant compared with benign. Green = hypomethylation, KEGG = kyoto encyclopedia of genes and genomes, red = hypermethylation.
3.3. Jak–Stat signaling pathway involved in hyperplasia and malignant thyroid diseases
In development, cellular differentiation and homeostasis, Jak–Stat signaling pathways mediates essential cell-to-cell information transduction. Thus, dysregulation of this pathway has been associated with human malignancies. We created a view of this pathway involving the methylation status of H/M tissue in Figs. 2B and 4 Figs. 2 and 4. Jak3 was a member of nonreceptor protein tyrosine kinases family. Stat2, which is encoded by distinct genes, is a Signal transducer and activator. The Jak–Stat signaling pathway is regulated by diverse intrinsic and environmental stimuli, which increase cell/tissue response plasticity.[19,20] The phosphorylated stat2 dimerize complexed with IRF9/ISGF3G enters into the nucleus as transcription factor. The interferon-stimulated genes's transcription was activated by the binding of ISGF3 and IFN-stimulated response element (ISRE).[21,22] In an indirect manner, the Jak/Stat signaling pathway also promotes Ras signaling via Socs’ transcriptional activation. The actived Socs binds RasGAP, which plays a role of negative regulator of Ras signaling, and then reduces Ras's activity. Reciprocally, Rtk signaling pathway's activity promotes the Jak/Stat signaling by first activating some RTKs and next allowing Rtk/Ras pathway stimulation to active the downstream MAPK.
4. Conclusions
In our study, nonessential data (or “noise”) from inter-individual samples based on age, gender, and ethnicity (among others) were excluded and we offer a more precise profile for methylation differences among 3 types tissue (hyperplasia, benign, and malignant). Data indicate that hyperplastic/ malignant groups and benign/malignant groups were the most different and hyperplastic and benign tissues differed only slightly.
The T-cell receptor signaling pathway may play its role in benign and malignant thyroid tumor. An immune response involves T-cell activation, defends against tumor cells, and participates in rejection reactions. T-cell receptor stimulation may provoke proliferation, lack of a response to future stimuli, or cell death such as thymocytes. Because T-cells have so many roles in the immune response, it is important to understand what should assist us to comprehend how immune regulation dysfunction causes immune diseases and how immune system can be used for overcoming thyroid diseases.[23,24]
The Jak–Stat signaling pathway may involved in hyperplasia and malignant thyroid diseases. Our study shows that STATs were involved not only in breast cancer, myeloma, and head and neck cancer[25,26] but also thyroid tumor diseases by the hypermethylation and hypometylation of key genes.
However, structural epigenetic changes in DNA methylation do not necessarily result in alterations in gene expression, which is functionally more important than DNA methylation. Synergistic analysis of DNA methylation and gene expression may maximize the opportunity to insight upon the pathogenesis of thyroid cancer. Thus, more research is needed to extend our data suggesting that compared to benign and hyperplastic thyroid tissue, malignant thyroid tissue is the most methylated, and that methylation is important for cancer initiation.
Supplementary Material
Footnotes
Abbreviations: 1stExon = first exon sites, CTLA4 = cytotoxic T-lymphocyte antigen-4, DAG = diacylglycerol, GO = gene ontology, IP3 = inositol triphosphate, ISRE = IFN-stimulated response element, ITAMs = immunoreceptor tyrosine-based activation motifs, ITK = inducible T-cell kinase, KEGG = kyoto encyclopedia of genes and genomes, LAT = linker activator for T-cells, PTC = papillary thyroid cancer, TCR = T-cell receptor, TSS = transcription start site, UTR = untranslated regions.
L-LC and G-YL contributed equally to this study.
Authorship: L-lC participated in the design of the study, performed experiments, and participated in the writing of the paper. G-yL participated in the design of the study and collected patients’ samples. C-MT designed the study and participated in the writing of the paper.
Funding: This work was funded by The National Natural Science Foundation of China (grant number 81272445).
The authors have no conflicts of interest to disclose.
Supplemental Digital Content is available for this article.
References
- 1.Mazzaferri EL. Management of a solitary thyroid nodule. N Engl J Med 1993; 328:553–559. [DOI] [PubMed] [Google Scholar]
- 2.Dawson MA, Kouzarides T. Cancer epigenetics: from mechanism to therapy. Cell 2012; 150:12–27. [DOI] [PubMed] [Google Scholar]
- 3.Zhang LL, Wu JX. DNA methylation: an epigenetic mechanism for tumorigenesis. Yi Chuan 2006; 28:880–885. [PubMed] [Google Scholar]
- 4.Bird A. DNA methylation patterns and epigenetic memory. Genes Dev 2002; 16:6–21. [DOI] [PubMed] [Google Scholar]
- 5.Baylin SB, Ohm JE. Epigenetic gene silencing in cancer—a mechanism for early oncogenic pathway addiction? Nat Rev Cancer 2006; 6:107–116. [DOI] [PubMed] [Google Scholar]
- 6.Jones PA, Baylin SB. The fundamental role of epigenetic events in cancer. Nat Rev Genet 2002; 3:415–428. [DOI] [PubMed] [Google Scholar]
- 7.Wickham H. ggplot2: elegant graphics for data analysis. 2009; New York: Springer, (978-0-387-98140-6). [Google Scholar]
- 8.Yu G, Wang LG, Han Y, et al. clusterProfiler: an R package for comparing biological themes among gene clusters. OMICS 2012; 16:284–287. [DOI] [PMC free article] [PubMed] [Google Scholar]
- 9.Davis MM. A new trigger for T cells. Cell 2002; 110:285–287. [DOI] [PubMed] [Google Scholar]
- 10.Okkenhaug K, Vanhaesebroeck B. PI3K in lymphocyte development, differentiation and activation. Nat Rev Immunol 2003; 3:317–330. [DOI] [PubMed] [Google Scholar]
- 11.Coombs D, Kalergis AM, Nathenson SG, et al. Activated TCRs remain marked for internalization after dissociation from pMHC. Nat Immunol 2002; 3:926–931. [DOI] [PubMed] [Google Scholar]
- 12.Lin J, Weiss A. T cell receptor signalling. J Cell Sci 2001; 114 (pt 2):243–244. [DOI] [PubMed] [Google Scholar]
- 13.Okkenhaug K, Bilancio A, Emery JL, et al. Phosphoinositide 3-kinase in T cell activation and survival. Biochem Soc Transact 2004; 32 (pt 2):332–335. [DOI] [PubMed] [Google Scholar]
- 14.Gong Q, Cheng AM, Akk AM, et al. Disruption of T cell signaling networks and development by Grb2 haploid insufficiency. Nat Immunol 2001; 2:29–36. [DOI] [PubMed] [Google Scholar]
- 15.Davidson D, Bakinowski M, Thomas ML, et al. Phosphorylation-dependent regulation of T-cell activation by PAG/Cbp, a lipid raft-associated transmembrane adaptor. Mol Cell Biol 2003; 23:2017–2028. [DOI] [PMC free article] [PubMed] [Google Scholar]
- 16.Alonso A, Rahmouni S, Williams S, et al. Tyrosine phosphorylation of VHR phosphatase by ZAP-70. Nat Immunol 2003; 4:44–48. [DOI] [PubMed] [Google Scholar]
- 17.Gough SC, Walker LS, Sansom DM. CTLA4 gene polymorphism and autoimmunity. Immunol Rev 2005; 204:102–115. [DOI] [PubMed] [Google Scholar]
- 18.Lin H, Rathmell JC, Gray GS, et al. Cytotoxic T lymphocyte antigen 4 (CTLA4) blockade accelerates the acute rejection of cardiac allografts in CD28-deficient mice: CTLA4 can function independently of CD28. J Exp Med 1998; 188:199–204. [DOI] [PMC free article] [PubMed] [Google Scholar]
- 19.Ananthakrishnan R, Hallam K, Li Q, et al. JAK-STAT pathway in cardiac ischemic stress. Vasc Pharmacol 2005; 43:353–356. [DOI] [PubMed] [Google Scholar]
- 20.Walker JG, Smith MD. The Jak–STAT pathway in rheumatoid arthritis. J Rheumatol 2005; 32:1650–1653. [PubMed] [Google Scholar]
- 21.Marrero MB. Introduction to JAK/STAT signaling and the vasculature. Vasc Pharmacol 2005; 43:307–309. [DOI] [PubMed] [Google Scholar]
- 22.Gao B. Cytokines, STATs and liver disease. Cell Mol Immunol 2005; 2:92–100. [PubMed] [Google Scholar]
- 23.Anderton SM. Avoiding autoimmune disease—T cells know their limits. Trends Immunol 2006; 27:208–214. [DOI] [PubMed] [Google Scholar]
- 24.Waldmann TA. Effective cancer therapy through immunomodulation. Ann Rev Med 2006; 57:65–81. [DOI] [PubMed] [Google Scholar]
- 25.Poehlmann TG, Busch S, Mussil B, et al. The possible role of the Jak/STAT pathway in lymphocytes at the fetomaternal interface. Chem Immunol Allergy 2005; 89:26–35. [DOI] [PubMed] [Google Scholar]
- 26.Grote K, Luchtefeld M, Schieffer B. JANUS under stress—role of JAK/STAT signaling pathway in vascular diseases. Vasc Pharmacol 2005; 43:357–363. [DOI] [PubMed] [Google Scholar]
Associated Data
This section collects any data citations, data availability statements, or supplementary materials included in this article.