Abstract
Frailty is a geriatric syndrome associated with adiposity. Zinc alpha2-glycoprotein (ZAG), a novel adipokine, is a modulator of body fat mass and positively correlates with age. This observational study aims to investigate the relationship between plasma ZAG levels and frailty in the elderly.
We enrolled 189 elder participants from a hospital-based comprehensive geriatric assessment program in Taiwan from January 2007 to June 2008. The demographic data, body weight, body mass index, appendicular skeletal muscle mass index (ASMI), body fat mass percentage, metabolic and inflammatory parameters including plasma tumor-necrosis factor alpha, C-reactive protein and ZAG levels, were assessed. The frailty score was assessed by Fried Frailty Index.
The mean age of all participants (91 [48.1%] men and 98 [51.9%] women) was 77.19 ± 6.12 years. Judged by the FFI score, 46 (24.34%) elders were robust, 106 (56.08%) were pre-frail, and 37 (19.58%) were frail. Older men showed greater ASMI and lower fat mass percentage in comparison to older women (P < 0.0001). The log-transformed mean plasma ZAG (μg/mL) level of overall was 1.82 ± 0.11, and it was higher in men than in women (1.85 ± 0.12 vs 1.79 ± 0.1, P = 0.0006). Plasma ZAG levels were different among the robust, pre-frail and frail subgroups (1.78 ± 0.09, 1.83 ± 0.12, 1.83 ± 1.10, respectively, P = 0.028), and the differences were more significant in woman elders (P = 0.005). Further multiple linear regression analysis showed plasma ZAG levels positively correlated with frailty severity in women (P for trend = 0.0435).
Plasma ZAG levels positively correlated with frailty severity in woman elders. The difference between sexes suggests certain sex-specific mechanisms may exist to affect the association between plasma ZAG levels and frailty.
Keywords: elders, frailty, zinc alpha2-glycoprotein
1. Introduction
Frailty is an important geriatric syndrome characterized by reduced physiological reserve and psycho-social impairments, and a prominent factor that contributes to disability and mortality.[1] The reported prevalence of frailty in older community-dwelling adults varies widely, from 4.0% to 59.1%,[2] and the prevalence of frailty increases with age and is higher in women.[3] Frailty is associated with adverse health outcomes, and poor outcomes such as death could be delayed if frailty was prevented.[3] The mechanism of frailty is multifactorial. Impairment and dysfunction of the endocrine and immune systems in aging are the two core engendering factors in the development of frailty.[4] Changes in the aging endocrine system, such as decreased insulin secretion, decreased pancreatic beta cell mass, and decreased insulin function, may lead to insulin resistance and diabetes.[5] Changes in the aging immune system, such as increases in levels of inflammatory molecules (interleukin 6 [IL-6] and C-reactive protein [CRP]) and total white blood cells, may lead to a chronic low-grade inflammatory status.[4] These changes in aging play an important role in the pathogenesis of frailty.[4,5] However, what mechanisms result in these organ dysfunction or system dysregulation in aging and consequently cause frailty has not been well understood.
Adipose tissue is an active endocrine organ producing several adipokines, which perform many physiological roles in insulin sensitivity, glucose and lipid metabolism, and in the inflammatory process.[6] Aging is characterized by changes in body composition including increase in fat mass, reduction in fat-free mass, and fat mainly accumulates in the abdomen.[7] Literatures suggest changes of adipose tissue or adipokines in aging are associated with geriatric frailty. For examples, leptin, an adipocyte-derived hormone playing an important role in regulation of appetite, thermogenesis, and body weight,[8] is able to prevent obesity[9] and improve both blood glucose and insulin resistance.[10] However, the association between plasma leptin level and fat mass is disrupted in elderly people and that may cause obesity during aging.[8] Furthermore, leptin resistance is associated with obesity[11] and leptin resistance is also noted during aging.[12,13] It has been demonstrated that plasma leptin level is higher in frail elderly people.[11]Therefore, it is suggested that changes in leptin level or leptin resistance contribute to frailty.[11] Similarly, adiponectin possesses insulin sensitizing, anti-atherosclerotic, and anti-inflammatory properties,[14] but we recently identified that high plasma adiponectin levels are positively associated with geriatric frailty.[15] Changes in these so-called “good adipokines” in aging may be a result of adipocyte dysfunction.[6,13]
Zinc alpha2-glycoprotein (ZAG), a novel adipokine, had been recognized as a lipid mobilizing factor in cancer cachexia.[16,17] ZAG has the ability to stimulate lipolysis in isolated mouse epididymal adipocytes in a dose-dependent manner, mediated by β-adrenoceptor through the activation of the cyclic AMP pathway.[18] ZAG gene expression has been shown to be downregulated in obese human adipose tissue.[19] Thus, ZAG is an adipokine modulator of fat mass.[20] However, a study conducted with a middle-aged population shows that serum ZAG correlated positively with parameters of adiposity and insulin resistance indices, suggesting a “ZAG resistance.”[21] Furthermore, plasma ZAG levels positively correlate with age.[21] These phenomena prompted us a question: whether ZAG in older population is associated with geriatric frailty. Few studies are available on ZAG in older population currently, and the aim of this study is to investigate the relationship between plasma ZAG levels and geriatric frailty.
2. Methods
2.1. Subjects
This is an observational study. From January 2007 to June 2008, the older patients who followed up for chronic disease with their family physicians in a hospital-based program were recruited for a structured comprehensive geriatric assessment if any of the inclusion criteria was met.[15] The inclusion criteria were indication for comprehensive geriatric assessment from the literature, geriatric syndromes, or indicators of high healthcare utilization. Specifically, patients who met any of the 11 criteria were included in this study: functional decline (as measured by new disabilities of activity of daily living [ADL] or instrumental activity daily living [IADL] in comparison of patient's baseline ADL or IADL), clinical indication of depression or dementia, mobility impairment, fall in recent one year, weight loss more than 5% per year, multiple comorbidities (≥5 diseases), polypharmacy (≥8 drugs), multiple specialty physician visits in recent 6 months (≥3 different specialties with ≥2 visits for each specialty), hospitalization in the past 1 year (≥1), frequent emergency room visits in the past year (≥2), and age above 80 years. The exclusion criteria were patients who were bedridden or residing in a nursing home, patients with an expected life expectancy of less than 6 months based on the gold standards framework prognostic indicator guidance,[22] and patients with a severely compromised hearing or communication capacity.
2.2. Data collection
The experienced nurses collected the data with a structured questionnaire, which included history on demographics, diseases, smoking and drinking habits, current medication, geriatric syndromes, blood pressure level, and body mass index (BMI).[15] The Frailty Index was assessed by modified Fried criteria[23]; “weight loss” was defined as self-reported unintentional weight loss of more than 3 kg (instead of 5 kg, adjusted in proportion to the Chinese body build) or greater than 5% of the body weight in the previous year. “Exhaustion” was indicated if the participants responded with “a moderate amount of the time” or “most of the time” to either of the following two statements: “I felt everything I did was an effort” or “I could not get going.” The statements were obtained from the Center for Epidemiological Studies-Depression Scale.[24] “Low physical activity” was defined by sex-specific, low weekly energy expenditure measured using the Taiwan International Physical Activity Questionnaire-Short Form[25] instead of the Minnesota Leisure Time Physical Activity Questionnaire.[26] “Slow walking speed” based on the time to walk for 5 m was below certain sex- and height-specific cut-points.[23] “Weakness” was indicated when the maximal grip strength (kilograms) in the dominant hand (3 grips averaged), using a Jamar hand-held dynamometer, was less than certain sex- and BMI-specific cut-points.[23] The subjects were classified as “robust,” “pre-frail,” or “frail” when 0, 1, or 2, or ≥3 components, respectively, screened positive.[23]
2.3. Measurement of body composition
Appendicular skeletal muscle mass (ASM) and body fat mass percentage were measured by bioelectric impedance analysis (BIA). This BIA model (Tanita BC-418, Tanita Corp., Tokyo, Japan) with a constant high frequency current (50 kHz, 500 mA) and an 8-contact electrode system was designed to measure the body composition in segmental parts of the whole body, including both arms, legs, and the trunk area. Appendicular skeletal muscle mass index (ASMI) could be estimated via this model (ASMI = ASM divided by squared height, kg/m2).[27] All examinations were conducted in compliance with the standard procedure.[28] For safety concerns, subjects on medical devices were excluded.
2.4. Biochemical assays and plasma ZAG measurement
Blood samples for the measurement of the ZAG levels, complete blood count, and biochemical analysis were obtained from the antecubital vein of the subjects after an 8-h fast. Complete blood count (CBC) and biochemical analysis were done in the central laboratory in our hospital, which are accredited by College of American Pathologists (CAP) and ISO15189. The CBC samples were analyzed on the Sysmex XE5000 analyzer (Kakogawa, Japan). Biochemical analysis was performed on the “Beckman Coulter” automated chemistry analyzer AU5800 (Shizuoka-Ken, Japan). For the ZAG study, the blood was then immediately centrifuged. The plasma samples obtained after centrifugation were then frozen at −70 °C until analysis. Plasma ZAG levels were measured by the commercial enzyme-linked immunosorbent assay (ELISA) kits (BioVendor, Brno, Czech). Plasma tumor-necrosis factor alpha (TNF-α) levels were measured by the commercial enzyme-linked immunosorbent assay (ELISA) kits (Assaypro LLC, Saint Charles, MO). Plasma CRP levels were measured by the latex agglutination test (Denka Seiken, Gosen, Niigata, Japan).
2.5. Statistical analyses
Descriptive statistical data were summarized as frequencies and percentages for categorical variables and means and standard deviations for other continuous variables. The t tests were used to compare the plasma ZAG levels between different comorbidities and obesity status. An analysis of variance was used to examine significant differences in the plasma ZAG levels of the three frailty subgroups. Linear models were used to test if there is a trend between frailty scores and plasma ZAG concentration (log-transformed) after adjusted for age, BMI, waist circumference, ASMI, fat mass percentage, and diabetes mellitus (DM) for both sexes and for all participations. A probability of less than 0.05 (P < 0.05) was considered statistically significant. All data were analyzed using SAS 9.2 statistical software (Cary, NC).
2.6. Ethics statement
The study protocol was approved by the ethics committee of the National Taiwan University Hospital (registration number: 200701017R)[15] and written informed consent was obtained from all participants before their inclusion in the study. The items of the consent form include aim, inclusion and exclusion criteria, procedures, harm and benefit, medical care, privacy and right, and withdrawal. All procedures were in accordance with the Helsinki Declaration. In addition, patients who were qualified to be recruited but declined to participate, or for any reason did not participate were still in care of their family physicians and were not disadvantaged in any way.
3. Results
3.1. Plasma ZAG levels in the study subjects
A total of 189 participants were enrolled. Demographic data were summarized in Table 1. There were 91 (48.1%) men and 98 (51.9%) women. The mean age of all participants was 77.19 ± 6.12 years. Most of the participants never smoked (65.08%) and woman nonsmokers were more than man nonsmokers. The leading comorbidities were hypertension (84.13%), hyperlipidemia (60.85%), DM (41.8%), coronary artery disease (29.63%), and stroke (26.98%). Seventeen (8.99%) patients had cancer history. The comorbidities were not significantly different between man and woman subgroups. Most of medication use was not significantly different in the man and woman subgroups except statins (P = 0.025). According to the frailty scores, 46 (24.34%) elders were robust, 106 (56.08%) elders were pre-frail, and 37 (19.58%) elders were frail. In both man and woman subgroups, the distribution patterns of frailty were similar to that of the overall.
Table 1.
Demographic data of study participants (n = 189).
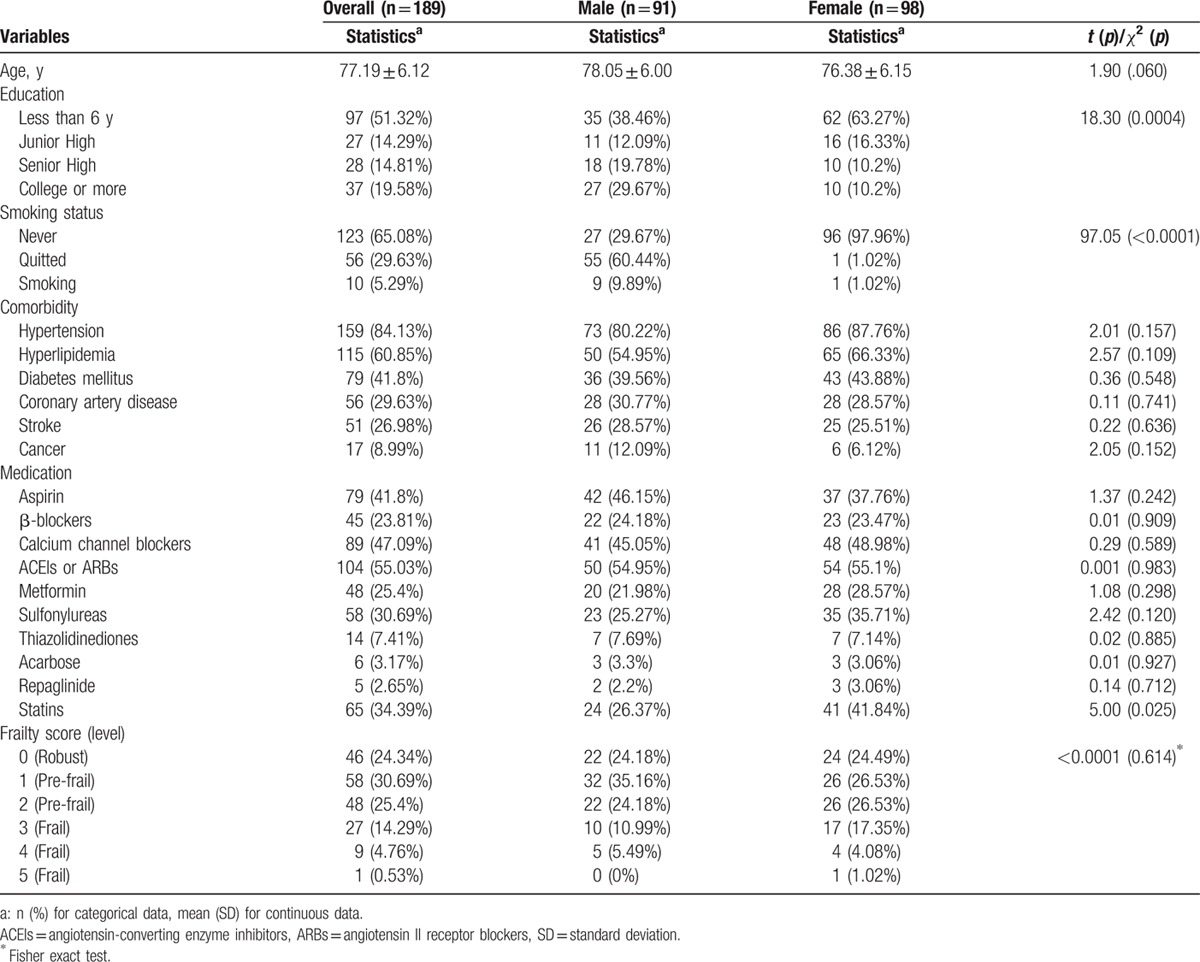
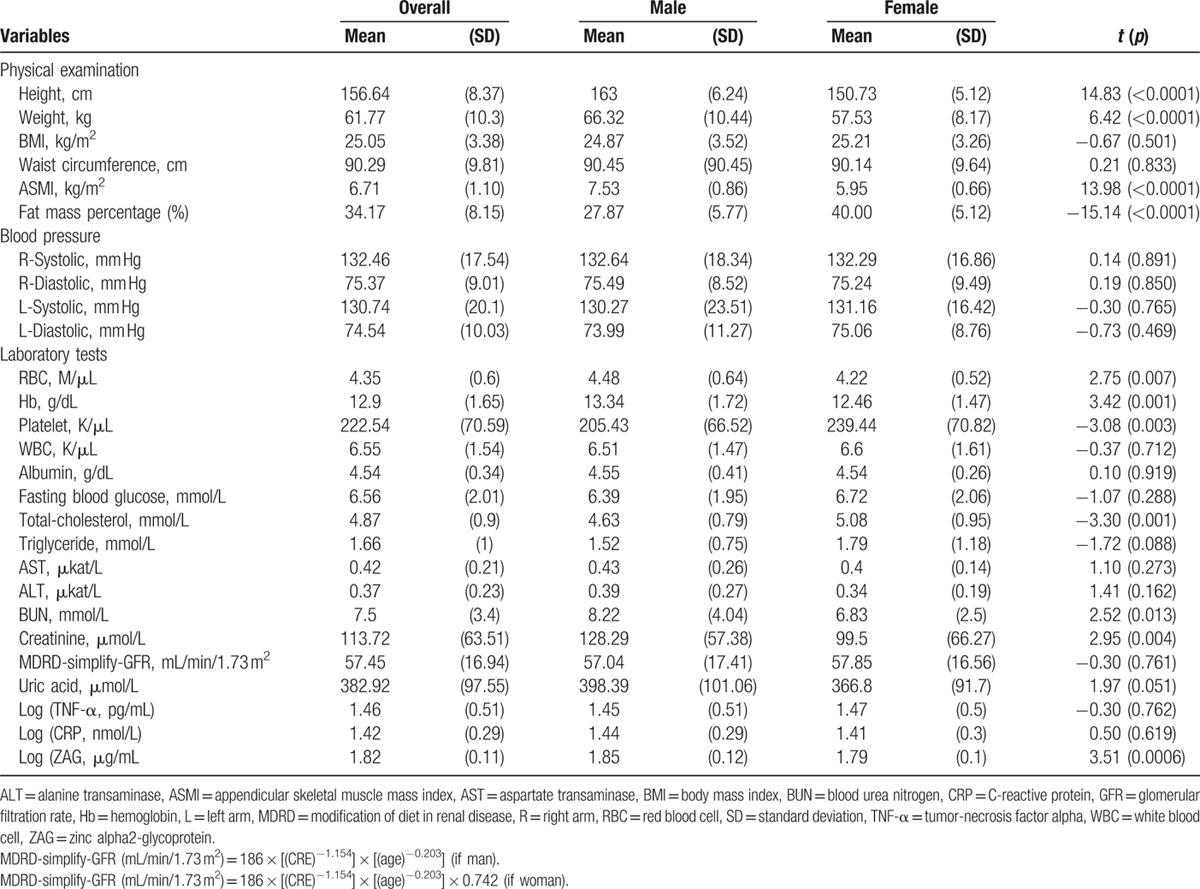
Table 2 compared the physical examination and laboratory tests between man and woman subgroups. The mean BMI was 25.05 ± 3.38 kg/m2 in all participants. There was no significant difference between the two subgroups in BMI and in waist circumference. The mean ASMI was 6.71 ± 1.10 kg/m2 and the mean fat mass percentage was 34.17 ± 8.15% in all participants. Older men showed significantly greater ASMI and lower fat mass percentage in comparison to older women (P < 0.0001). Red blood cell (RBC) (P = 0.007), hemoglobin (P = 0.001), platelet (P = 0.003), total cholesterol (P = 0.001), blood urea nitrogen (BUN) (P = 0.013), and creatinine (P = 0.004) were significantly different between man and woman subgroups. The log-transformed mean plasma ZAG (μg/mL), TNF-α (pg/mL), and CRP (nmol/mL) levels in all participants were 1.82 ± 0.11, 1.46 ± 0.51, and 1.42 ± 0.29, respectively. The log-transformed mean plasma ZAG level (μg/mL) was significantly higher in man subgroup than that in woman subgroup (1.85 ± 0.12 vs 1.79 ± 0.1, P = 0.0006).
Table 2.
Results of the physical examination and laboratory tests of the 189 elders.
3.2. Plasma ZAG levels in three subgroups with different frailty levels
In order to investigate the relationship between frailty severity and plasma ZAG levels, participants were divided into three subgroups according to the frailty levels for further analyses. Age (P = 0.006), DM (P = 0.005), hyperlipidemia (P = 0.004), stroke (P = 0.004), and statins use (P = 0.006) were significantly different among the three subgroups (Table 3). Both of the mean ages in the pre-frail and frail subgroups were older than that in the robust subgroup. BMI, waist circumference, ASMI, and fat mass percentage were not significantly different among the three subgroups. The log-transformed mean plasma ZAG (μg/mL) levels in the robust, pre-frail, and frail subgroups were 1.78 ± 0.09, 1.83 ± 0.12, and 1.83 ± 0.10, respectively, which were significantly different (P = 0.028). The post hoc test revealed that plasma ZAG level in the pre-frail subgroup was significantly higher than that in the robust subgroup. It is noteworthy that it was in women (P = 0.005) rather than in men (P = 0.269) that plasma ZAG levels in the robust, pre-frail, and frail subgroups were significantly different. Table 4 showed the mean plasma ZAG levels in various comorbidities. Plasma ZAG levels in patients with and without DM were significantly different (P = 0.024). There was no difference in the mean plasma ZAG levels in subgroups with and without other comorbidities.
Table 3.
Comparisons among elders with different Frailty levels.
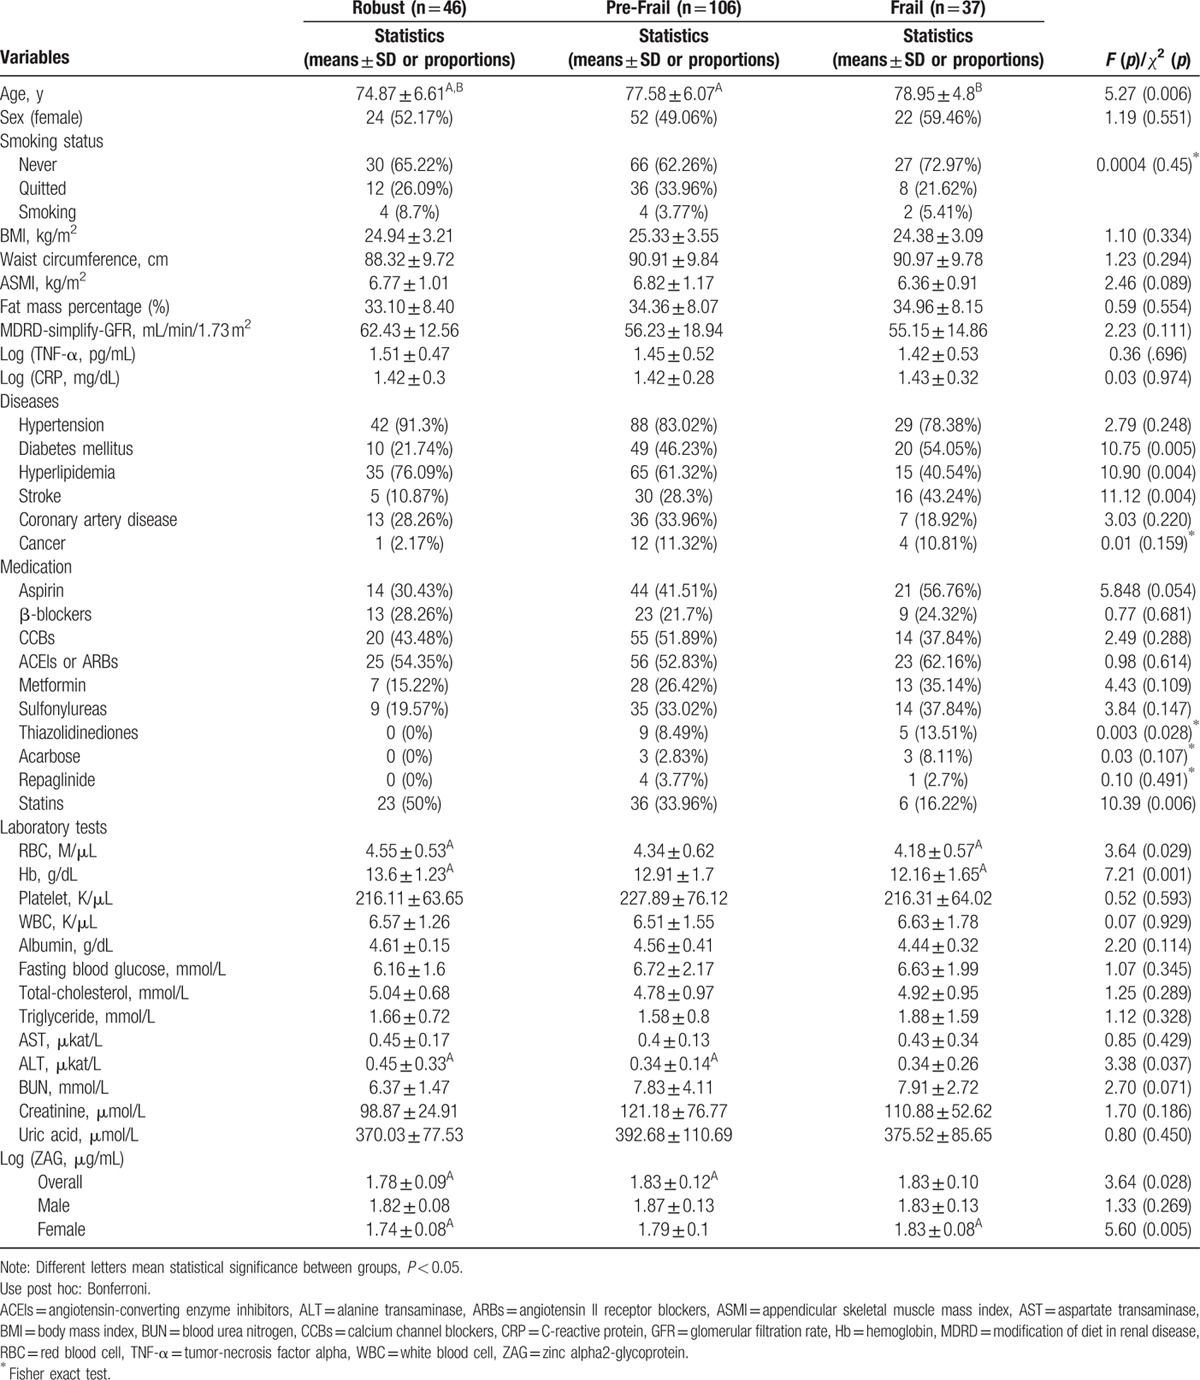
Table 4.
Plasma ZAG (μg/mL) levels in subgroups with and without selected comorbidities and obesity.

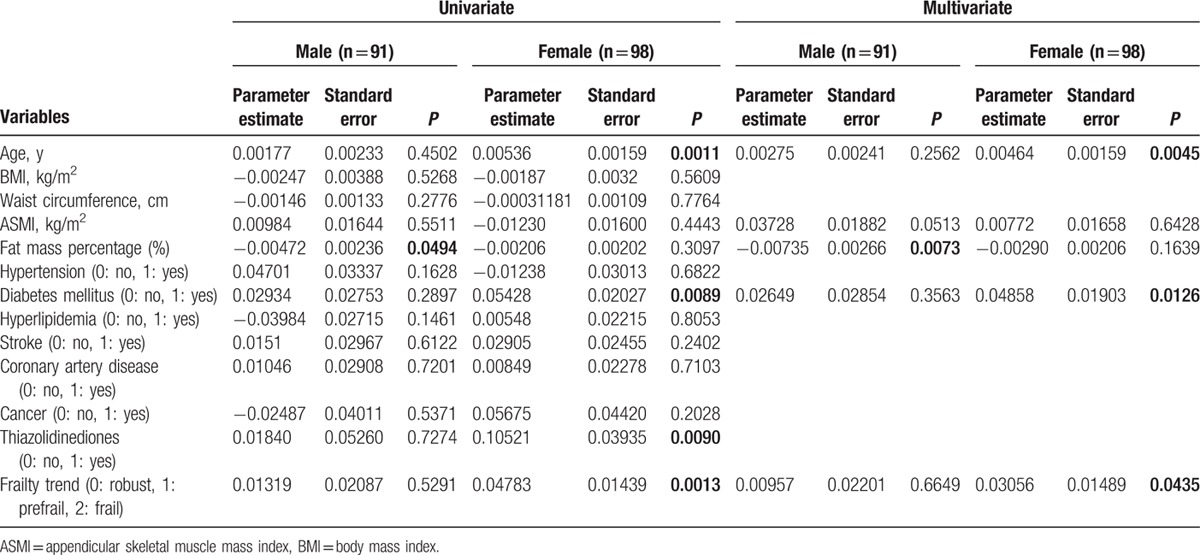
To explore correlation between various clinical variables and the plasma ZAG levels, linear regression analyses were performed. In the simple linear regression analysis, plasma ZAG levels positively correlated with age, ASMI, DM and frailty severity, and negatively correlated with female sex and fat mass percentage in all participants (Table 5). Further multiple linear regression analyses revealed that plasma ZAG levels positively correlated with age (P = 0.0088), ASMI (P = 0.036), DM (P = 0.0282), and negatively correlated with fat mass percentage (P = 0.0015) in all participants (Table 5). To explore the effects of sex on the relationship between adiposity, frailty severity, and plasma ZAG level, we separately performed the linear regression analyses in both man and woman groups. It was in man subgroup (P = 0.0073) but not in woman subgroup (P = 0.1639) that plasma ZAG levels negatively correlated with fat mass percentage after adjusting age, ASMI, DM, and frailty (Table 6). It was in woman subgroup (P = 0.0435) but not in man subgroup (P = 0.6649) that plasma ZAG levels significantly and positively correlated with frailty severity after adjusting age, ASMI, fat mass percentage, and DM (Table 6).
Table 5.
Univariate and multivariate linear regression analyses for log-transformed plasma zinc alpha2-glycoprotein levels (μg/mL) in overall participants (n = 189).
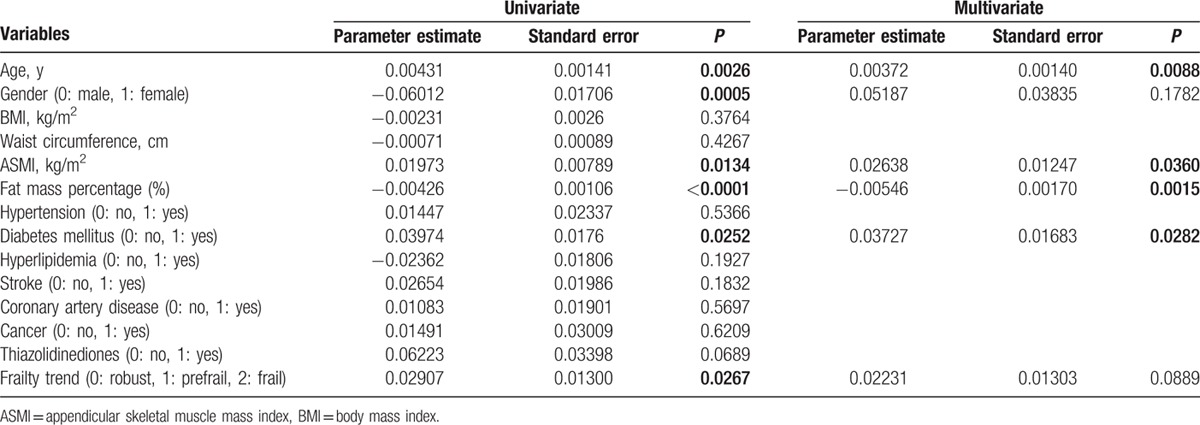
Table 6.
Univariate and multivariate linear regression analyses for log-transformed plasma zinc alpha2-glycoprotein levels (μg/mL) in male and female participants.
4. Discussion
In this study, we have identified that high plasma ZAG levels are associated with frailty in elders. Furthermore, plasma ZAG levels positively correlate with frailty severity in elder women. Our findings suggest that there is a link between high plasma ZAG levels and frailty in the older population.
A cross-sectional study has revealed that plasma ZAG levels correlated positively with age.[21] Our study further confirmed that relationship in the older population. In addition, we identified the positive relationship between age and frailty severity. Our data further demonstrated that high plasma ZAG levels were associated with frailty in elders. It is noteworthy that plasma ZAG levels are positively correlated with frailty severity in elder women.
One physiological characteristic of frailty is endocrine dysfunction such as insulin resistance.[5] A recent study has shown a positive association between insulin resistance and plasma ZAG levels in the middle-aged population,[21] and our study also demonstrated that DM was positively associated with plasma ZAG levels in the elderly. These findings might support that plasma ZAG levels are positively associated with frailty.
Another physiological characteristic of frailty is immune system alteration. Studies have shown positive relationships between frailty and the increased inflammatory cytokines, such as CRP and TNF-α, monocytes, and total white blood cells.[4] However, total white blood cells, plasma TNF-α, and CRP levels were not different among robust, pre-frail, and frail subgroups. Therefore, no evidence showed that increases in plasma ZAG levels were a compensatory upregulation of inflammation.
On the other hand, body weight, waist circumference, and parameters of adiposity such as BMI, muscle mass, and body fat mass percentage are also key markers of frailty.[29,30] A recent study showed that the frail elderly was characterized by higher BMI, lower muscle mass, and higher fat percentage compared with nonfrail elderly.[30] In our study, the frail elderly also had lower ASMI and higher fat mass percentage compared with the robust elderly, although there was no significant difference. The possible reasons that in our study, there was no significant difference in the parameters of adiposity among the robust, pre-frail, and frail subgroups may be due to older age of our participants and smaller sample size than those in the previous study. The older age may be associated with more severe adipocyte dysfunction.[31]
ZAG is an adipokine modulator of fat mass.[20] ZAG has property of lipolysis in adipocytes and administration of recombinant ZAG in mice lowers body weight and body fat.[18] ZAG gene expression is downregulated in obese human adipose tissue.[19] Our study also showed that ZAG negatively correlated with fat mass percentage in all participants. Furthermore, this association was significant in older men but not in older women. However, fat mass percentage did not significantly increase with frailty severity in our participants. Therefore, the phenomenon that ZAG positively correlated with frailty in the older women cannot be explained simply to adiposity.
Our data suggested sex differences in ZAG levels and frailty. Plasma ZAG levels are higher in men[21] and the prevalence of frailty is higher in women.[3] Our study also showed the similar pattern of sex differences in ZAG levels. Moreover, it is noteworthy that the association between plasma ZAG levels and frailty severity was more significant in women than in men in our study. A possible cause could be sex hormones. This surmise is based on the fact that other adipokines are also associated with sex hormones, such as leptin and adiponectin.[32–34] Moreover, we recently observed sex difference in the relationship between adiponectin and frailty severity.[15] Thus, we suggest sex hormones may be involved in sex differences in plasma ZAG levels and in the sex-specific relationship between plasma ZAG levels and geriatric frailty.
Medications affecting ZAG expression include β-blockers,[35] thiazolidinediones[17], and steroids.[17] However, none of the participants in our study used glucocorticoids. Besides, in our study, medications were not different among the robust, pre-frail, and frail subgroups except for statin, and plasma ZAG levels were not associated with medications. These findings suggested medications did not have a significant impact on plasma ZAG levels, frailty and the association between plasma ZAG levels and frailty in our study. With regard to different statin use among the robust, pre-frail, and frail subgroups, it may be resulted from the fact that aging, frailty, and aggravated polypharmacy as age advances affect age-specific medication use pattern.[36,37]
Factors such as adiposity and medication did not explain the high levels of plasma ZAG in frail elders. Geriatric frailty, which disturbs energy homeostasis, is associated with impairment and dysfunction of the endocrine and immune systems in aging.[4] Thus, the elevation of plasma ZAG levels in the frail elders may be due to age-related homeostatic dysregulation and adipocyte dysfunction.[15] Further investigation is warranted to define the underlying mechanisms.
Our study has the following limitations. First, the small sample size limits the number of confounding variables. A larger-scale study may confirm and refine the results obtained in this study. Second, the cross-sectional observational study cannot confirm the causality between high plasma ZAG levels and frailty. Third, certain studies show that plasma ZAG levels do not correlate with ZAG expression in visceral adipose tissue,[38] but we have no data of ZAG expression in adipose tissue for further analysis in our study. Fourth, there is no data about insulin resistance in our participants to show directly the association between plasma ZAG levels and insulin resistance.
In conclusion, plasma ZAG levels positively correlated with frailty severity in woman elders. Certain sex-specific mechanisms may exist to affect the relationship between plasma ZAG levels and frailty. Further studies are in need to clarify the underlying mechanisms.
Acknowledgments
The authors are indebted to the participants, the staff of the Eighth Core Laboratory, and the faculty of the Department of Family Medicine at the National Taiwan University Hospital for their full support of this study. The authors also acknowledge Yu-Ting Wang in statistical assistance provided by the Clinical Trial Center, Department of Medical Research in National Taiwan University Hospital.
Footnotes
Abbreviations: ADL = activity of daily living, ASM = appendicular skeletal muscle mass, ASMI = appendicular skeletal muscle mass index, BIA = bioelectric impedance analysis, BMI = body mass index, CBC = complete blood count, CRP = C-reactive protein, FFI = Fried Frailty Index, IADL = instrumental activity daily living, IL-6 = interleukin 6, IPAQ-SF = International Physical Activity Questionnaire-Short Form, TNF-α = tumor-necrosis factor alpha, ZAG = Zinc alpha2-glycoprotein.
This work is supported by the grants (NSC 98-2314-B-002-118-MY2 to Jaw-Shiun Tsai; PH-098-PP-48 to Ching-Yu Chen) from the National Science Council and the National Health Research Institute, Taiwan. The financial sponsors played no role in any aspect of the study.
The authors report no conflicts of interest.
References
- 1.Topinková E. Aging, disability and frailty. Ann Nutr Metab 2008; 52 suppl 1:6–11. [DOI] [PubMed] [Google Scholar]
- 2.Collard RM, Boter H, Schoevers RA, et al. Prevalence of frailty in community-dwelling older persons: a systematic review. J Am Geriatr Soc 2012; 60:1487–1492. [DOI] [PubMed] [Google Scholar]
- 3.Shamliyan T, Talley KM, Ramakrishnan R, et al. Association of frailty with survival: a systematic literature review. Ageing Res Rev 2013; 12:719–736. [DOI] [PubMed] [Google Scholar]
- 4.Walston J, Hadley EC, Ferrucci L, et al. Research agenda for frailty in older adults: toward a better understanding of physiology and etiology: summary from the American Geriatrics Society/National Institute on Aging Research Conference on Frailty in Older Adults. J Am Geriatr Soc 2006; 54:991–1001. [DOI] [PubMed] [Google Scholar]
- 5.Yehuda AB, Zinger A, Durso S. The older patient with diabetes: a practical approach. Diabetes Metab Res Rev 2014; 30:88–95. [DOI] [PubMed] [Google Scholar]
- 6.Leal Vde O, Mafra D. Adipokines in obesity. Clin Chim Acta 2013; 419:87–94. [DOI] [PubMed] [Google Scholar]
- 7.Raguso CA, Kyle U, Kossovsky MP, et al. A 3-year longitudinal study on body composition changes in the elderly: role of physical exercise. Clin Nutr 2006; 25:573–580. [DOI] [PubMed] [Google Scholar]
- 8.Moller N, O’Brien P, Nair KS. Disruption of the relationship between fat content and leptin levels with aging in humans. J Clin Endocrinol Metab 1998; 83:931–934. [DOI] [PubMed] [Google Scholar]
- 9.Vong L, Ye C, Yang Z, et al. Leptin action on GABAergic neurons prevents obesity and reduces inhibitory tone to POMC neurons. Neuron 2011; 71:142–154. [DOI] [PMC free article] [PubMed] [Google Scholar]
- 10.Berglund ED, Vianna CR, Donato J, Jr, et al. Direct leptin action on POMC neurons regulates glucose homeostasis and hepatic insulin sensitivity in mice. J Clin Invest 2012; 122:1000–1009. [DOI] [PMC free article] [PubMed] [Google Scholar]
- 11.Kalyani RR, Varadhan R, Weiss CO, et al. Frailty status and altered dynamics of circulating energy metabolism hormones after oral glucose in older women. J Nutr Health Aging 2012; 16:679–686. [DOI] [PubMed] [Google Scholar]
- 12.Gabriely I, Ma XH, Yang XM, et al. Leptin resistance during aging is independent of fat mass. Diabetes 2002; 51:1016–1021. [DOI] [PubMed] [Google Scholar]
- 13.Coimbra S, Brandão Proença J, Santos-Silva A, et al. Adiponectin, leptin, and chemerin in elderly patients with type 2 diabetes mellitus: a close linkage with obesity and length of the disease. Biomed Res Int 2014; 2014:701–915. [DOI] [PMC free article] [PubMed] [Google Scholar]
- 14.Chiarugi P, Fiaschi T. Adiponectin in health and diseases: from metabolic syndrome to tissue regeneration. Expert Opin Ther Targets 2010; 14:193–206. [DOI] [PubMed] [Google Scholar]
- 15.Tsai JS, Wu CH, Chen SC, et al. Plasma adiponectin levels correlate positively with an increasing number of components of frailty in male elders. PLoS One 2013; 8:e56250. [DOI] [PMC free article] [PubMed] [Google Scholar]
- 16.Bing C, Bao Y, Jenkins J, et al. Zinc-alpha2-glycoprotein, a lipid mobilizing factor, is expressed in adipocytes and is up-regulated in mice with cancer cachexia. Proc Natl Acad Sci USA 2004; 101:2500–2505. [DOI] [PMC free article] [PubMed] [Google Scholar]
- 17.Bao Y, Bing C, Hunter L, et al. Zinc-alpha2-glycoprotein, a lipid mobilizing factor, is expressed and secreted by human (SGBS) adipocytes. FEBS Lett 2005; 579:41–47. [DOI] [PubMed] [Google Scholar]
- 18.Hirai K, Hussey HJ, Barber MD, et al. Biological evaluation of a lipid-mobilizing factor isolated from the urine of cancer patients. Cancer Res 1998; 58:2359–2365. [PubMed] [Google Scholar]
- 19.Marrades MP, Martinez JA, Moreno-Aliaga MJ. ZAG, a lipid mobilizing adipokine, is downregulated in human obesity. J Physiol Biochem 2008; 64:61–66. [DOI] [PubMed] [Google Scholar]
- 20.Bing C, Mracek T, Gao D, et al. Zinc-(2-glycoprotein: an adipokine modulator of body fat mass? Int J Obes (Lond) 2010; 34:1559–1565. [DOI] [PubMed] [Google Scholar]
- 21.Yeung DC, Lam KS, Wang Y, et al. Serum zinc-alpha2-glycoprotein correlates with adiposity, triglycerides, and the key components of the metabolic syndrome in Chinese subjects. J Clin Endocrinol Metab 2009; 94:2531–2536. [DOI] [PubMed] [Google Scholar]
- 22.The Gold Standards Framework. Prognostic Indicator Guidance. 4th ed.; 2011. (Available from: http://www.goldstandardsframework.org.uk/cd-content/uploads/files/General%20Files/Prognostic%20Indicator%20Guidance%20October%202011.pdf) [Accessed July 18, 2016]. [Google Scholar]
- 23.Fried LP, Tangen CM, Walston J, et al. Frailty in older adults: evidence for a phenotype. J Gerontol A Biol Sci Med Sci 2001; 56:M146–M156. [DOI] [PubMed] [Google Scholar]
- 24.Radloff LS. The CES-D scale: a self-report depression scale for research in the general population. Appl Psychol Meas 1977; 1:385–401. [Google Scholar]
- 25.Liou YM, Jwo CJ, Yao KG, et al. Selection of appropriate Chinese terms to represent intensity and types of physical activity terms for use in the Taiwan version of IPAQ. J Nurs Res 2008; 16:252–263. [DOI] [PubMed] [Google Scholar]
- 26.Taylor HL, Jacobs DR, Jr, Schucker B, et al. A questionnaire for the assessment of leisure time physical activities. J Chronic Dis 1978; 31:741–755. [DOI] [PubMed] [Google Scholar]
- 27.Pietrobelli A, Rubiano F, St-Onge MP, et al. New bioimpedance analysis system: improved phenotyping with whole-body analysis. Eur J Clin Nutr 2004; 58:1479–1484. [DOI] [PubMed] [Google Scholar]
- 28.Organ LW, Bradham GB, Gore DT, et al. Segmental bioelectrical impedance analysis: theory and application of a new technique. J Appl Physiol 1994; 77:98–112. [DOI] [PubMed] [Google Scholar]
- 29.Guallar-Castillón P, Sagardui-Villamor J, Banegas JR, et al. Waist circumference as a predictor of disability among older adults. Obesity (Silver Spring) 2007; 15:233–244. [DOI] [PubMed] [Google Scholar]
- 30.Falsarella GR, Gasparotto LP, Barcelos CC, et al. Body composition as a frailty marker for the elderly community. Clin Interv Aging 2015; 10:1661–1666. [DOI] [PMC free article] [PubMed] [Google Scholar]
- 31.Donato AJ, Henson GD, Hart CR, et al. The impact of ageing on adipose structure, function and vasculature in the B6D2F1 mouse: evidence of significant multisystem dysfunction. J Physiol 2014; 592:4083–4096. [DOI] [PMC free article] [PubMed] [Google Scholar]
- 32.Cicero AF, Magni P, Lentini P, et al. Sex hormones and adipokines in healthy pre-menopausal, post-menopausal and elderly women, and in age-matched men: data from the Brisighella Heart study. J Endocrinol Invest 2011; 34:e158–e162. [DOI] [PubMed] [Google Scholar]
- 33.Baumgartner RN, Ross RR, Waters DL, et al. Serum leptin in elderly people: associations with sex hormones, insulin, and adipose tissue volumes. Obes Res 1999; 7:141–149. [DOI] [PubMed] [Google Scholar]
- 34.Tworoger SS, Mantzoros C, Hankinson SE. Relationship of plasma adiponectin with sex hormone and insulin-like growth factor levels. Obesity (Silver Spring) 2007; 15:2217–2224. [DOI] [PubMed] [Google Scholar]
- 35.Russell ST, Tisdale MJ. The role of glucocorticoids in the induction of zinc-(2-glycoprotein expression in adipose tissue in cancer cachexia. Br J Cancer 2005; 92:876–881. [DOI] [PMC free article] [PubMed] [Google Scholar]
- 36.Hess PL, Kim S, Piccini JP, et al. Use of evidence-based cardiac prevention therapy among outpatients with atrial fibrillation. Am J Med 2013; 126:625.e1–632.e1. [DOI] [PMC free article] [PubMed] [Google Scholar]
- 37.Manckoundia P, Lorenzini M, Disson-Dautriche A, et al. Assessment of the use of hypolipidemic agents (HAs), mainly statins, in elderly subjects aged 80 years and more in Burgundy: analysis of 13,211 patients. Arch Gerontol Geriatr 2012; 55:101–105. [DOI] [PubMed] [Google Scholar]
- 38.Ceperuelo-Mallafré V, Näf S, Escoté X, et al. Circulating and adipose tissue gene expression of zinc-alpha2-glycoprotein in obesity: its relationship with adipokine and lipolytic gene markers in subcutaneous and visceral fat. J Clin Endocrinol Metab 2009; 94:5062–5069. [DOI] [PubMed] [Google Scholar]


