

Summary
One of the goals of synthetic biology is to develop programmable artificial gene networks that can transduce multiple endogenous molecular cues to precisely control cell behavior. Realizing this vision requires interfacing natural molecular inputs with synthetic components that generate functional molecular outputs. Interfacing synthetic circuits with endogenous mammalian transcription factors has been particularly difficult. Here, we describe a systematic approach that enables integration and transduction of multiple mammalian transcription factor inputs by a synthetic network. The approach is facilitated by a proportional amplifier sensor based on synergistic positive autoregulation. The circuits efficiently transduce endogenous transcription factor levels into RNAi, transcriptional transactivation, and site-specific recombination. They also enable AND logic between pairs of arbitrary transcription factors. The results establish a framework for developing synthetic gene networks that interface with cellular processes through transcriptional regulators.
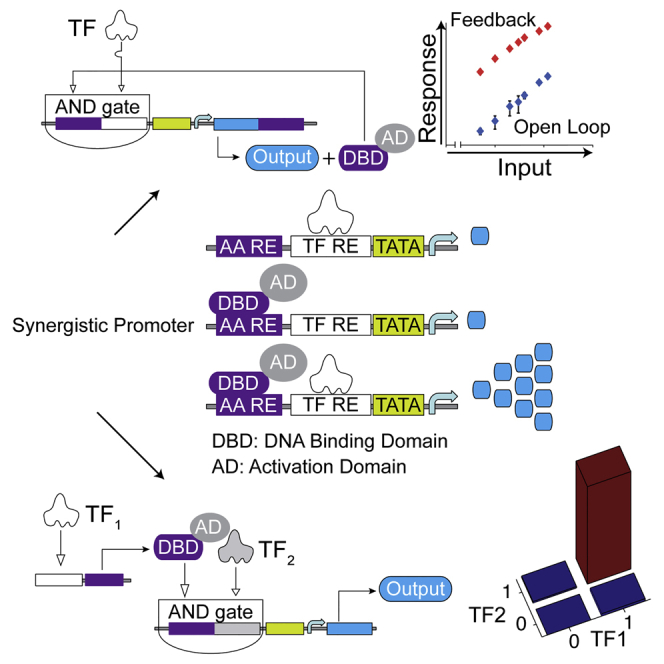
Graphical Abstract
Highlights
-
•
A positive feedback loop with high synergy between trigger input and amplifier
-
•
Rule-based design of robust amplified sensors of mammalian transcription factors
-
•
AND gates between pairs of unrelated transcription factors
-
•
Efficient transduction of transcriptional inputs into diverse downstream actuation
Coupling endogenous transcription factor activities to synthetic gene circuits has been a longstanding challenge. Angelici et al. describe highly synergistic composite promoters that enable robust and selective amplification of mammalian transcriptional inputs using positive feedback as well as their arbitrary pairing in promoter-level AND gates. The resulting sensors can efficiently transduce their inputs’ signal to downstream synthetic circuits via a variety of mechanisms, including RNAi, transactivation, and recombination.
Introduction
Development of synthetic gene networks, or circuits, has tended to employ two complementary approaches. One approach focuses on the unique function of a gene circuit, e.g., biomanufacturing (Steen et al., 2010), complex dynamics (Elowitz and Leibler, 2000, Gardner et al., 2000, Stricker et al., 2008, Tigges et al., 2009), or information processing (Ausländer et al., 2012, Benenson, 2012, Deans et al., 2007, Friedland et al., 2009, Green et al., 2014, Park et al., 2003, Rinaudo et al., 2007, Tamsir et al., 2011). The cells in which these networks operate are viewed as relatively passive containers, or chassis. A complementary effort aims to alter or modify cellular processes by focusing on gene circuits that interface with the host cell, sensing endogenous inputs from the cell or environment and responding with specific biologically active outputs (Ausländer et al., 2014, Culler et al., 2010, Kobayashi et al., 2004, Nissim and Bar-Ziv, 2010, Slomovic and Collins, 2015, Xie et al., 2011). Such circuits are conceptually similar to regulatory or signaling pathways, with inputs typically conveying information about an internal or environmental cell state and thus driving a desired response.
Although known mechanisms are typically used to establish interactions between endogenous inputs and synthetic components, extensive engineering effort is often necessary to match the two. One example is a family of proportional microRNA (miRNA) sensors (Lapique and Benenson, 2014) that employ RNAi (Fire et al., 1998, McManus and Sharp, 2002). Mammalian transcription factors (TFs) comprise another family of well-studied (Janknecht et al., 1993, Kadonaga et al., 1987), information-rich cellular inputs (Hobert, 2008). Although researchers constructed used complex transcriptional regulatory building blocks and networks (Amit et al., 2011, Farzadfard et al., 2013, Khalil et al., 2012, Leisner et al., 2010, Li et al., 2015, Lienert et al., 2013, Maeder et al., 2013, Perez-Pinera et al., 2013), they have tended to employ non-native transcriptional inputs.
Here, we present a framework for systematic rational design of selective and robust sensing, integration, and transduction of endogenous TF activity in mammalian cells. We begin by describing a cell-based assay for characterization of TF sensor elements and their comparative analysis. We use five transcriptional activators, each tested with a panel of response elements (REs). Due to modest induction levels, we augmented the sensors with positive transcriptional feedback using an artificial amplifier activator and observed, counterintuitively, high response levels and low leakage. We dissect the behavior of composite promoters within this feedback loop and uncover high synergy between the feedback amplifier activator and the endogenous input of interest. As a result, the sensors do not function as binary switches (Xiong and Ferrell, 2003) that generate either very low or saturated output, depending on whether the input is below or above a certain threshold (all-or-none response). Instead, they are amplifiers whose output grows in proportion to the input. They operate well within the physiological activity range of the input. The initial dataset and computational analysis allow formulation of design principles that we illustrate using three additional TFs. We next show that high-synergy promoters can be employed for tunable two-input AND logic between unrelated TFs, requiring simultaneous activation by both factors to trigger a response. Furthermore, we demonstrate sensor utility in diverse scenarios such as miRNA induction, transactivation of downstream genes, and site-specific recombination. Our findings open the door to rational design of efficient and selective transcriptional sensors as part of downstream synthetic networks for sophisticated intervention into cell physiology.
Results
Characterization of TF REs on a Neutral Background
We designed an assay (Figure 1A) to probe TF interactions with their REs and gauge their specificity and selectivity. In this assay, we transfect cells with two DNA cassettes. The first one comprises a bidirectional Tet RE (TRE) promoter controlling the cDNA of a TF input (Senkel et al., 2005) and an mCherry fluorescent reporter in a doxycycline (Dox)-dependent fashion, such that mCherry fluorescence can be used as a proxy for TF concentration. The second cassette (sensor) contains a TF binding site or sites cloned in front of a low-leakage minimal mammalian promoter (Hansen et al., 2014), driving an AmCyan fluorescent reporter. mCherry-AmCyan reporter pair allows indirect assessment of the input-output relationship between a TF and the regulated gene product (Kim and O’Shea, 2008, Rosenfeld et al., 2005). Initially, the inputs comprised liver-enriched hepatocyte nuclear factors (HNFs) HNF1A, HNF1B (Odom et al., 2004), and HNF4A (Dean et al., 2010) and developmental regulators SOX9 (Kadaja et al., 2014) and SOX10 (Zhou et al., 2014). We constructed panels of six REs for HNF1A/B (Senkel et al., 2005, Tronche et al., 1997), three REs for HNF4A (Fang et al., 2012), and seven REs for SOX9/10 (Peirano and Wegner, 2000), with elements differing in the number of binding site repeats, their sequence, and their spacing (Figure 1B). We use HEK293 Tet-On (HEK Tet-On) cells that do not express these factors endogenously (Kikuchi et al., 2007, Küspert et al., 2012, Lucas et al., 2005, Wissmüller et al., 2006) but enable their Dox-dependent ectopic induction.
Figure 1.

Characterization of Open-Loop Transcriptional Sensors
(A) Schematics of a sensor screening assay in HEK Tet-On cells. TATA indicates a core minimal promoter. DNA constructs and protein products are shown. Pointed arrow indicates transactivation.
(B) Schematics of the HNF1A/B, HNF4A, and SOX9/10 sensors. The sequences of 1× REs and a spacer (sp) are shown. Only top strands are shown for HNF1A/B and HNF4A.
(C) TF sensor population-averaged responses in HEK Tet-On cells in the presence and absence of Dox, as indicated, and in the HuH-7 cell line. Each bar represents mean ± SD of biological triplicates.
(D) Mutual crosstalk between the TFs (y axis) and sensors (x axis). The color code indicates averaged AmCyan intensity.
rtTA, reverse tetracycline-responsive transcriptional activator; CMV, cytomegalovirus promoter; TetOn, HEK293 Tet-On cells.
Population-averaged “off” responses (Figure 1C) with zero Dox confirm the lack of endogenous expression of all five factors in HEK Tet-On cells. The “on” values (saturated Dox) obtained with different REs uncover diverse behaviors of the cognate TFs. HNFs exhibit sublinear (Zhang and Andersen, 2007) dependency, whereby doubling the number of binding sites results in a less than double output increase. HNF1A is stronger than HNF1B, consistent with earlier observations (Kitanaka et al., 2007). However, the SOX factors show superlinear activation, with output-level fold change surpassing the binding site number fold change. This suggests synergy between TFs bound to individual sites (Perez-Pinera et al., 2013, Smith et al., 2013). The data also support previous in vitro observations in favor of two high-affinity sites, C-C (Peirano and Wegner, 2000), and confirm the importance of cooperative SOX9 and SOX10 dimerization, judging from the low response of monomer-binding C-inverted C (C-Cinv) RE. To test sensors’ response to physiological TF level, we transfected them into a HuH-7 liver cancer cell line that expresses HNF1A/B, HNF4A, and SOX9/10 (Figure 1C). The activity of various REs in this context recapitulates to some extent the behavior in HEK Tet-On cells, with the best responders in HEK cells remaining the best responders in HuH-7 cells (apart from a change in ranking with HNF4A). However, quantitatively, the responses do not correlate well between the two cell types, likely due to additional modulating interactions between TF inputs and cell background in HuH-7. In particular, the SOX9/10 3× C-C site works better in HuH-7 cells compared to 3× C-C′, while its relative advantage in HEK Tet-On cells is only 2-fold. Members of the SOX-E group (SOX8, SOX9, and SOX10) share sequence homology in the DNA binding domain (Wegner, 2010), and this difference in response may be ascribed to sensor interaction with other members of the group in HuH-7 cells. Finally, we evaluated mutual cross-activation in this library of transcription factors and response elements in HEK Tet-On cells. The resulting matrix (Figure 1D) is consistent with the expectation, showing only the expected cross-reactivity between TFs with homologous DNA binding domains.
Flow cytometry data in transient transfection can be binned and averaged by the input (mCherry) intensity to build the transfer curve that shows the relationship between the TF level inferred from the mCherry reporter and the output AmCyan (Bleris et al., 2011). The curves measured with the same TFs have similar shape after normalization (Figure S1A). A simple model (Supplemental Experimental Procedures) predicts that the curve can be quadratic at low and linear at high TF/mCherry levels (Equation 1):
| (1) |
However, only HNF4A and HNF1A fit this prediction. HNF1B, SOX9, and SOX10 exhibit increasing deviations that are well described by a saturating rational function (Equation 2):
| (2) |
Accordingly, the observed behavior is a superposition of the responses described by Equations 1 and 2 (Figure S1B). In a cotransfection, dependency (Equation 2) is characteristic of an incoherent feedforward regulation (Bleris et al., 2011), and we speculate that TFs with the highest deviation might also act as negative regulators of their output by either repression or steric hindrance of the compact promoter region (Cruz-Solis et al., 2009). The transfer curve shape provides information on reporter response to different TF levels, and its deviation from a simple prediction can justify further mechanistic studies.
Signal Amplification using Positive Feedback
The sensors we characterized earlier are simple open-loop systems in which the signal propagates sequentially. They generate low absolute output levels that might not suffice to transduce a TF signal into robust downstream actuation. A positive feedback, whereby the output positively regulates its own expression, can amplify the output relative to the open-loop scenario (Acar et al., 2005, Ajo-Franklin et al., 2007, Alon, 2007, Becskei et al., 2001, Enciso and Sontag, 2005, Tan et al., 2009), with the caveat that weak output leakage in the absence of an input can self-amplify and lead to output saturation. Because our output is a fluorescent protein, we had to couple its expression to a transcriptional transactivator we call an amplifier activator to establish the feedback. We attempted to reduce autoinduction using low-leakage REs in combination with a low-leakage minimal promoter and low-leakage, shallow dose-response DNA regulatory elements for the amplifier activator. The open-loop sensors satisfied the first requirement; for the amplifier activator, we chose the pristinamycin I-dependent transactivator (PIT)2/pristinamycin I-repressible promoter (PIR) system (Fussenegger et al., 2000) with reduced sensitivity to small amounts of activator (Prochazka et al., 2014). In summary, we established the positive feedback by cloning a 2A linker and PIT2 transactivator downstream of the AmCyan reporter and a PIT2 DNA binding site (PIR) upstream of the TF RE (Figure 2A).
Figure 2.

Initial Characterization of TF Sensors with Positive Feedback
(A) Schematics of a feedback-amplified TF sensor.
(B) Induction levels measured in HEK Tet-On cells and in HuH-7 cells compared to their open-loop counterparts (values reproduced from Figure 1). TF and cell line names are indicated. Open-loop and amplified sensor outputs are directly comparable, but the amplified output signal is underestimated by a factor of five due to the 2A sequence (Figure S3B). FB, feedback; TetOn, HEK293 Tet-On cells. Each bar represents mean ± SD of biological triplicates.
(C) Crosstalk between the feedback-amplified sensors and different input TFs.
We first characterized feedback-amplified sensors in the HEK Tet-On assay (Figure 2B). The absence of a TF cassette (TFNEG) was required to faithfully represent the off state because of TRE promoter leakage in the absence of Dox (Dox−). The induction ratios against the TFNEG background range from 10 to 700 (Figure S2C; Table S1). Sensor performance depends on the TF input and the RE sequence, with the strongest leakage in the off state and the lowest on-to-off ratio observed with 1× REs, in which the PIR is closest to the TATA box. This ratio increases as the PIR site is pushed farther away, reaching about 350-fold on average in feedback-amplified sensors with ≥3× REs. Likewise, the amplified sensors respond strongly to endogenous TF inputs in HuH-7 cells (Figure 2B). The amplification relative to the open-loop sensors and the absolute induced levels vary between TFs and cell lines. As an illustration, the 3× C-C SOX10 amplified sensor shows comparable response in Huh-7 and HEK Tet-On cells, while its open-loop version responds more strongly in HuH-7 cells relative to HEK Tet-On cells. In HuH-7 cells, all HNF1A/B amplified sensors behave similarly, but this is not so in HEK Tet-On cells.
We next evaluated the mutual orthogonality of the amplified sensors. The resulting matrix (Figure 2C) shows crosstalk between the HNF1A/B TFs and the amplified HNF4A sensor that was not observed with the open-loop sensors. The DNA binding domains of the two TFs are highly divergent, and members of the HNF1 family are unable to bind to HNF4A RE. However, it has been shown that some tissues exhibit HNF1-dependent HNF4A expression (Boj et al., 2001, Thomas et al., 2001) and that ectopic expression of HNF1A/B in an HNF4A-negative cell line (3T3) induces an HNF4A isoform from a distal promoter (Briançon et al., 2004).
Mechanistic Dissection of Feedback Amplifiers
The amplified and open-loop sensor outputs correlate in HEK Tet-On cells (Figure 2). This is contrary to an intuitive expectation that the induced levels would be identical when the same sensor is triggered by different TF inputs due to the autocatalytic positive feedback. In an attempt to explain these observations, we mutated PIT2 to eliminate the feedback loop (Figures S3A and S3B) and measured the response of the composite promoters driving the output to different combinations of the ectopic TF and the amplifier activator (Figures 3A and 3B; Figure S3C). In most cases, the ectopic TF input or the amplifier activator alone triggers low response. A stronger synergistic activation, up to 50-fold higher than expected from adding individual contributions, was measured when both TF and amplifier activator were present (Figure 3C). The 3-fold synergy on a composite promoter comprising activating transcription factor and upstream activating sequence binding sites in HeLa cell extracts (Lin et al., 1990) and synergies on natural promoters (Smith et al., 2013) were previously reported, but the magnitude of the effects here surpasses earlier observations, leading to a high-performance AND gate between the amplifier activator and the TF input.
Figure 3.

Characterization of the Composite Promoters
(A) Experimental layout. Both the ectopic mammalian TF and the amplifier activator are induced with Dox. Different combinations of transcriptional inputs are achieved by withholding either the TF- or the amplifier activator-expressing cassette.
(B) Schematics of different transcriptionally active complexes. DBD, DNA binding domain; AD, activation domain.
(C) Expression levels reached with either or both transcriptional inputs provided to the promoter, as indicated. Different REs are compared.
(D) Effect on synergy of swapping the DBD of the amplifier activator from PIT to ET for three REs of HNF4A.
(E) Effect on synergy of replacing the TF input and its RE without changing the amplifier activator ET-VP16.
(F) Effect on synergy of swapping the minimal promoter from the minimal TATA box to CMVMIN.
(G) Comparison between feedback-amplified sensors harboring a minimal TATA box (top) and those harboring CMVMIN (bottom) with and without the TF input. 1×, 2×, and 3× HNF1A/B REs are compared.
In all panels, each bar represents mean ± SD of biological triplicates.
We further dissected this phenomenon by varying different components of the composite promoter and/or the activator species. We replaced the transactivating domain RelA of PIT2 (otherwise denoted PIT-RelA) with VP16 (Figure S3D), the PIT DNA binding domain with the erythromycin (ET) binding domain (Weber et al., 2002) (Figures 3D and 3E), and the minimal promoter sequence with a minimal cytomegalovirus promoter (CMVMIN) (Figure 3F). Replacing the transactivating domain improved the synergy due to a reduced efficiency of PIT-VP16 alone at longer distances from the TATA box. Synergy was not affected when we swapped the amplifier activator and the corresponding DNA binding domain, pointing to the general nature of the synergistic activation and the possibility to use multiple amplifier activators in parallel. However, replacing the minimal TATA box with CMVMIN reduced synergy dramatically due to increase in the induction by the amplifier activator alone. CMVMIN also had a large detrimental effect on the amplified sensors, which are almost fully induced even in the absence of a TF input (Figure 3G). With a minimal TATA box, the synergy was confirmed in two additional cell lines, HeLa and HCT-116 (Figure S3E).
The induction by PIT2 alone decreases with distance between the PIR and the TATA box. The magnitude of PIT2-only induction also depends on the downstream TF REs (Figure 4A). Promoters with HNF REs behave similarly, while promoters with SOX9/10 REs generate somewhat higher expression. We did not find obvious sequence features that could explain this difference. With CMVMIN, the PIT2-only induction is higher (Figure 4A, inset). One explanation is the binding of cryptic endogenous TFs to either the REs or the minimal promoters. Spurious binding can be estimated from the leakage of the feedback-amplified sensors in the absence of their cognate TFs. However, there is no correlation between this leakage and PIT2-only induction (Figure S4A, top) in sensors furnished with the minimal TATA box, suggesting that the intervening sequence affects PIT2 transactivation potential. However, clear correlation exists between leakage from amplified sensors and PIT2 induction from composite promoters furnished with CMVMIN (Figure S4A, bottom), strengthening the hypothesis that there is spurious binding to CMVMIN acting as a hidden input to the otherwise synergistic regulatory sequences. This is supported by independent evidence of CMVMIN leakiness (Prochazka et al., 2014).
Figure 4.

Analysis of Synergy Data
Synergy is calculated as a ratio of the expression in the presence of both TF and amplifier activator, divided by the sum of expression with TF only and amplifier activator only. To increase accuracy, TF-only data from Figure 1 is used for calculations (Supplemental Experimental Procedures).
(A) Transactivating efficiency of PIT-RelA amplifier activator as a function of PIR distance from the TATA box. The intervening RE for the endogenous TF input coupled to the low-leakage promoter (color coded) and the sequence of a minimal promoter (minimal TATA box versus CMVMIN, inset) are compared.
(B) Fully induced expression levels from a composite promoter achieved by providing the ectopic TF input and PIT-RelA, as a function of PIR distance from the TATA box.
(C) Synergy scores for different composite promoters with PIT-RelA as amplifier activator, as a function of PIR distance from the TATA box.
(D) Schematics of the synergistic positive-feedback amplifier.
(E and F) Simulated (E) and experimental (F) responses of open- and feedback-amplified sensors to varying TF input. Comparison to an amplified loop without synergy is shown.
(G) Simulated open-loop and amplified response dependency on the binding affinity of the TF input.
(H) Simulated relationship between open- and amplified-loop responses.
(I) Experimental correlation between open- and closed-loop responses for HNF1A/B and SOX9/10 constructs in HEK Tet-On cells.
(J) Simulated off and on responses of feedback-amplified loops as a function of synergy (left) and on-to-off ratio as a function of synergy (right).
(K) Experimental on-to-off ratio of feedback-amplified sensors as a function of synergy (black dots). The straight line is a linear fit forced through zero.
In (A), (B), and (F), error bars represent SD of biological triplicates.
Synergized output expression triggered by the combined action of PIT2 and TF input is roughly constant for HNF1A, HNF1B, and SOX10. For HNF4A, however, synergized expression declines with distance, similar to PIT2-only induction (Figure 4B). Replacing RelA with the VP16 transactivation domain preserves the trends but not the absolute values. Activation strength by PIT-VP16 alone is reduced about 10-fold relative to PIT-RelA at short distances (Figure S4B). However, in a synergistic induction, most of this loss is recovered, reaching between 25% and 77% of the PIT-RelA values (Figure S4C). Therefore, the absolute synergy levels are in general higher when PIT-VP16 is used (Figure S4D). The exact dependency of synergy on distance varies between TF inputs (Figure 4C), but all constructs share substantial synergy.
High synergy in feedback-amplified sensors creates a regulatory motif, in which positive feedback is integrated in an AND-like gate with the external TF input (Figure 4D). We built a mechanistic model of this motif (Figure S4E; Supplemental Experimental Procedures). The simulation shows that the open-loop and the synergistic feedback sensors respond gradually to increasing input, while a sensor without synergy generates a fully induced response to non-zero inputs (Figure 4E; Figure S4F). This agrees with the responses of open-loop and amplified HNF1A sensors in HEK Tet-On cells to Dox-modulated HNF1A input. Both increase proportionally to the input while maintaining a constant amplification ratio (Figure 4F). However, an amplified sensor without synergy generates constant output (Figure 4F). The simulation also predicts strong correlation between the output in the open and that in the amplified synergistic loops (Figures 4G and 4H), in agreement with observations (Figure 4I). The output of the amplified sensor remains proportional to the output of the open-loop sensor, with the important practical implication that the amplified sensor is no longer a bistable on-off switch (as is the case in feedback loops without synergy). Instead, it is a proportional signal amplifier, multiplying input signal intensity by a constant value over a range of inputs. Lastly, the model predicts a proportional, if non-linear, relationship between the composite promoter synergy and the dynamic range of the amplified sensor, with the off state being most sensitive to synergy (Figure 4J). Experimental data (Figure 4K) agree qualitatively with this prediction.
Forward Sensor Design
The simulations and the experimental data reported earlier enable rational design and optimization of low-leakage feedback amplifiers. The empirical linear fit of the dataset in Figure 4K is or . This means that a synergy score of five or more will result in a satisfactory on-to-off ratio of the amplified sensor (∼16), while scores > 10 will enable excellent induction of ∼50. Thus, the task of designing an amplified sensor is reduced to finding the composite promoter of appropriate synergy. The data in Figures 3 and 4 suggest that although specific trends vary among TFs, it is possible to achieve sufficient synergy either by modulating the length of the RE and the distance between the TATA box and the amplifier activator biding site or by altering the transactivating domain of the amplifier activator. For new sensors, this dependency of synergy on distance should be mapped using two to three composite promoters that differ in the number of TF REs; the latter can be obtained from experimental probability weight matrixes (Jolma et al., 2013) and available literature. These promoters are evaluated under three conditions, AA−/TF+, AA+/TF−, and AA+/TF+, resulting in nine distinct measurements. A promoter with the highest synergy can then be used in an amplified sensor. We tested this approach with three additional transcription activators: TCF/LEF family, downstream effectors of the Wnt pathway (Buckley et al., 2015, Veeman et al., 2003), the hypoxia inducible factor HIF1A (Schödel et al., 2011), and calcium-sensitive NFATC1 (Fiering et al., 1990). TCF/LEF and HIF1 are expressed in HEK Tet-On cells but are only activated in response to their respective pathways’ ligands (LiCl activating the Wnt pathways and CoCl2 mimicking the hypoxic state), while NFATC1 is not expressed in HEK Tet-On. Accordingly, we relied on pathway activation to induce TCF/LEF and HIF1 and used a combination of cDNA of the calcium-sensitive NFATC1 mutant (CA-NFATC1) and calcium influx (stimulated by ionomycin) for NFATC1 induction. The composite promoter’s behavior shows the requisite synergy levels (Figure 5A–5D), and all amplified sensors behave satisfactorily, better than expected from the preceding empirical dependency (Figure 5E). Promoter mapping is useful for uncovering trends, yet as a rule, sensors for which the RE pushes the amplifier activator about 110 bp away from the TATA box show a combination of high induction in the on state and a high on-to-off ratio (Figures 2, 5, and S2C); if time is of the essence, then only one structure with 3× or 4× RE repeats and a corresponding separation of 100–130 bp can be tested.
Figure 5.

Forward Sensor Engineering
(A–C) For each TF, we show the response of the composite promoter in open-loop configuration (top) and the response of the corresponding feedback loops (middle) and then compare the distance dependency of PIT-RelA transactivation with the synergized expression (bottom). The cofactors used for induction are indicated. For NFATC1, induction means expression of the TF cDNA combined with ionomycin.
(D) Synergy for the composite promoters tested in this panel as a function of PIR distance from the TATA box.
(E) On-to-off ratio as a function of synergy for this dataset (red), overlaid on Figure 4K data (gray).
In (A)–(D), error bars represent SD of biological triplicates.
The preceding workflow requires that the TF be inactive in the ground off state. Although cell lines such as HEK Tet-On naturally lack either expression or activity of certain TFs, establishing a clean ground off state in the most general case might require a homozygous deletion of the gene encoding the TF of interest. In addition, it requires the ability to turn on the TF in a controlled fashion by ectopic expression using cDNA, a cofactor as an “on” switch, or both. This ability can be compromised when a crucial cofactor is unknown.
Synergistic Promoter Enables Transcriptional Logic
To further decipher the AND-like behavior of the synergistic composite promoters, we mapped their response to gradual changes in the transcriptional inputs. The ectopic TFs were tuned with Dox via the TRE promoter, while the amplifying activators PIT-RelA and ET-VP16 were expressed from constitutive promoters and modulated with the antibiotics pristinamycin (PI) and erythromycin (ET), respectively. As expected, the responses fit Dox AND NOT (antibiotic) logic between the small molecule inputs, consistent with the underlying ectopic TF AND amplifier activator promoter logic (Figure 6A). The AND-gate promoters can be used to build AND gates between pairs of unrelated mammalian TFs, with one controlling the amplifier activator and the other controlling its cognate RE directly (Figure 6B). We tested this circuitry in HEK Tet-On cells by either adding or withholding plasmids expressing the TFs of interest. The gate HNF1A AND SOX10, using PIT-RelA as the amplifier activator, generates the worst-case on-to-off ratio of ∼16 (Figure 6C). The HNF4A AND SOX10 gate with PIT-RelA gives the worst-case on-to-off ratio of ∼5. However, replacing PIT-RelA with PIT-VP16 increases the on-to-off ratio to ∼40-fold, consistent with the higher synergy expected from PIT-VP16 (Figure 6D). The AND-gate behavior observed in HEK Tet-On cells can also be exploited for identifying simultaneous expression of endogenous TFs. The HNF1A/B AND SOX9/10 gate was applied to a panel of cell lines including HuH-7, HCT-116, HEK293, and HeLa. In this panel, only HuH-7 cells express both factors, and HuH-7 is the only cell line that strongly activates reporter expression (Figure 6E).
Figure 6.

AND Logic on the Composite Promoter
(A) Experimental setup for independent input modulation and the logic circuit abstraction of this setup (left). Promoter response as a function of varying levels of the TF and the amplifier activator inputs (right). Abx, antibiotic; PI, pristinamycin; ET, erythromycin.
(B) Schematics of an AND gate between two ectopic transcriptional inputs.
(C) AND gate between SOX10 and HNF1A.
(D) AND gate between HNF4A and SOX10. Left, the gate that used PIT-RelA. Right, the same gate employing PIT-VP16.
(E) AND gate between HNF1A/B and SOX9/10 discriminates between cell lines using endogenous levels of TF inputs. The bar chart shows AmCyan output levels in different cell lines (each bar represents mean ± SD of biological triplicates), and the micrographs show the expression of transfection marker mCherry (red) and the AmCyan output (green). Scale bars, 100 μm.
Amplified Sensors as Transducers of Biological Activity
Having established selective and strong output activation by endogenous TFs, we attempted to transduce it to other types of biological activity. First, we tested the ability of the open-loop and the amplified sensors to induce a synthetic miRNA miR-FF4 and knock down gene expression in response to endogenous HNF1A/B in Huh-7 cells (Figure S5A). Knockdown efficiency elicited by the open-loop sensor was only ∼3.5-fold (Figure S5B), improving somewhat with an amplified sensor (Figure S5C). The improvement was smaller than the concomitant increase in the AmCyan and miR-FF4 levels, consistent with earlier observations on RNAi knockdown kinetics in the case of simultaneous miRNA and target expression from transfected constructs (Lapique and Benenson, 2014). Briefly, the miRNA target protein commences expression immediately and builds up high background levels during the time it takes to accumulate sufficient miRNA to elicit efficient knockdown. With feedback amplification, the delay between transfection and miRNA accumulation is expected to be even longer. We employed the internal desynchronization method using a Cre recombinase inversion of the output described earlier (Lapique and Benenson, 2014) and, as expected, observed a robust knockdown of about 20-fold of downstream target (Figures 7A and 7B).
Figure 7.

Transduction of Transcriptional Activity into Various Downstream Processes
(A) Multipronged actuation combining downstream RNAi with transactivation, including a low-leakage RNAi target with recombinase delay and a transactivation target, PIR-driven mCitrine.
(B) The improvement in RNAi knockdown with the delayed switch, comparing between on and off mCherry readouts in the delayed and standard configurations (top) and flow cytometry plots (bottom).
(C) The outputs generated by the multipronged sensor in three cell lines triggered by the endogenous HNF1A/B activation. The rows show representative images of AmCyan (cyan), Citrine (yellow), and mCherry (red). Transfection marker infrared fluorescent protein (iRFP; purple) is in a separate row. Scale bars, 100 μm. Note the low transfection efficiency in HeLa cells.
(D) Schematics of TF-driven, feedback-amplified expression of Cre recombinase.
(E) Response of two amplified Cre sensors to ectopic induction of their respective cognate TF (HNF1A and SOX10) (left) and corresponding flow cytometry plots (right).
(F) Endogenous TF-driven, recombinase-triggered gene inversion in three cell lines. The figure shows the response of the sensor for HNF1A/B (top) and SOX9/10 (bottom). Representative images are shown. The Citrine signal (yellow) is represented over the corresponding image for the iRFP transfection marker (purple). Scale bars, 100 μm. HeLa cell images have higher background when similar settings are applied to all images in this panel.
In (B), (C), (E), and (F), each bar represents mean ± SD of biological triplicates.
The amplifier activator can be used to transactivate additional genes via suitable promoter; combined with miRNA expression, this enables simultaneous and anticorrelated control of two or more genes conditioned upon a single transcriptional trigger (Figure S6). To illustrate this, we constructed a PIRTIGHT-controlled (Hansen et al., 2014) mCitrine cassette and combined it with the amplified HNF1A/B sensor and miR-FF4 targeted mCherry gene. The circuit was tested using HuH-7 as a HNF1A/B-positive cell and HEK293 and HeLa as HNF1A/B-negative cells. We find that all outputs behave as expected, with Cyan and Citrine highly expressed in HuH-7 cells and mCherry high in HEK293 and HeLa cells (Figure 7C). The fold change is between two and three orders of magnitude, with the best case as 320-fold AmCyan induction in HuH-7 versus HEK293 and the worst case as a 20-fold difference in Citrine between HuH-7 and HEK293 cells.
Another common application of sensor systems is irreversible cell marking using site-specific recombination. We substituted AmCyan with a Cre recombinase (Figure 7D) to evaluate this scenario, testing amplified sensors for both HNF1A and SOX10 (Figure 7E). We observe highly specific TF-dependent recombination resulting in a 10- to 25-fold Citrine induction in the HEK Tet-On assay and up to 100-fold selectivity in Huh-7, with endogenous transcriptional inputs with virtually zero leakage in the TF-negative cells (Figure 7F).
Discussion
Our study establishes a methodology for using endogenous TFs as input signals to artificial gene circuits in mammalian cells. The assay based on ectopic coexpression of the transcriptional input of interest, together with a fluorescent protein, provides an information-rich platform that can be used both for bulk comparison of different REs and for their in-depth characterization using binned response curves. In particular, the latter can point to deviations of measured behavior from simple mechanistic models and justify further studies. The assay can likewise be used to validate observations made in natural contexts or in vitro and to deconvolve complex behaviors by isolating the effects originating from putative interaction partners. Use of amplified sensors on a neutral background is a sensitive detector of direct and indirect crosstalk that is otherwise missed in open-loop sensors. The extension of this assay can encompass application-specific cell types (such as induced pluripotent stem cells (iPSCs)), in which the TF of interest is deleted genetically, preserving the rest of the cell background relevant to this application. However, cofactors can be studied quantitatively in a cell line such as HEK Tet-On by inducible ectopic expression of the cofactors, together with the studied TF. In summary, our assay can complement other approaches (Dean et al., 2010, Olson et al., 2014, Patwardhan et al., 2012, Peirano and Wegner, 2000, Sharon et al., 2012) by providing complete control over the TF input, its cofactors, and the structure of the RE.
We further establish a robust, programmable, modular tool for transcriptional signal amplification, with the help of the AND-gate positive-feedback sensor. Although synergies between transcriptional inputs on promoters have been observed previously, we reach very high levels that justify the interpretation of the behavior as a logic AND gate. Combining high synergy with positive feedback generates a proportional signal amplifier, unlike previously described binary switches. We show that the induction ratio of the amplified sensor is proportional to the synergy levels on the promoter. We suggest a workflow to tune the ratio based on systematic dissection of different parameters and apply it successfully to three additional TFs. The AND-gate promoter also leads to two-input AND gates between pairs of unrelated transcriptional inputs with high on-to-off ratios. We were able to improve the performance of these gates using our design rules.
Most constructs and functionalities are confirmed in the HuH-7 cell line with physiological input levels. The amplified sensors were able to trigger efficient multipronged biological actuation in the form of RNAi, transactivation, and site-specific recombination. These sensing and transduction capabilities fill the missing link between endogenous transcriptional activities and previously established strategies to implement transcriptional logic (Hansen et al., 2014, Khalil et al., 2012, Leisner et al., 2010, Ran et al., 2012), and they will facilitate construction of logic circuits of increasing complexity. Logic gates between arbitrary TFs could enable specific cell targeting based on complex transcriptional profiles, further contributing to the ongoing effort toward improving tissue- and lineage-specific transgene expression in mammalian cells, with applications in basic research (Halpern et al., 2008) and gene therapy (Busskamp et al., 2010). Given the central role of TFs in cell fate determination and in development, one can further envision complex autonomous sense-and-respond circuits that monitor and control cell fate in diverse scenarios such as stem cell therapy, artificial developmental schemes, and tissue engineering and regeneration.
Experimental Procedures
For details, see Supplemental Experimental Procedures. Briefly, plasmids were constructed using standard restriction-ligation cloning. cDNA of mammalian TFs was obtained from the Integrated Molecular Analysis of Genomes and their Expression (IMAGE) Consortium. All plasmids were purified with an endotoxin removal kit (Norgen) before transfection. Cell lines were obtained commercially and cultured using recommended media for up to 2 months. Transfections were done using Lipofectamine 2000 (Life Technologies) according to guidelines. Transfection setup and the scale for each panel are reported in Table S4. Microscopy images were taken ∼48 hr post-transfection using a Nikon Eclipse Ti inverted microscope. Appropriate filter combinations were used to image different fluorescent proteins. Flow cytometry measurements were performed ∼48 hr post-transfection on a BD Biosciences LSRFortessa II cell analyzer. Photomultiplier tube (PMT) voltage in the AmCyan channel was different between open-loop and feedback sensors, and a conversion factor was calculated to bring the readouts to the same scale (Figures S2A and S2B). Data analysis for bar charts was performed with FlowJo software. The model was built with SimBiology and binning, and data fitting was done with MATLAB.
Author Contributions
B.A. conceived the project, performed most experiments, analyzed the data, and wrote the paper. E.M. and B.H. performed some experiments. Y.B. conceived the project, analyzed the data, wrote the paper, and supervised the project.
Acknowledgments
The research was funded by ERC StG 281490 (CellControl). We thank T. Horn and V. Jaeggin for help with flow cytometry, Y.B. lab members for discussions, and the M. Fussenegger lab for PIT2 and ET constructs.
Published: August 18, 2016
Footnotes
Supplemental Information includes Supplemental Experimental Procedures, six figures, and four tables and can be found with this article online at http://dx.doi.org/10.1016/j.celrep.2016.07.061.
Supplemental Information
DNA amounts and plasmid setup used for each experiment.
References
- Acar M., Becskei A., van Oudenaarden A. Enhancement of cellular memory by reducing stochastic transitions. Nature. 2005;435:228–232. doi: 10.1038/nature03524. [DOI] [PubMed] [Google Scholar]
- Ajo-Franklin C.M., Drubin D.A., Eskin J.A., Gee E.P.S., Landgraf D., Phillips I., Silver P.A. Rational design of memory in eukaryotic cells. Genes Dev. 2007;21:2271–2276. doi: 10.1101/gad.1586107. [DOI] [PMC free article] [PubMed] [Google Scholar]
- Alon U. Network motifs: theory and experimental approaches. Nat. Rev. Genet. 2007;8:450–461. doi: 10.1038/nrg2102. [DOI] [PubMed] [Google Scholar]
- Amit R., Garcia H.G., Phillips R., Fraser S.E. Building enhancers from the ground up: a synthetic biology approach. Cell. 2011;146:105–118. doi: 10.1016/j.cell.2011.06.024. [DOI] [PMC free article] [PubMed] [Google Scholar]
- Ausländer S., Ausländer D., Müller M., Wieland M., Fussenegger M. Programmable single-cell mammalian biocomputers. Nature. 2012;487:123–127. doi: 10.1038/nature11149. [DOI] [PubMed] [Google Scholar]
- Ausländer D., Ausländer S., Charpin-El Hamri G., Sedlmayer F., Müller M., Frey O., Hierlemann A., Stelling J., Fussenegger M. A synthetic multifunctional mammalian pH sensor and CO2 transgene-control device. Mol. Cell. 2014;55:397–408. doi: 10.1016/j.molcel.2014.06.007. [DOI] [PubMed] [Google Scholar]
- Becskei A., Séraphin B., Serrano L. Positive feedback in eukaryotic gene networks: cell differentiation by graded to binary response conversion. EMBO J. 2001;20:2528–2535. doi: 10.1093/emboj/20.10.2528. [DOI] [PMC free article] [PubMed] [Google Scholar]
- Benenson Y. Biomolecular computing systems: principles, progress and potential. Nat. Rev. Genet. 2012;13:455–468. doi: 10.1038/nrg3197. [DOI] [PubMed] [Google Scholar]
- Bleris L., Xie Z., Glass D., Adadey A., Sontag E., Benenson Y. Synthetic incoherent feedforward circuits show adaptation to the amount of their genetic template. Mol. Syst. Biol. 2011;7:519. doi: 10.1038/msb.2011.49. [DOI] [PMC free article] [PubMed] [Google Scholar]
- Boj S.F., Parrizas M., Maestro M.A., Ferrer J. A transcription factor regulatory circuit in differentiated pancreatic cells. Proc. Natl. Acad. Sci. USA. 2001;98:14481–14486. doi: 10.1073/pnas.241349398. [DOI] [PMC free article] [PubMed] [Google Scholar]
- Briançon N., Bailly A., Clotman F., Jacquemin P., Lemaigre F.P., Weiss M.C. Expression of the alpha7 isoform of hepatocyte nuclear factor (HNF) 4 is activated by HNF6/OC-2 and HNF1 and repressed by HNF4alpha1 in the liver. J. Biol. Chem. 2004;279:33398–33408. doi: 10.1074/jbc.M405312200. [DOI] [PubMed] [Google Scholar]
- Buckley S.M., Delhove J.M., Perocheau D.P., Karda R., Rahim A.A., Howe S.J., Ward N.J., Birrell M.A., Belvisi M.G., Arbuthnot P. In vivo bioimaging with tissue-specific transcription factor activated luciferase reporters. Sci. Rep. 2015;5:11842. doi: 10.1038/srep11842. [DOI] [PMC free article] [PubMed] [Google Scholar]
- Busskamp V., Duebel J., Balya D., Fradot M., Viney T.J., Siegert S., Groner A.C., Cabuy E., Forster V., Seeliger M. Genetic reactivation of cone photoreceptors restores visual responses in retinitis pigmentosa. Science. 2010;329:413–417. doi: 10.1126/science.1190897. [DOI] [PubMed] [Google Scholar]
- Cruz-Solis I., Zepeda R.C., Ortiz S., Aguilera J., López-Bayghen E., Ortega A. Glutamate-dependent transcriptional control in Bergmann glia: Sox10 as a repressor. J. Neurochem. 2009;109:899–910. doi: 10.1111/j.1471-4159.2009.06017.x. [DOI] [PubMed] [Google Scholar]
- Culler S.J., Hoff K.G., Smolke C.D. Reprogramming cellular behavior with RNA controllers responsive to endogenous proteins. Science. 2010;330:1251–1255. doi: 10.1126/science.1192128. [DOI] [PMC free article] [PubMed] [Google Scholar]
- Dean S., Tang J.I., Seckl J.R., Nyirenda M.J. Developmental and tissue-specific regulation of hepatocyte nuclear factor 4-alpha (HNF4-alpha) isoforms in rodents. Gene Expr. 2010;14:337–344. doi: 10.3727/105221610x12717040569901. [DOI] [PMC free article] [PubMed] [Google Scholar]
- Deans T.L., Cantor C.R., Collins J.J. A tunable genetic switch based on RNAi and repressor proteins for regulating gene expression in mammalian cells. Cell. 2007;130:363–372. doi: 10.1016/j.cell.2007.05.045. [DOI] [PubMed] [Google Scholar]
- Elowitz M.B., Leibler S. A synthetic oscillatory network of transcriptional regulators. Nature. 2000;403:335–338. doi: 10.1038/35002125. [DOI] [PubMed] [Google Scholar]
- Enciso G., Sontag E.D. Monotone systems under positive feedback: multistability and a reduction theorem. Syst. Control Lett. 2005;54:159–168. [Google Scholar]
- Fang B., Mane-Padros D., Bolotin E., Jiang T., Sladek F.M. Identification of a binding motif specific to HNF4 by comparative analysis of multiple nuclear receptors. Nucleic Acids Res. 2012;40:5343–5356. doi: 10.1093/nar/gks190. [DOI] [PMC free article] [PubMed] [Google Scholar]
- Farzadfard F., Perli S.D., Lu T.K. Tunable and multifunctional eukaryotic transcription factors based on CRISPR/Cas. ACS Synth. Biol. 2013;2:604–613. doi: 10.1021/sb400081r. [DOI] [PMC free article] [PubMed] [Google Scholar]
- Fiering S., Northrop J.P., Nolan G.P., Mattila P.S., Crabtree G.R., Herzenberg L.A. Single cell assay of a transcription factor reveals a threshold in transcription activated by signals emanating from the T-cell antigen receptor. Genes Dev. 1990;4:1823–1834. doi: 10.1101/gad.4.10.1823. [DOI] [PubMed] [Google Scholar]
- Fire A., Xu S., Montgomery M.K., Kostas S.A., Driver S.E., Mello C.C. Potent and specific genetic interference by double-stranded RNA in Caenorhabditis elegans. Nature. 1998;391:806–811. doi: 10.1038/35888. [DOI] [PubMed] [Google Scholar]
- Friedland A.E., Lu T.K., Wang X., Shi D., Church G., Collins J.J. Synthetic gene networks that count. Science. 2009;324:1199–1202. doi: 10.1126/science.1172005. [DOI] [PMC free article] [PubMed] [Google Scholar]
- Fussenegger M., Morris R.P., Fux C., Rimann M., von Stockar B., Thompson C.J., Bailey J.E. Streptogramin-based gene regulation systems for mammalian cells. Nat. Biotechnol. 2000;18:1203–1208. doi: 10.1038/81208. [DOI] [PubMed] [Google Scholar]
- Gardner T.S., Cantor C.R., Collins J.J. Construction of a genetic toggle switch in Escherichia coli. Nature. 2000;403:339–342. doi: 10.1038/35002131. [DOI] [PubMed] [Google Scholar]
- Green A.A., Silver P.A., Collins J.J., Yin P. Toehold switches: de-novo-designed regulators of gene expression. Cell. 2014;159:925–939. doi: 10.1016/j.cell.2014.10.002. [DOI] [PMC free article] [PubMed] [Google Scholar]
- Halpern M.E., Rhee J., Goll M.G., Akitake C.M., Parsons M., Leach S.D. Gal4/UAS transgenic tools and their application to zebrafish. Zebrafish. 2008;5:97–110. doi: 10.1089/zeb.2008.0530. [DOI] [PMC free article] [PubMed] [Google Scholar]
- Hansen J., Mailand E., Swaminathan K.K., Schreiber J., Angelici B., Benenson Y. Transplantation of prokaryotic two-component signaling pathways into mammalian cells. Proc. Natl. Acad. Sci. USA. 2014;111:15705–15710. doi: 10.1073/pnas.1406482111. [DOI] [PMC free article] [PubMed] [Google Scholar]
- Hobert O. Gene regulation by transcription factors and microRNAs. Science. 2008;319:1785–1786. doi: 10.1126/science.1151651. [DOI] [PubMed] [Google Scholar]
- Janknecht R., Ernst W.H., Pingoud V., Nordheim A. Activation of ternary complex factor Elk-1 by MAP kinases. EMBO J. 1993;12:5097–5104. doi: 10.1002/j.1460-2075.1993.tb06204.x. [DOI] [PMC free article] [PubMed] [Google Scholar]
- Jolma A., Yan J., Whitington T., Toivonen J., Nitta K.R., Rastas P., Morgunova E., Enge M., Taipale M., Wei G. DNA-binding specificities of human transcription factors. Cell. 2013;152:327–339. doi: 10.1016/j.cell.2012.12.009. [DOI] [PubMed] [Google Scholar]
- Kadaja M., Keyes B.E., Lin M., Pasolli H.A., Genander M., Polak L., Stokes N., Zheng D., Fuchs E. SOX9: a stem cell transcriptional regulator of secreted niche signaling factors. Genes Dev. 2014;28:328–341. doi: 10.1101/gad.233247.113. [DOI] [PMC free article] [PubMed] [Google Scholar]
- Kadonaga J.T., Carner K.R., Masiarz F.R., Tjian R. Isolation of cDNA encoding transcription factor Sp1 and functional analysis of the DNA binding domain. Cell. 1987;51:1079–1090. doi: 10.1016/0092-8674(87)90594-0. [DOI] [PubMed] [Google Scholar]
- Khalil A.S., Lu T.K., Bashor C.J., Ramirez C.L., Pyenson N.C., Joung J.K., Collins J.J. A synthetic biology framework for programming eukaryotic transcription functions. Cell. 2012;150:647–658. doi: 10.1016/j.cell.2012.05.045. [DOI] [PMC free article] [PubMed] [Google Scholar]
- Kikuchi R., Kusuhara H., Hattori N., Kim I., Shiota K., Gonzalez F.J., Sugiyama Y. Regulation of tissue-specific expression of the human and mouse urate transporter 1 gene by hepatocyte nuclear factor 1 alpha/beta and DNA methylation. Mol. Pharmacol. 2007;72:1619–1625. doi: 10.1124/mol.107.039701. [DOI] [PubMed] [Google Scholar]
- Kim H.D., O’Shea E.K. A quantitative model of transcription factor-activated gene expression. Nat. Struct. Mol. Biol. 2008;15:1192–1198. doi: 10.1038/nsmb.1500. [DOI] [PMC free article] [PubMed] [Google Scholar]
- Kitanaka S., Sato U., Igarashi T. Regulation of human insulin, IGF-I, and multidrug resistance protein 2 promoter activity by hepatocyte nuclear factor (HNF)-1beta and HNF-1alpha and the abnormality of HNF-1beta mutants. J. Endocrinol. 2007;192:141–147. doi: 10.1677/joe.1.07003. [DOI] [PubMed] [Google Scholar]
- Kobayashi H., Kaern M., Araki M., Chung K., Gardner T.S., Cantor C.R., Collins J.J. Programmable cells: interfacing natural and engineered gene networks. Proc. Natl. Acad. Sci. USA. 2004;101:8414–8419. doi: 10.1073/pnas.0402940101. [DOI] [PMC free article] [PubMed] [Google Scholar]
- Küspert M., Weider M., Müller J., Hermans-Borgmeyer I., Meijer D., Wegner M. Desert hedgehog links transcription factor Sox10 to perineurial development. J. Neurosci. 2012;32:5472–5480. doi: 10.1523/JNEUROSCI.5759-11.2012. [DOI] [PMC free article] [PubMed] [Google Scholar]
- Lapique N., Benenson Y. Digital switching in a biosensor circuit via programmable timing of gene availability. Nat. Chem. Biol. 2014;10:1020–1027. doi: 10.1038/nchembio.1680. [DOI] [PMC free article] [PubMed] [Google Scholar]
- Leisner M., Bleris L., Lohmueller J., Xie Z., Benenson Y. Rationally designed logic integration of regulatory signals in mammalian cells. Nat. Nanotechnol. 2010;5:666–670. doi: 10.1038/nnano.2010.135. [DOI] [PMC free article] [PubMed] [Google Scholar]
- Li Y., Jiang Y., Chen H., Liao W., Li Z., Weiss R., Xie Z. Modular construction of mammalian gene circuits using TALE transcriptional repressors. Nat. Chem. Biol. 2015;11:207–213. doi: 10.1038/nchembio.1736. [DOI] [PMC free article] [PubMed] [Google Scholar]
- Lienert F., Torella J.P., Chen J.H., Norsworthy M., Richardson R.R., Silver P.A. Two- and three-input TALE-based AND logic computation in embryonic stem cells. Nucleic Acids Res. 2013;41:9967–9975. doi: 10.1093/nar/gkt758. [DOI] [PMC free article] [PubMed] [Google Scholar]
- Lin Y.S., Carey M., Ptashne M., Green M.R. How different eukaryotic transcriptional activators can cooperate promiscuously. Nature. 1990;345:359–361. doi: 10.1038/345359a0. [DOI] [PubMed] [Google Scholar]
- Lucas B., Grigo K., Erdmann S., Lausen J., Klein-Hitpass L., Ryffel G.U. HNF4alpha reduces proliferation of kidney cells and affects genes deregulated in renal cell carcinoma. Oncogene. 2005;24:6418–6431. doi: 10.1038/sj.onc.1208794. [DOI] [PubMed] [Google Scholar]
- Maeder M.L., Linder S.J., Reyon D., Angstman J.F., Fu Y., Sander J.D., Joung J.K. Robust, synergistic regulation of human gene expression using TALE activators. Nat. Methods. 2013;10:243–245. doi: 10.1038/nmeth.2366. [DOI] [PMC free article] [PubMed] [Google Scholar]
- McManus M.T., Sharp P.A. Gene silencing in mammals by small interfering RNAs. Nat. Rev. Genet. 2002;3:737–747. doi: 10.1038/nrg908. [DOI] [PubMed] [Google Scholar]
- Nissim L., Bar-Ziv R.H. A tunable dual-promoter integrator for targeting of cancer cells. Mol. Syst. Biol. 2010;6:444. doi: 10.1038/msb.2010.99. [DOI] [PMC free article] [PubMed] [Google Scholar]
- Odom D.T., Zizlsperger N., Gordon D.B., Bell G.W., Rinaldi N.J., Murray H.L., Volkert T.L., Schreiber J., Rolfe P.A., Gifford D.K. Control of pancreas and liver gene expression by HNF transcription factors. Science. 2004;303:1378–1381. doi: 10.1126/science.1089769. [DOI] [PMC free article] [PubMed] [Google Scholar]
- Olson E.J., Hartsough L.A., Landry B.P., Shroff R., Tabor J.J. Characterizing bacterial gene circuit dynamics with optically programmed gene expression signals. Nat. Methods. 2014;11:449–455. doi: 10.1038/nmeth.2884. [DOI] [PubMed] [Google Scholar]
- Park S.H., Zarrinpar A., Lim W.A. Rewiring MAP kinase pathways using alternative scaffold assembly mechanisms. Science. 2003;299:1061–1064. doi: 10.1126/science.1076979. [DOI] [PubMed] [Google Scholar]
- Patwardhan R.P., Hiatt J.B., Witten D.M., Kim M.J., Smith R.P., May D., Lee C., Andrie J.M., Lee S.I., Cooper G.M. Massively parallel functional dissection of mammalian enhancers in vivo. Nat. Biotechnol. 2012;30:265–270. doi: 10.1038/nbt.2136. [DOI] [PMC free article] [PubMed] [Google Scholar]
- Peirano R.I., Wegner M. The glial transcription factor Sox10 binds to DNA both as monomer and dimer with different functional consequences. Nucleic Acids Res. 2000;28:3047–3055. doi: 10.1093/nar/28.16.3047. [DOI] [PMC free article] [PubMed] [Google Scholar]
- Perez-Pinera P., Ousterout D.G., Brunger J.M., Farin A.M., Glass K.A., Guilak F., Crawford G.E., Hartemink A.J., Gersbach C.A. Synergistic and tunable human gene activation by combinations of synthetic transcription factors. Nat. Methods. 2013;10:239–242. doi: 10.1038/nmeth.2361. [DOI] [PMC free article] [PubMed] [Google Scholar]
- Prochazka L., Angelici B., Haefliger B., Benenson Y. Highly modular bow-tie gene circuits with programmable dynamic behaviour. Nat. Commun. 2014;5:4729. doi: 10.1038/ncomms5729. [DOI] [PMC free article] [PubMed] [Google Scholar]
- Ran T., Douek Y., Milo L., Shapiro E. A programmable NOR-based device for transcription profile analysis. Sci. Rep. 2012;2:641. doi: 10.1038/srep00641. [DOI] [PMC free article] [PubMed] [Google Scholar]
- Rinaudo K., Bleris L., Maddamsetti R., Subramanian S., Weiss R., Benenson Y. A universal RNAi-based logic evaluator that operates in mammalian cells. Nat. Biotechnol. 2007;25:795–801. doi: 10.1038/nbt1307. [DOI] [PubMed] [Google Scholar]
- Rosenfeld N., Young J.W., Alon U., Swain P.S., Elowitz M.B. Gene regulation at the single-cell level. Science. 2005;307:1962–1965. doi: 10.1126/science.1106914. [DOI] [PubMed] [Google Scholar]
- Schödel J., Oikonomopoulos S., Ragoussis J., Pugh C.W., Ratcliffe P.J., Mole D.R. High-resolution genome-wide mapping of HIF-binding sites by ChIP-seq. Blood. 2011;117:e207–e217. doi: 10.1182/blood-2010-10-314427. [DOI] [PMC free article] [PubMed] [Google Scholar]
- Senkel S., Lucas B., Klein-Hitpass L., Ryffel G.U. Identification of target genes of the transcription factor HNF1beta and HNF1alpha in a human embryonic kidney cell line. Biochim. Biophys. Acta. 2005;1731:179–190. doi: 10.1016/j.bbaexp.2005.10.003. [DOI] [PubMed] [Google Scholar]
- Sharon E., Kalma Y., Sharp A., Raveh-Sadka T., Levo M., Zeevi D., Keren L., Yakhini Z., Weinberger A., Segal E. Inferring gene regulatory logic from high-throughput measurements of thousands of systematically designed promoters. Nat. Biotechnol. 2012;30:521–530. doi: 10.1038/nbt.2205. [DOI] [PMC free article] [PubMed] [Google Scholar]
- Slomovic S., Collins J.J. DNA sense-and-respond protein modules for mammalian cells. Nat. Methods. 2015;12:1085–1090. doi: 10.1038/nmeth.3585. [DOI] [PubMed] [Google Scholar]
- Smith R.P., Taher L., Patwardhan R.P., Kim M.J., Inoue F., Shendure J., Ovcharenko I., Ahituv N. Massively parallel decoding of mammalian regulatory sequences supports a flexible organizational model. Nat. Genet. 2013;45:1021–1028. doi: 10.1038/ng.2713. [DOI] [PMC free article] [PubMed] [Google Scholar]
- Steen E.J., Kang Y., Bokinsky G., Hu Z., Schirmer A., McClure A., Del Cardayre S.B., Keasling J.D. Microbial production of fatty-acid-derived fuels and chemicals from plant biomass. Nature. 2010;463:559–562. doi: 10.1038/nature08721. [DOI] [PubMed] [Google Scholar]
- Stricker J., Cookson S., Bennett M.R., Mather W.H., Tsimring L.S., Hasty J. A fast, robust and tunable synthetic gene oscillator. Nature. 2008;456:516–519. doi: 10.1038/nature07389. [DOI] [PMC free article] [PubMed] [Google Scholar]
- Tamsir A., Tabor J.J., Voigt C.A. Robust multicellular computing using genetically encoded NOR gates and chemical “wires.”. Nature. 2011;469:212–215. doi: 10.1038/nature09565. [DOI] [PMC free article] [PubMed] [Google Scholar]
- Tan C., Marguet P., You L. Emergent bistability by a growth-modulating positive feedback circuit. Nat. Chem. Biol. 2009;5:842–848. doi: 10.1038/nchembio.218. [DOI] [PMC free article] [PubMed] [Google Scholar]
- Thomas H., Jaschkowitz K., Bulman M., Frayling T.M., Mitchell S.M., Roosen S., Lingott-Frieg A., Tack C.J., Ellard S., Ryffel G.U., Hattersley A.T. A distant upstream promoter of the HNF-4alpha gene connects the transcription factors involved in maturity-onset diabetes of the young. Hum. Mol. Genet. 2001;10:2089–2097. doi: 10.1093/hmg/10.19.2089. [DOI] [PubMed] [Google Scholar]
- Tigges M., Marquez-Lago T.T., Stelling J., Fussenegger M. A tunable synthetic mammalian oscillator. Nature. 2009;457:309–312. doi: 10.1038/nature07616. [DOI] [PubMed] [Google Scholar]
- Tronche F., Ringeisen F., Blumenfeld M., Yaniv M., Pontoglio M. Analysis of the distribution of binding sites for a tissue-specific transcription factor in the vertebrate genome. J. Mol. Biol. 1997;266:231–245. doi: 10.1006/jmbi.1996.0760. [DOI] [PubMed] [Google Scholar]
- Veeman M.T., Slusarski D.C., Kaykas A., Louie S.H., Moon R.T. Zebrafish prickle, a modulator of noncanonical Wnt/Fz signaling, regulates gastrulation movements. Curr. Biol. 2003;13:680–685. doi: 10.1016/s0960-9822(03)00240-9. [DOI] [PubMed] [Google Scholar]
- Weber W., Fux C., Daoud-el Baba M., Keller B., Weber C.C., Kramer B.P., Heinzen C., Aubel D., Bailey J.E., Fussenegger M. Macrolide-based transgene control in mammalian cells and mice. Nat. Biotechnol. 2002;20:901–907. doi: 10.1038/nbt731. [DOI] [PubMed] [Google Scholar]
- Wegner M. All purpose Sox: The many roles of Sox proteins in gene expression. Int. J. Biochem. Cell Biol. 2010;42:381–390. doi: 10.1016/j.biocel.2009.07.006. [DOI] [PubMed] [Google Scholar]
- Wissmüller S., Kosian T., Wolf M., Finzsch M., Wegner M. The high-mobility-group domain of Sox proteins interacts with DNA-binding domains of many transcription factors. Nucleic Acids Res. 2006;34:1735–1744. doi: 10.1093/nar/gkl105. [DOI] [PMC free article] [PubMed] [Google Scholar]
- Xie Z., Wroblewska L., Prochazka L., Weiss R., Benenson Y. Multi-input RNAi-based logic circuit for identification of specific cancer cells. Science. 2011;333:1307–1311. doi: 10.1126/science.1205527. [DOI] [PubMed] [Google Scholar]
- Xiong W., Ferrell J.E., Jr. A positive-feedback-based bistable “memory module” that governs a cell fate decision. Nature. 2003;426:460–465. doi: 10.1038/nature02089. [DOI] [PubMed] [Google Scholar]
- Zhang Q., Andersen M.E. Dose response relationship in anti-stress gene regulatory networks. PLoS Comput. Biol. 2007;3:e24. doi: 10.1371/journal.pcbi.0030024. [DOI] [PMC free article] [PubMed] [Google Scholar]
- Zhou D., Bai F., Zhang X., Hu M., Zhao G., Zhao Z., Liu R. SOX10 is a novel oncogene in hepatocellular carcinoma through Wnt/β-catenin/TCF4 cascade. Tumour Biol. 2014;35:9935–9940. doi: 10.1007/s13277-014-1893-1. [DOI] [PubMed] [Google Scholar]
Associated Data
This section collects any data citations, data availability statements, or supplementary materials included in this article.
Supplementary Materials
DNA amounts and plasmid setup used for each experiment.