

Abstract
Aims/Introduction
To clarify the association of the hypertriglyceridemic waist phenotype and type 2 diabetes mellitus among adults in China.
Materials and Methods
In the present case–control study, we included 1,685 patients with type 2 diabetes mellitus and 7,141 normal glucose‐tolerant controls from the Henan Province of China in 2011. Elevated waist circumference (GW) was defined as ≥90 cm for men and ≥80 cm for women. Hypertriglyceridemia (HT) was defined as >1.7 m mol/L triglycerides (TG) level. The association of hypertriglyceridemic waist phenotype and type 2 diabetes mellitus was investigated by sex, body mass index, physical activity, and family history of diabetes.
Results
Cases and controls differed in age, waist circumference (WC), weight, TG level, fasting glucose, body mass index, smoking status, diabetic family history, physical activity and hypertriglyceridemic waist phenotype (P < 0.05), but not alcohol drinking (P = 0.63). In the overall sample, as compared with the phenotype of normal TG level and normal WC (NTNW), normal TG level/enlarged WC (NTGW), elevated TG level/normal WC (HTNW) and elevated TG level/enlarged WC (HTGW) were associated with type 2 diabetes mellitus (odds ratio 4.14, 2.42 and 6.23, respectively). Only HTGW was consistently associated with risk of type 2 diabetes mellitus, with or without adjustment. The strongest relationship between HTGW and type 2 diabetes mellitus was for subjects with body mass index <24.0 kg/m2 (odds ratio 6.54, 95% confidence interval 4.22–10.14) after adjustment for cofounding variables.
Conclusion
HTGW was stably and significantly associated with risk of type 2 diabetes mellitus in adult Chinese.
Keywords: Adult, Hypertriglyceridemic waist phenotype, Type 2 diabetes mellitus
Introduction
The International Diabetes Federation estimated that 371 million adults are living with diabetes mellitus (DM) worldwide1; diabetes mellitus is becoming one of the main chronic non‐communicable diseases threatening the health of people around the world2. Half of all diabetes mellitus cases worldwide are undiagnosed1, which highlights the need for early diagnosis and management to prevent or delay complications.
Elevated triglycerides (TG) level/enlarged waist circumference (WC; HTGW) was first found to be a marker of atherosclerosis in 20003. Subsequent studies showed that HTGW was a risk factor for metabolic diseases, such as type 2 diabetes mellitus4, 5, 6, 7, 8, 9. A recent meta‐analysis found the risk of type 2 diabetes mellitus increased with HTGW (odds ratio 4.18, 95% confidence interval [CI] 3.55–4.92)10. Because determining HTGW is relatively easy and inexpensive, some researchers have suggested it as a screening and diagnostic predictor of type 2 diabetes mellitus11, 12. Despite many studies in this area13, 14, 15, 16, 17, previous studies did not stratify by subject characteristics.
In the present study, we aimed to clarify the association of the hypertriglyceridemic waist phenotype and type 2 diabetes mellitus among adults in China. To further clarify the association, data for subjects were analyzed by sex, body mass index (BMI), physical activity and family history of diabetes as stratification variables.
Materials and methods
Study design and sample
We recruited 9,619 participants (1,842 type 2 diabetes mellitus cases and 7,777 healthy controls from the Henan Province of China in 2011). After excluding participants with concurrent use of lipid‐modified agents (157 cases, 636 controls), we included 8,826 participants (1,685 cases, 7,141 controls). All participants were aged 20–85 years, and were recruited from community and outpatient clinics of several hospitals located in Henan Province, China. A standard questionnaire assessing demographic characteristics; lifestyle, such as smoking, alcohol drinking and work‐related physical activity; and family history of diseases and other risk factors, was administered by trained research staff. After the interview, participants completed a physical examination that included evaluation of anthropometric indexes, blood pressure and collection of biological specimens for assessment. We included patients with a diagnosis of type 2 diabetes mellitus according to the 2005 American Diabetes Association criteria18: fasting plasma glucose ≥7.0 m mol/L and/or 2‐h plasma glucose ≥11.0 m mol/L during an oral glucose tolerance test with diabetes clinical symptoms and/or the use of insulin or oral hypoglycemic agents and/or a self‐reported history of diabetes. We excluded patients with type 1 diabetes and other abnormal glucose tolerance. A total of 1,685 cases were recruited from the outpatient clinics of three hospitals (928 cases) or from communities (757 cases) in Henan Province, and 7,141 controls with fasting plasma glucose <6.1 m mol/L or normal oral glucose tolerance test results and no previously diagnosed diabetes were recruited from communities in the same province. We excluded subjects who were pregnant, disabled, mentally disturbed and obese (caused by disease) or taking certain drugs, and had cancer. The present study was approved by the Ethics Committee of Zhengzhou University. All participants provided written informed consent.
Study variables
Smokers had smoked ≥100 cigarettes during their lifetime and/or were still smoking19, 20. Alcohol drinkers were defined as consuming 100 mL liquor in 30 days. Physical activity level was classified as low, moderate or high based on the International Physical Activity Questionnaire (www.ipaq.ki.se). BMI was classified as normal weight (<24 kg/m2), overweight (24.0–27.9 kg/m2) and obese (≥28 kg/m2)21. One or both parents having diabetes was considered having a family history of diabetes.
Definition of HTGW
According to the new International Diabetes Federation definition for Chinese people22, participants were classified into four groups: (i) NTNW, normal TG level (≤150 mg/dL [1.7 mmol/L])/normal WC (<90 cm for men and <80 cm for women); (ii) NTGW, normal TG level/enlarged WC (≥90 cm for men and ≥80 cm for women); (iii) HTNW, elevated TG level (>150 mg/dL [1.7 mmol/L])/normal WC; and (iv) HTGW, elevated TG level/enlarged WC.
Statistical analysis
Categorical data are represented as number (percentage), and were analyzed by the χ2‐test. Continuous data are represented as median (interquartile range) for data with skewed distribution. The Mann–Whitney–Wilcoxon test was used to assess differences in sex, age, smoking, alcohol drinking, BMI, physical activity, family history of diabetes, and hypertriglyceridemic waist phenotype by cases and controls. The χ2‐test was used to determine the association between independent variables and type 3 diabetes mellitus. Logistic regression models were used to calculate odds ratios (ORs), 95% confidence intervals (95% CIs) and corresponding P‐values for risk factors associated with type 2 diabetes mellitus. We checked the interaction between and among different risk factors, and then used multiple logistic modeling to adjust for confounders. Sex, age, smoking, alcohol drinking, BMI, physical activity, and family history of diabetes were covariates and/or stratifying variables. All these covariates we chose in the multiple logistic modeling are associated with type 2 diabetes mellitus. Missing data are included in statistical descriptions and were excluded for stratifying variables used in logistic regression analysis. Statistical analysis involved use of sas 9.10 for Windows (SAS Institute, Cary, NC, USA). P < 0.05 (two‐sided) was considered statistically significant.
Results
Participant characteristics
We recruited 8,826 participants (1,685 cases, 7,141 controls). The demographic characteristics are in Table 1. The frequency of overweight or obesity and family history of diabetes, as well as median age, WC and TG level were higher for cases than controls. Cases more often than controls had low rather than moderate or high physical activity (P < 0.01), and more frequently were HTGW and smokers (P < 0.05). The alcohol drinking status did not differ between the groups (P = 0.63).
Table 1.
Demographic characteristics of cases and controls
| Characteristics | Cases (n = 1,685) | Controls (n = 7,141) | P‐value |
|---|---|---|---|
| Sex, n (%) | <0.01 | ||
| Male | 846 (50.21%) | 3,026 (42.38%) | |
| Female | 839 (49.79%) | 4,115 (57.62%) | |
| Median age, years (IQR) | 54.0 (45.0, 61.0) | 48.0 (39, 57.0) | <0.01 |
| Median WC, cm (IQR) | 91.0 (83.5, 102.1) | 81.0 (74.6, 88.0) | <0.01 |
| Median weight, kg (IQR) | 74.1 (64.0, 84.3) | 60.0 (54.0, 67.0) | <0.01 |
| Median triglycerides level, mmol/L (IQR) | 1.7 (1.2, 2.5) | 1.3 (0.93, 1.9) | <0.01 |
| Median fasting glucose, mmol/L (IQR) | 7.6 (6.1, 10.0) | 5.2 (4.9, 5.5) | <0.01 |
| Median BMI, kg/m2 (IQR) | 27.6 (24.6, 31.0) | 23.7 (21.6, 26.0) | <0.01 |
| BMI categories (kg/m2), n (%) | <0.01 | ||
| <24.0 | 335 (19.88%) | 3,825 (53.56%) | |
| 24.0–27.9 | 583 (34.60%) | 2,483 (34.77%) | |
| ≥28.0 | 767 (45.52%) | 833 (11.67%) | |
| Smoking status, n (%)a | 0.035 | ||
| Non‐smoker | 1,298 (77.03%) | 5,465 (76.53%) | |
| Smoker | 346 (20.53%) | 1,676 (23.47%) | |
| Alcohol drinking status, n (%)a | 0.631 | ||
| Non‐drinker | 1,419 (84.21%) | 6,203 (86.86%) | |
| Drinker | 223 (13.23%) | 938 (13.14%) | |
| Physical activity, n (%)a | <0.01 | ||
| Low | 1,018 (60.42%) | 1,765 (24.72%) | |
| Moderate | 189 (11.22%) | 1,389 (19.45%) | |
| High | 440 (26.11%) | 3,987 (55.83%) | |
| Family history of diabetes, n (%)a | <0.01 | ||
| Yes | 343 (20.36%) | 378 (5.29%) | |
| No | 1,300 (77.15%) | 6,763 (94.71%) | |
| Waist/triglyceride combination, n (%) | <0.01 | ||
| NTNW | 279 (16.56%) | 3,316 (46.44%) | |
| NTGW | 564 (33.47%) | 1,618 (22.66%) | |
| HTNW | 200 (11.87%) | 982 (13.75%) | |
| HTGW | 642 (38.10%) | 1,225 (17.15%) | |
Data for some participants were missing. BMI, body mass index; HTGW, elevated triglyceride level/enlarged waist circumference; HTNW, elevated triglyceride level (>150 mg/dL [1.7 m mol/L])/normal waist circumference; IQR, interquartile range; NTGW, normal triglyceride level and enlarged WC (≥90 cm for men and ≥80 cm for women); NTNW, normal triglyceride level (≤150 mg/dL [1.7 mmol/L])/normal waist circumference (<90 cm for men and <80 cm for women); WC, waist circumference.
Association of different metabolic types and type 2 diabetes mellitus
Risk of type 2 diabetes mellitus was higher for participants with NTGW, HTNW and HTGW as compared with NTNW participants (OR 4.14, 95% CI 3.55–4.84; OR 2.42, 95% CI 1.99–2.94; OR 6.23, 95% CI 5.33–7.27, respectively; model 1, Figure 1; Table S1). After adjusting for sex, age, smoking, original BMI, physical activity level and family history of diabetes (model 2, Figure 1; Table S1), the ORs were 2.62 (95% CI 2.09–3.28), 1.90 (95% CI 1.52–2.37) and 3.49 (95% CI 2.80–4.36), respectively (model 2, Figure 1; Table S1).
Figure 1.
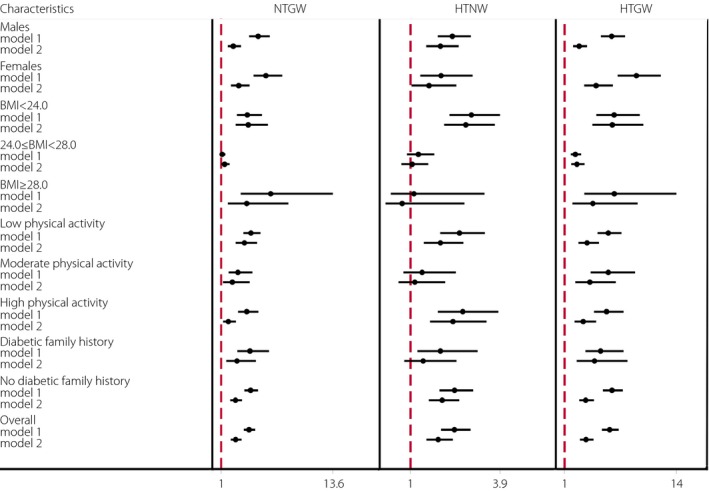
Multivariate logistics analysis of the association of waist circumference and triglyceride risk combinations and type 2 diabetes mellitus in Chinese participants compared with participants with normal waist and normal triglycerides level (odds ratio 1.0). BMI, body mass index; HTGW, elevated triglycerides level/enlarged waist circumference; HTNW, elevated triglycerides level (>150 mg/dL [1.7 m mol/L])/normal waist circumference; model 1, unadjusted; model 2, adjusted for sex, age, smoking, alcohol drinking, body mass index, physical activity and family history of diabetes except for the stratifying variables; NTGW, normal triglycerides level and enlarged waist circumference (≥90 cm for men and ≥80 cm for women).
Interaction analysis shows significant interactive effects between participant characteristics and the HTGW phenotype (Table S2). Stratification analysis showed that with and without adjustment (Figure 1), NTGW was not associated with type 2 diabetes mellitus for participants with BMI 24.0–28.0 kg/m2. After adjusting for sex, age, smoking, BMI, family history of diabetes and physical activity (model 2, Figure 1), HTNW was not associated with type 2 diabetes mellitus for participants with moderate physical activity or BMI ≥24.0 kg/m2. With and without adjustment and stratification, HTGW was consistently associated with type 2 diabetes mellitus, with the strongest association between HTGW and type 2 diabetes mellitus for participants with BMI <24.0 kg/m2 (OR 6.54, 95% CI 4.22–10.14) after adjustment (model 2, Figure 1; Table S1).
Discussion
In Chinese in Henan Province: (i) age, WC, weight, BMI and TG level were significantly higher in cases than controls; (ii) HTGW was a stable risk factor for type 2 diabetes mellitus, regardless of participant characteristics; and (iii) HTGW was closely associated with type 2 diabetes mellitus for women and participants with BMI <24 kg/m2.
Lacking physical activity and an overly sedentary lifestyle are the 21st century's important public health problems23, being common risk factors of chronic non‐communicable diseases, such as cardiovascular and metabolic disease24. Our stratified analyses by different levels of physical activity showed that moderate and high physical activity were protective factors of type 2 diabetes mellitus (cases vs controls, 11.2% vs 19.5% and 26.1% vs 55.8%, respectively, P < 0.05). Previous studies showed that the health effects of physical activity have a dose–effect relationship25, 26: once the activity reaches a certain level, visceral fat is reduced and fat consumption at rest is increased27, 28, which interferes with the development of metabolic disease.
In the present study, the association between HTGW and type 2 diabetes mellitus remained significant after controlling for sociodemographic characteristics, behavioral risk factors, physical activity and family history of type 2 diabetes mellitus, and was even stronger than with traditional risk factors, such as BMI, WC, waist/hip ratio29 and metabolic syndrome30.
As compared with participants with the NTNW phenotype, women with the HTGW phenotype were at increased risk of type 2 diabetes mellitus regardless of adjustment for other characteristics. Okosun and Boltri31 suggested a sex difference in the association of the HTGW phenotype and type 2 diabetes mellitus. After stratified analysis, the same results were found in different subgroups of BMI. The ORs for type 2 diabetes mellitus with BMI <24.0, 24.0–27.9, and ≥28.0 kg/m2 were 6.5, 2.4 and 4.3, respectively. Thus, the predictive effect of HTGW for type 2 diabetes mellitus might be better for subjects with BMI <24.0 kg/m2 than other BMI levels. Daniel et al.4 and Du et al.32 also supported this finding. Although the mechanisms for this association are not clear, previous findings suggested that a partial explanation for the mechanism might be the difference in body fat distribution: Asians are more likely to develop visceral than peripheral adiposity, which is metabolically obese, but normal weight, and more closely associated with type 2 diabetes mellitus than overall adiposity33. More importantly, as compared with HTNW or NTGW, HTGW was a stable risk factor for type 2 diabetes mellitus, and the association of HTGW and type 2 diabetes mellitus was significant after all stratified analyses.
Although this was a relatively large sample case–control study for evaluating risk factors of type 2 diabetes mellitus, our study contained several limitations. The first is the possible heterogeneity among participants recruited from different studies. Second, with this case–control study, recall and prevalence–incidence biases might affect the association of HTGW and type 2 diabetes mellitus. Third, dietary intake information was not investigated, and its potential effect on type 2 diabetes mellitus could not be evaluated.
In conclusion, the present study suggested a stable and significant association between HTGW and type 2 diabetes mellitus. It also highlights the need for effective measures for prevention and control of HTGW, which might help lower the risk of diabetes.
Disclosure
The authors declare no conflict of interest.
Supporting information
Table S1| Multivariate analysis of association of waist circumference and triglyceride risk combinations and type 2 diabetes by stratified analyses.
Table S2| Interaction of participant characteristics, and WC and TG level combinations associated with risk of type 2 diabetes (odds ratio, 95% confidence interval).
Acknowledgments
This study was supported by the National Natural Science Foundation of China (No. 81373074 and 81402752), Science and Technology Development Foundation of Shenzhen (No. JCYJ20140418091413562) and Natural Science Foundation of Shenzhen University (No. 201404).
J Diabetes Investig 2016; 7: 689–694
References
- 1. Guariguata L. By the numbers: New estimates from the IDF diabetes Atlas update for 2012. Diabetes Res Clin Pract 2012; 98: 524–525. [DOI] [PubMed] [Google Scholar]
- 2. Seuring T, Archangelidi O, Suhrcke M. The economic costs of type 2 diabetes: A global systematic review. Pharmacoeconomics 2015; 33: 1–21. [DOI] [PMC free article] [PubMed] [Google Scholar]
- 3. Lemieux I, Pascot A, Couillard C, et al Hypertriglyceridemic waist: A marker of the atherogenic metabolic triad (hyperinsulinemia; hyperapolipoprotein B; small, dense LDL) in men? Circulation 2000; 102: 179–184. [DOI] [PubMed] [Google Scholar]
- 4. Daniel M, Paquet C, Kelly SJ, et al Hypertriglyceridemic waist and newly‐diagnosed diabetes among remote‐dwelling Indigenous Australians. Ann Hum Biol 2013; 40: 496–504. [DOI] [PubMed] [Google Scholar]
- 5. Kahn HS, Valdez R. Metabolic risks identified by the combination of enlarged waist and elevated triacylglycerol concentration. Am J Clin Nutr 2003; 78: 928–934. [DOI] [PubMed] [Google Scholar]
- 6. Qiurong Z. Interaction of both hypertriglyceridemic waist and impaired fasting glucose on the incidence of diabetes mellitus. China Med Abstracts 2013; 30: 23. [PubMed] [Google Scholar]
- 7. Diaz‐Santana MV, Suarez PE, Ortiz MA, et al Association between the hypertriglyceridemic waist phenotype, prediabetes, and diabetes mellitus among adults in Puerto Rico. J Immigr Minor Health 2016; 18: 102–109. [DOI] [PMC free article] [PubMed] [Google Scholar]
- 8. Carlsson AC, Riserus U, Arnlov J. Hypertriglyceridemic waist phenotype is associated with decreased insulin sensitivity and incident diabetes in elderly men. Obesity (Silver Spring) 2014; 22: 526–529. [DOI] [PubMed] [Google Scholar]
- 9. Zhang M, Gao Y, Chang H, et al Hypertriglyceridemic‐waist phenotype predicts diabetes: A cohort study in Chinese urban adults. BMC Public Health 2012; 12: 1081. [DOI] [PMC free article] [PubMed] [Google Scholar]
- 10. Ren Y, Luo X, Wang C, et al Prevalence of hypertriglyceridemic waist and association with risk of type 2 diabetes mellitus: A meta‐analysis. Diabetes Metab Res Rev 2015. doi: 10.1002/dmrr.2725. [DOI] [PubMed] [Google Scholar]
- 11. Gomez‐Huelgas R, Bernal‐Lopez MR, Villalobos A, et al Hypertriglyceridemic waist: An alternative to the metabolic syndrome? Results of the IMAP Study (multidisciplinary intervention in primary care). Int J Obes (Lond) 2011; 35: 292–299. [DOI] [PubMed] [Google Scholar]
- 12. de Graaf FR, Schuijf JD, Scholte AJ, et al Usefulness of hypertriglyceridemic waist phenotype in type 2 diabetes mellitus to predict the presence of coronary artery disease as assessed by computed tomographic coronary angiography. Am J Cardiol 2010; 106: 1747–1753. [DOI] [PubMed] [Google Scholar]
- 13. Arsenault BJ, Lemieux I, Despres JP, et al The hypertriglyceridemic‐waist phenotype and the risk of coronary artery disease: Results from the EPIC‐Norfolk prospective population study. Can Med Assoc J 2010; 182: 1427–1432. [DOI] [PMC free article] [PubMed] [Google Scholar]
- 14. Da Conceição‐Machado MEP, Silva LR, Santana MLP, et al Hypertriglyceridemic waist phenotype: Association with metabolic abnormalities in adolescents. J Pediat (Rio J) 2013; 89: 56–63. [DOI] [PubMed] [Google Scholar]
- 15. He S, Zheng Y, Shu Y, et al Hypertriglyceridemic waist might be an alternative to metabolic syndrome for predicting future diabetes mellitus. PLoS ONE 2013; 8: e73292. [DOI] [PMC free article] [PubMed] [Google Scholar]
- 16. Egeland GM, Cao Z, Young TK. Hypertriglyceridemic‐waist phenotype and glucose intolerance among canadian inuit: The International Polar Year Inuit Health Survey for adults 2007‐2008. CMAJ 2011; 183: E553–E558. [DOI] [PMC free article] [PubMed] [Google Scholar]
- 17. Yu D, Huang J, Hu D, et al Is an appropriate cutoff of hypertriglyceridemic waist designated for type 2 diabetes among Chinese adults? Clin Nutr 2010; 29: 192–198. [DOI] [PubMed] [Google Scholar]
- 18. American Diabetes Association . Standards of medical care in diabetes. Diabetes Care 2005; 28: S4–S36. [PubMed] [Google Scholar]
- 19. Li D. Cigarette smoking and risk of type 2 diabetes mellitus among adult men and women in China: A prospective cohort study. Peking Union Medical College 2012; 11–31. [Google Scholar]
- 20. Wang C, Li J, Xue H, et al Type 2 diabetes mellitus incidence in Chinese: contributions of overweight and obesity. Diabetes Res Clin Pr 2015; 107: 424–432. [DOI] [PubMed] [Google Scholar]
- 21. Zhong G. Predictive values of body mass index and waist circumference to risk factors of related diseases in Chinese adult population. Chin J epidemiol 2002; 23: 5–10. [PubMed] [Google Scholar]
- 22. International Diabetes Federation . The IDF consensus worldwide definition of the metabolic syndrome. Belgium:International Diabetes Federation 2006. [Google Scholar]
- 23. Blair SN. Physical inactivity: The biggest public health problem of the 21st century. Br J Sports Med 2009; 43: 1–2. [PubMed] [Google Scholar]
- 24. Ekelund U, Brage S, Franks PW, et al Physical activity energy expenditure predicts progression toward the metabolic syndrome independently of aerobic fitness in middle‐aged healthy Caucasians: The Medical Research Council Ely Study. Diabetes Care 2005; 28: 1195–1200. [DOI] [PubMed] [Google Scholar]
- 25. Kesaniemi YK, Danforth EJ, Jensen MD, et al Dose‐response issues concerning physical activity and health: An evidence‐based symposium. Med Sci Sports Exerc 2001; 33: S351–S358. [DOI] [PubMed] [Google Scholar]
- 26. Schnohr P, O'Keefe JH, Marott JL, et al Dose of jogging and long‐term mortality: The copenhagen city heart study. J Am Coll Cardiol 2015; 65: 411–419. [DOI] [PubMed] [Google Scholar]
- 27. Rissanen A, Fogelholm M. Physical activity in the prevention and treatment of other morbid conditions and impairments associated with obesity: Current evidence and research issues. Med Sci Sports Exerc 1999; 31: S635–S645. [DOI] [PubMed] [Google Scholar]
- 28. Xu W. Introduction to sports biochemistry. Higher Education Press, Beijing, 2005. [Google Scholar]
- 29. Vazquez G, Duval S, Jacobs DJ, et al Comparison of body mass index, waist circumference, and waist/hip ratio in predicting incident diabetes: A meta‐analysis. Epidemiol Rev 2007; 29: 115–128. [DOI] [PubMed] [Google Scholar]
- 30. Povel CM, Beulens JW, van der Schouw YT, et al Metabolic syndrome model definitions predicting type 2 diabetes and cardiovascular disease. Diabetes Care 2013; 36: 362–368. [DOI] [PMC free article] [PubMed] [Google Scholar]
- 31. Okosun IS, Boltri JM. Abdominal obesity, hypertriglyceridemia, hypertriglyceridemic waist phenotype and risk of type 2 diabetes in American adults. Diabetes Metab Syndr 2008; 2: 273–281. [Google Scholar]
- 32. Du T, Sun X, Huo R, et al Visceral adiposity index, hypertriglyceridemic waist and risk of diabetes: The China Health and Nutrition Survey 2009. Int J Obes 2013; 38: 840–847. [DOI] [PubMed] [Google Scholar]
- 33. Hsu WC, Araneta MR, Kanaya AM, et al BMI cut points to identify at‐risk Asian Americans for type 2 diabetes screening. Diabetes Care 2015; 38: 150–158. [DOI] [PMC free article] [PubMed] [Google Scholar]
Associated Data
This section collects any data citations, data availability statements, or supplementary materials included in this article.
Supplementary Materials
Table S1| Multivariate analysis of association of waist circumference and triglyceride risk combinations and type 2 diabetes by stratified analyses.
Table S2| Interaction of participant characteristics, and WC and TG level combinations associated with risk of type 2 diabetes (odds ratio, 95% confidence interval).