

Abstract
Aims/Introduction
To observe the longitudinal changes in serum adipocyte fatty acid‐binding protein (AFABP), carbohydrate, and lipid metabolism parameters in women with and without gestational diabetes mellitus (GDM) during mid‐ and late pregnancy periods, as well as to identify whether there is any association between AFABP and development of GDM.
Materials and Methods
A total of 40 GDM and 240 normal glucose tolerance participants were enrolled at 24–28 weeks and completed the study. The clinical features, serum AFABP, other adipocytokines (leptin, adiponectin, retinol‐binding protein 4), homeostasis model assessment of insulin resistance, and lipid profiles were measured in the second and third trimesters of pregnancy.
Results
Compared with the normal glucose tolerance group, the GDM group showed greater levels of AFABP, leptin and retinol‐binding protein 4; and a decreased level of adiponectin (P < 0.05 or P < 0.01) during mid‐ and late pregnancy periods. Prepregnancy body mass index was the independent factor impacting serum AFABP levels in the second (β = 0.567, P = 0.004) and third trimesters (β = 0.619, P = 0.001). Furthermore, GDM was independently associated with AFABP concentrations in multiple regression analysis in the second and third trimester (all P < 0.01). Serum AFABP, leptin and retinol‐binding protein 4 are risk factors for GDM; adiponectin is a protective factor for GDM (P < 0.05 or P < 0.01).
Conclusions
The GDM group had a higher level of AFABP during mid‐ and late stages of pregnancy; prepregnancy body mass index and GDM were the independent factors with respect to serum AFABP. AFABP might be closely related to obesity, insulin resistance and leptin resistance in pregnancy, and is a major risk factor for GDM.
Keywords: Adipocyte fatty acid binding protein, Adipocytokine, Gestational diabetes mellitus
Introduction
Gestational diabetes mellitus (GDM), defined as carbohydrate intolerance resulting in hyperglycemia with onset or first recognition during pregnancy, is a common complication affecting approximately 7% of all pregnancies (ranging from 1 to 14% depending on the population studied and the diagnostic tests used)1. Given the rise in the incidence of GDM over the past decade in China2, research to identify modifiable determinants of glucose intolerance has become a public health priority.
GDM is known to have negative consequences for both mother and infant. The mechanism responsible for the development of GDM is unclear, but GDM and type 2 diabetes mellitus are closely related, and confer a common pathogenesis of insulin resistance and/or β‐cell function. Adiposity is an important modifiable risk factor for the development of GDM, although mechanisms linking excess adiposity to elevated risk of GDM are not completely understood. Adipose tissue not only is involved in energy storage, but also functions as an active endocrine organ3. Adipose tissue secretes several specific proteins called adipocytokines that modulate the action of insulin in different tissues, suggesting that alterations in the expression and secretion of these factors might be linked to GDM and related diseases. Among adipocytokines identified to date are adiponectin, leptin, resistin, retinol‐binding protein 4 (RBP4) and tumor necrosis factor‐α4.
Adipocyte fatty acid‐binding protein (AFABP), also known as AP2 or FABP4, is one of the most abundant proteins in mature adipocytes5. It belongs to a family of fatty acid‐binding proteins that are small cytoplasmic proteins expressed in a highly tissue‐specific manner, and are thought to be important in mediating intracellular fatty acid trafficking6. Studies in animal models suggested that AFABP could be important in glucose homeostasis, and deletion of the AFABP gene protected mice from insulin resistance and hyperinsulinemia associated with both diet‐induced obesity7 and genetic obesity8. Higher baseline levels of circulating AFABP independently predicted the risk for developing metabolic syndrome during a follow up of 5 years9. Similarly, baseline AFABP concentrations were predictive of type 2 diabetes independent of obesity, insulin resistance or glycemic indices10 and as such, AFABP might play a central role in the development of type 2 diabetes and metabolic syndrome.
We know of few studies where the level of AFABP in GDM women has been determined11, 12, 13, and results have been contradictory. For example, it has not been well documented whether AFABP is associated with the pathogenesis of GDM. The purposes of the present study were to prospectively evaluate the longitudinal changes in AFABP, other apokines (leptin, adiponectin, RBP4), maternal body mass index (BMI), and carbohydrate and lipid metabolism in euglycemic women, and in women with GDM during the mid (second) and late (third) trimesters, and to assess their association with the development of GDM.
Materials and methods
Participants
A total of 287 pregnant women with single births underwent routine examinations at the Third Affiliated Hospital of Guangzhou Medical University, Guangzhou, China, and were then enrolled in the present prospective cohort study between February 2012 and November 2014. Exclusion criteria were as follows: age <18 or >40 years, multifetal pregnancy, pregestational diabetes mellitus (type 1 or 2), drug and/or alcohol abuse, thyroid disorder or other uncontrolled endocrine disease, renal or liver disease, heart disease, hypertension, or other major medical conditions that would affect glycemic and lipid metabolism. None smoked during pregnancy. The qualified participants were longitudinally studied during the middle (24–28 weeks) and late phases (≥37 weeks, 1 week before delivery) of their pregnancy. The present study was reviewed and approved by the institutional review board of the hospital. Written informed consent was obtained from all women before the study in accordance with the Declaration of Helsinki.
GDM was diagnosed according to the criteria of the International Association of Diabetic Pregnancy Study Group (IADPSG) guidelines14. Briefly, GDM is defined as having one or more abnormal values from the 2‐h, 75‐g oral glucose tolerance test between 24 and 28 weeks of gestation, with the cut‐points of 5.1 mmol/L (92 mg/dL) for fasting, 10.0 mmol/L (180 mg/dL) for 1 h and 8.5 mmol/L (153 mg/dL) for 2 h. Each participant carried out a 75‐g oral glucose tolerance test under a fasting state (>8 h) at 24–28 weeks. Pregnant women with normal glucose tolerance (NGT) were assigned to the control group. Participants who were diagnosed with GDM received individual nutritional counseling with instructions on appropriate restriction of energy intake, daily moderate exercise and self‐monitoring of blood glucose. The NGT women did not receive diet therapy. The nutritionist introduced the recommendations15 for weight gain during pregnancy according to prepregnancy BMI to GDM women. For those with a BMI less than 18.5 kg/m2, the recommended weight gain was between 12.5 and 18 kg; for those with a BMI between 18.5 and 24.9 kg/m2, the recommended weight gain was between 11.5 and 16 kg; for those with a BMI between 25 and 29.9 kg/m2, the recommended weight gain was between 7 and 11.5 kg; and for those who had a BMI of 30 kg/m2 or more, the total recommended weight gain was between 5 and 9 kg. The diets based on low‐glycemic index foods were recommended for the GDM women. Within 3–5 days after the determination of the patients' dietary control, their blood glucose levels before meals, after meals and at bedtime were measured for 3 days to learn their 24‐h glucose profile. If the patients' fasting blood glucose (FBG) values before meals and 2 h after meals were <5.3 and <6.7 mmol/L16, they were given diet therapy. If the treatment outcomes were unfavorable, the pregnant women were admitted to the hospital for diet and insulin therapy.
Demographic information from each participant included maternal age, parity, gestational weeks, bodyweight, height and BMI (before and during pregnancy), and medications; and personal and familial medical history were collected from medical records. Fetal growth and development were also monitored. Neonatal data included week of delivery and birthweight. Other relevant information pertaining to the pregnancy (e.g., complications) and pregnancy outcomes were also recorded.
Measurements
During the observation period, blood pressure, heart rate, waist circumference (WC), bodyweight and height were measured in the second and third trimesters. FBG, fasting blood lipids (triacylglycerol [TG], total cholesterol [TC], low‐density lipoprotein cholesterol [LDL‐C], high‐density lipoprotein cholesterol [HDL‐C]), fasting insulin (FINS), serum AFABP, leptin, RBP4 and adiponection were determined in the second and third trimester; whereas the 1‐h and 2‐h postprandial glucose and insulin concentrations were measured in the second trimester. Serum insulin was determined by a two‐site chemiluminescent enzyme immunometric assay in an Immulite automated analyzer (DPC; Siemens, Marburg, Germany). Serum levels of AFABP, leptin, adiponectin and RBP4 were measured by enzyme‐linked immunosorbent assay according to the manufacturer's instructions (R&D Systems, China, Shanghai). TG, TC, HDL‐C, LDL‐C, FPG, 1‐h postprandial glucose, 2‐h postprandial glucose, serum creatinine (Cr) and uric acid (UA) were all measured using standard laboratory methods in a central laboratory of our hospital.
The following equations were used in the present study: BMI = weight / height2 (kg/m2); and the homeostasis model assessment of insulin resistance (HOMA‐IR) index = fasting glucose (mmol/L) × fasting insulin ([mU/L) / 22.5.
Statistical analysis
Statistical analysis was carried out using SPSS 18.0 for windows (SPSS, Chicago, IL, USA). In order to analyze data that were not normally distributed, a logarithmic transformation was carried out. Quantitative data were expressed as mean ± standard deviation and analyzed using an unpaired t‐test. Counting data were analyzed using the χ2‐test; correlations were carried out by using the Pearson correlation analysis method; and associations between the incidence of GDM and other parameters were analyzed by logistic regression analyses. P < 0.05 was considered to be statistically significant.
Results
A total of 245 participants were classified as having normal glucose tolerance (NGT), and 42 participants were identified as having GDM according to the results of a 75‐g oral glucose tolerance test at 24–28 weeks of gestation. In the third trimester (≥37 weeks, 1 week before delivery), a total of 240 NGT and 40 GDM participants completed the study. Using dietary control, most of the GDM patients reached their target FBG level of 3.3–5.3 mmol/L and 2‐h PBG level of 4.4–6.7 mmol/L, and just four patients from the GDM group were given insulin therapy. Maternal and neonatal anthropological characteristics are presented in Table 1. In comparison with the NGT group, women with GDM showed a significantly advanced age (P < 0.05) and a greater BMI before pregnancy (P < 0.05) or in the second trimester (the time of sampling), and still had a significantly higher BMI in the third trimester (P < 0.05 or 0.01). BMI until study entry for the GDM group was significantly higher than in the control group, but during the entire pregnancy did not differ significantly between NGT and GDM groups. There were no significant differences between groups regarding gestational weeks, parity or blood pressure. Neonatal birthweight, neonatal gestational age and adverse pregnancy complications (cesarean and macrosomic neonates) were not significantly different between the groups (P > 0.05).
Table 1.
Study population characteristics, and delivery and neonatal data
| Characteristics | NGT | GDM | P‐value |
|---|---|---|---|
| n | 240 | 40 | |
| Age (years) | 28.21 ± 4.12 | 32.24 ± 3.81 | 0.006 |
| Gestational weeks | |||
| In 2nd trimester | 27.83 ± 2.65 | 26.91 ± 2.24 | 0.144 |
| In 3rd trimester | 38.56 ± 1.28 | 38.73 ± 1.43 | 0.312 |
| Parity (% primiparous) | 90.0 | 88.0 | 0.432 |
| Maternal BMI (kg/m2) | |||
| Prepregnancy | 20.83 ± 3.01 | 23.6 ± 3.5 | 0.013 |
| <18.5 | 19 (7.9%) | 2 (5%) | |
| ≥18.5 to <24 | 183 (76.3%) | 19 (47.5%) | |
| ≥24 to <28 | 36 (15.0%) | 17 (42.5%) | |
| ≥28 | 2 (0.8%) | 2 (5%) | |
| In second trimester (the time of sampling) | 24.31 ± 2.92 | 27.55 ± 3.40 | 0.007 |
| In third trimester | 26.29 ± 3.75 | 28.91 ± 3.36 | 0.010 |
| BMI gain until study entry | 3.55 ± 1.18 | 3.98 ± 1.23 | 0.041 |
| BMI gain during the whole pregnant period | 5.46 ± 1.34 | 5.39 ± 1.56 | 0.189 |
| Bodyweight gain after study entry (kg) | 5.02 ± 1.17 | 3.58 ± 0.82 | 0.032 |
| Delivery and neonatal data | |||
| Neonatal birthweight (kg) | 3.3 ± 0.3 | 3.4 ± 0.5 | 0.300 |
| Neonatal gestational age at delivery (weeks) | 39.2 ± 1.2 | 39.4 ± 0.9 | 0.644 |
| Cesarean section (%) | 32.08 | 27.50 | 0.056 |
| Macrosomic neonates (%) | 15.0 | 12.50 | 0.067 |
Data are reported in mean ± SD or number (%). BMI, body mass index; GDM, gestational diabetes mellitus; NGT, normal glucose tolerance.
In the second trimester, the GDM group showed a higher FBG, 1‐h PBG, and 2‐h PBG with respect to the NGT group (P < 0.05). The GDM group showed a higher level of UA, FINS, HOMA‐IR, TG and LDL‐C with respect to the NGT group (P < 0.05 or 0.01) in the second and third trimesters. In both groups, UA showed a significant increase from the second to third trimester (P < 0.05); whereas, in either group, there were no changes observed in Cr, FINS, HOMA‐IR, HDL‐C, TC, TG or LDL‐C across trimesters (P > 0.05). Furthermore, all women, NGT and GDM, were normotensive. Neither blood pressure, Cr, HDL‐C, TC, FFA, time as a main effect, nor group as a main effect was statistically significant (Table 2).
Table 2.
Clinical characteristics of participants with normal glucose tolerance and gestational diabetes mellitus in mid‐ and late pregnancy
| Characteristics | Second trimester | Third trimester | ||
|---|---|---|---|---|
| NGT | GDM | NGT | GDM | |
| n | 240 | 40 | 240 | 40 |
| Serum creatinine (μmol/L) | 48.03 ± 6.95 | 45.03 ± 6.35 | 51.23 ± 11.19 | 49.27 ± 9.66 |
| Uric acid (mmol/L) | 232.37 ± 51.68 | 262.25 ± 88.67† | 308.93 ± 75.82 | 345.43 ± 98.48† , § |
| Glucose (mmol/L) | ||||
| Fasting | 4.26 ± 0.42 | 5.12 ± 1.64‡ | 4.67 ± 0.23 | 5.01 ± 0.12 |
| 1 h | 7.30 ± 1.72 | 10.76 ± 2.21‡ | ||
| 2 h | 6.55 ± 0.95 | 8.83 ± 1.88‡ | ||
| FINS(mU/L)†† | 20.29 ± 1.07 | 28.97 ± 1.22‡ | 19.58 ± 1.06 | 26.80 ± 1.18‡ |
| HOMA‐IR | 3.62 ± 0.40 | 6.20 ± 1.73‡ | 3.79 ± 0.41 | 5.81 ± 1.16‡ |
| Total cholesterol (mmol/L) | 5.56 ± 0.97 | 5.52 ± 1.08 | 5.86 ± 1.02 | 6.12 ± 1.08 |
| Triglyceride (mmol/L) | 1.77 ± 0.55 | 2.91 ± 1.50‡ | 1.74 ± 0.53 | 2.85 ± 1.21‡ |
| HDL cholesterol (mmol/L) | 1.86 ± 0.49 | 1.78 ± 0.55 | 1.76 ± 0.40 | 1.71 ± 0.32 |
| LDL cholesterol (mmol/L) | 3.01 ± 0.74 | 3.39 ± 0.96† | 3.05 ± 0.82 | 3.44 ± 0.93† |
| Free fatty acids (mmol/L) | 0.31 ± 0.45 | 0.42 ± 0.04 | 0.33 ± 0.05 | 0.38 ± 0.03 |
| S/D BP (mmHg) | 113/73 ± 10/6 | 117/75 ± 12/7 | 117/73 ± 10/5 | 125/73 ± 12/7 |
| AFABP (μg/L) | 22.01 ± 2.00 | 32.35 ± 3.06‡ | 21.79 ± 1.32 | 36.47 ± 4.00‡ , ¶ |
| Leptin (μg/L) | 4.71 ± 1.29 | 10.57 ± 2.46‡ | 6.27 ± 2.21¶ | 13.75 ± 4.58‡ , ¶ |
| RBP4 (mg/L) | 36.82 ± 3.12 | 49.28 ± 4.83† | 39.35 ± 3.59 | 51.79 ± 4.64† |
| Adiponectin (mg/L) | 7.32 ± 0.39 | 3.98 ± 0.50‡ | 7.38 ± 0.31 | 3.32 ± 0.38‡ , ¶ |
† P < 0.05, ‡ P < 0.01 versus normal glucose tolerance (NGT) group in a similar trimester; § P < 0.05, ¶ P < 0.05 versus second trimester in a similar group. Fasting insulin (FINS) and homeostasis model assessment of insulin resistance (HOMA‐IR): age and prepregnancy body mass index‐adjusted P‐values. ††Data log transformed before analyses. AFABP, adipocyte fatty acid‐binding protein; BP, blood pressure; FFA, free fatty acids; GDM, gestational diabetes mellitus; HDL, high‐density lipoprotein; LDL, low‐density lipoprotein; RBP4, retinol‐binding protein 4; S/D, systolic/diastolic.
In the GDM group, AFABP, leptin and RBP4 were higher, and adiponection was lower in the second and third trimesters compared with the NGT group (P < 0.05 or 0.01). In the GDM group, there was a significant increase in AFABP from the second to third trimester; whereas in the NGT group, we did not observe significant changes during pregnancy. In the GDM group, but not in the NGT group, adiponectin decreased from the second to third trimester, reaching statistical significance (P < 0.05). In both groups, leptin increased significantly from the second to third trimester (P < 0.05 or 0.01).
According to the obesity criteria of World health Organization‐Western Pacific Region (2000) that BMI ≥25 kg/m2 was diagnosed as obesity17, all participants were divided into four subgroups: NGT‐normal weight (NGT‐NW) subgroup (n = 207), NGT‐obesity (NGT‐OB) subgroup (n = 33), GDM‐NW subgroup (n = 27) and GDM‐OB subgroup (n = 13). Among the NGT‐NW, NGT‐OB, GDM‐NW and GDM‐OB subgroups, the AFABP levels in NGT‐OB were higher than those in NGT‐NW (in the second trimester: 31.03 ± 3.87 vs 20.87 ± 1.89; in the second trimester: 29.72 ± 2.70 vs 20.59 ± 1.87, all P < 0.01), whereas the plasma AFABP concentrations in GDM‐OB were higher than those in GDM‐NW in each trimester (in the second trimester: 38.73 ± 3.36 vs 29.95 ± 2.82; in the third trimester: 42.12 ± 3.91 vs 34.78 ± 4.09, all P < 0.01). In the GDM‐OB and GDM‐NW subgroups, but not in the NGT‐NW and NGT‐OB subgroups, AFABP increased from the second to third trimester reaching statistical significance (all P < 0.05; Figure1).
Figure 1.
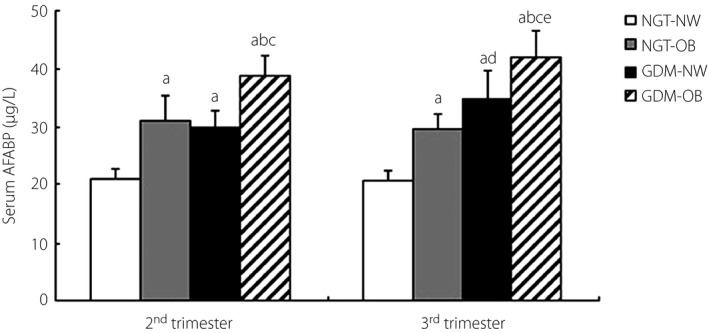
Comparison of serum adipocyte fatty acid‐binding protein (AFABP) levels in normal glucose tolerance‐normal weight (NGT‐NW), NGT‐obesity (NGT‐OB), gestational diabetes mellitus (GDM)‐NW and GDM‐OB subgroups. (a) P < 0.01 versus NGT‐NW in a similar trimester. (b) P < 0.01 versus GDM‐NW in a similar trimester. (c) P < 0.01 versus NGT‐OB in a similar trimester. (d) P < 0.05 versus GDM‐NW in the second trimester. (e) P < 0.05 versus GDM‐OB in the second trimester.
Table 3 shows the relationship between maternal AFABP concentration and variables of interest. In the second trimester, AFABP levels were positively correlated with prepregnancy BMI, maternal BMI in the second trimester, BMI gain until study entry, leptin and FINS (r = 0.486, 0.347, 0.327, 0.421, 0.379, respectively; P < 0.05 or 0.01). In the GDM group, the influence of parameters, such as adiponectin, leptin, RBP4, prepregnancy BMI, gestational advanced BMI, insulin, Cr, UA, TC and TG, on serum AFABP level was further investigated by multiple stepwise regression analysis. This analysis showed that prepregnancy BMI was the independent factor affecting serum AFABP levels (β = 0.567, t = 3.212, P = 0.004). In the third trimester, AFABP levels were positively correlated with prepregnancy BMI, maternal BMI in the third trimester, leptin and FINS (r = 0.574, 0.489, 0.431, 0.321, respectively; P < 0.01). Significant correlations between AFABP and adiponectin, Cr, UA, TC, TG, LDL‐C, HDL‐C, FBG, and PBG were not observed in the second and third trimesters. Multiple stepwise regression analysis showed that prepregnancy BMI was the independent factor with respect to AFABP (β = 0.619, t = 4.731, P = 0.001).
Table 3.
Significant correlations between maternal serum adipocyte fatty acid‐binding protein level and various variables in participants in the second and third trimester
| r | P‐value | |
|---|---|---|
| In second trimester | ||
| Prepregnancy BMI | 0.486 | 0.001 |
| Maternal BMI in second trimester (the time of sampling) | 0.347 | 0.035 |
| BMI gain until study entry | 0.327 | 0.028 |
| Leptin | 0.421 | 0.003 |
| FINS | 0.379 | 0.022 |
| In third trimester | ||
| Prepregnancy BMI | 0.574 | 0.000 |
| Maternal BMI in third trimester | 0.489 | 0.002 |
| Leptin | 0.431 | 0.002 |
| FINS | 0.321 | 0.026 |
BMI, body mass index; FINS, fasting insulin.
Furthermore, to clarify whether GDM is an independent factor of AFABP, the influence of the presence (or absence) of GDM and age on serum AFABP level were investigated by multiple stepwise regression analysis in the second and third trimester. The results showed that GDM was an independent factor of AFABP (in the second trimester: β = 6.168, t = 6.231, P < 0.01; in the third trimester: β = 4.235, t = 5.454, P < 0.01).
The influence of adipocytokines on GDM was further investigated using binary logistic regression analysis. The results showed that serum AFABP, leptin and RBP4 were risk factors for GDM, whereas adiponectin was a protective factor for GDM after adjusting for prepregnancy BMI, age and weight gain after study entry (P < 0.05 or 0.01; Table 4).
Table 4.
Influence of adipocytokine on gestational diabetes mellitus using binary logistic regression analysis
| Adipocytokine | OR | 95% CI | P‐value |
|---|---|---|---|
| In second trimester | |||
| AFABP | 3.679 | 1.379–9.814 | 0.009 |
| Leptin | 3.203 | 1.191–8.609 | 0.021 |
| Adiponectin | 0.198 | 0.049–0.645 | 0.005 |
| RBP4 | 1.358 | 1.071–1.722 | 0.012 |
| In third trimester | |||
| AFABP | 4.507 | 1.711–11.876 | 0.002 |
| Leptin | 2.279 | 1.298–4.001 | 0.004 |
| Adiponectin | 0.141 | 0.045–0.384 | 0.003 |
| RBP4 | 1.705 | 1.234–2.358 | 0.001 |
Prepregnancy body mass index, age and weight gain after study entry adjusted. 95% CI, 95% confidence interval; AFABP, adipocyte fatty acid‐binding protein; OR, odds ratio; RBP4, retinol‐binding protein 4.
Discussion
GDM is a common condition during pregnancy that is associated with negative short‐term and long‐term outcomes for both mothers and their offspring18. The women with GDM and their offspring have high risks for type 2 diabetes mellitus and cardiovascular diseases in later life18, 19, 20, 21, 22. The increasing prevalence of overweight/obesity and older age at pregnancy were accompanied by an increasing prevalence of GDM, which was further increased by modifications in the diagnostic criteria23, 24. Though new criteria were adopted and the prevalence of GDM increased, the blood glucose levels of most of the GDM patients were within the ideal range after dietary control. The present study used the IADPSG 2010 criteria, and we found that just four GDM patients required insulin therapy; the women with GDM and their neonates had no greater number of adverse pregnancy outcomes after blood glucose control and monitoring than that of NGT women. It is shown that good blood glucose control during pregnancy helps to prevent the occurrence of negative short‐term gestational complications.
We found that the women with GDM had a significantly advanced age and greater BMI before pregnancy, in the second and third trimesters, and greater weight gain until study entry, which was consistent with previous studies25, 26. Advanced maternal age and overweight/obesity were strong risk factors for GDM1, 25. Weight gain from prepregnancy to glucose challenge test also predicted GDM. In the present study, increased BMI during the entire pregnancy did not differ significantly between the NGT and GDM groups, and no significant differences in adverse short‐time pregnancy outcome and neonatal birthweight were found between the two groups, suggesting that the weight gain during the third trimester was associated with maternal and fetal outcomes. Good weight control during gestation contributes to good glycemic control, and positive maternal and fetal outcomes27.
In the present study, higher levels of FBG, FINS, HOMA‐IR, TG, LDL‐C and UA were found in GDM patients compared with controls in the second and third trimester, clearly showing a more insulin‐resistant condition with hyperglycemia, and disturbances in lipid metabolism.
AFABP, one of the most abundant proteins expressed in adipocytes, can influence insulin sensitivity and energy metabolism by regulation of fatty acid metabolism5. We found that the FINS and age‐adjusted AFABP concentrations were significantly higher in the GDM group compared with the NGT participants in the mid‐ and late stages of pregnancy. Furthermore, in women with GDM, there was a significant increase in AFABP from the second to third trimester. To our knowledge, this is the first prospective cohort study regarding AFABP in women with GDM. These results are consistent with the following two cross‐sectional studies. In a study by Kralisch et al.11, the GDM group had a higher AFABP level than did the control group. A second cross‐sectional study12 showed that AFABP levels in the GDM group were significantly higher than those of controls, and that AFABP was an independent risk factor for increased insulin resistance. Another cross‐sectional study showed inconsistent results. Ortega‐Senovilla et al.13 showed no differences in AFABP levels between the GDM and NGT groups when the AFABP values were corrected for insulin. These investigators additionally found no relationship between the measured indices of insulin resistance and the circulating concentrations of AFABP in the GDM and NGT groups. Comparing our study with these studies, the first difference between them is that Kralisch et al. collected blood at mid‐gestation, and Ortega‐Senovilla et al. collected samples just 1 week before delivery; whereas the present study evaluated the longitudinal changes in AFABP from mid‐ to late pregnancy. A second difference in Kralisch's study is that there were no differences in either insulin or HOMA values between the GDM and NGT groups; whereas in Ortega‐Senovilla's study, the GDM participants had a higher prepregnancy BMI, and higher insulin and HOMA values than did control participants. In the present study, we used the IADPSG criteria, which distinguished it from the previous studies. Using the IADPSG criteria further resulted in a rise in the prevalence of GDM, as those women with slight hyperglycemia could then be enrolled in the study. Furthermore, all women were of Han nationality in the present study. The genetic background of our study participants was therefore different from the other studies, and the discrepancy between our data and those in the other study could be related to differences in participants and the pregnancy stages studied.
Our data showed significant positive correlations between maternal AFABP levels and pre‐pregnancy BMI, BMI in the second and third trimester, BMI gain during the mid pregnancy period, FINS, and leptin in the second and third trimester; showing that AFABP was closely related to obesity and insulin resistance. The results of multiple stepwise regression analysis showed that prepregnancy BMI and GDM were the independent factor impacting serum AFABP levels. A similar association has also been shown in several populations. In cross‐sectional28, 29 and longitudinal studies9, the positive association between serum AFABP levels and the parameters of adiposity, hyperglycemia, insulin resistance, and metabolic syndrome were reported. Furthermore, AFABP concentrations were significantly associated with BMI before and 6 months after gastric banding in 33 morbidly obese patients30. In a study by Kralisch et al.11, markers of adiposity (BMI, serum leptin), TG and serum creatinine were independently associated with circulating AFABP. GDM was also independently associated with AFABP concentrations using multiple regression analysis. Considering this evidence, AFABP appears to be regulated in a bodyweight‐dependent manner similar to that for the adipokine leptin. It is tempting to speculate that hyperplastic and hypertrophic fat tissue developing during weight gain directly leads to increased AFABP production, as serum AFABP levels closely and positively correlate with AFABP synthesis in adipose tissue. Increased AFABP can promote the accumulation of short‐chain FFAs in cells and decrease PI3K‐AKT protein activity, thereby inhibiting glucose oxidation and glycolysis, and significantly reducing glucose uptake and utilization in muscle and the liver31. Therefore, the pathway from glucose to TG is disturbed, and the increased insulin resistance might then lead to GDM. We also observed that AFABP levels in all obese women, NGT and GDM, were significantly higher than those in the normal weight women of NGT and GDM. Furthermore, the GDM women, normal weight or obese, had significantly higher AFABP concentrations than did NGT women. This finding might show that dysglycemia could also increase AFABP in addition to obesity.
We observed that women with GDM had significant increases in leptin and RBP4, and significant decreases in adiponectin in the second to third trimester. The molecular mechanisms by which these hormones affect insulin resistance are not yet fully known. Leptin is independently and positively associated with features of metabolic syndrome, and several studies have described increased circulating concentrations of leptin in women with GDM. Leptin deficiency and genetic defects in leptin signaling pathways cause hyperphagia and obesity4. In clinical studies, serum leptin concentrations are directly proportional to fat mass, and decreased central leptin responsiveness – so‐called leptin resistance–is seen in obesity4. The present study showed that there is a positive correlation between serum AFABP and leptin, indicating that the interaction of these two factors might cause more severe insulin resistance. AFABP could be involved in leptin resistance, and contribute to more severe insulin resistance, but the underlying mechanisms require further investigation. We also found that serum AFABP, leptin and RBP4 were risk factors for GDM, whereas adiponectin was a protective factor after adjusting for the prepregnancy BMI, age and weight gain after study entry. Abnormalities in levels of AFABP and other adipocytokine (leptin, adiponectin, RBP4) in mid pregnancy might be related to the development of GDM, and untoward changes in these factors at late pregnancy stages might also indicate an increased risk for long‐term postpartum complications.
In conclusion, GDM women manifested advanced age, higher BMI, greater glycemic and lipid metabolic disturbances, and more severe insulin resistance than did the control group during mid‐ and late pregnancy. Maternal AFABP concentrations were significantly higher in the GDM group compared with NGT participants during mid‐ and late pregnancy periods. AFABP was closely related to obesity, insulin resistance and leptin resistance, and appeared to be regulated in a bodyweight‐dependent manner. Prepregnancy BMI and GDM were the independent factor impacting serum AFABP levels. AFABP, leptin and RBP4 were risk factors for GDM, whereas adiponectin was a protective factor for GDM. Abnormalities in levels of AFABP and other adipocytokines (leptin, adiponectin, RBP4) at mid pregnancy might be involved in the development of GDM, and at late stages of pregnancy might indicate an increased risk for long‐term postpartum complications.
Disclosure
The authors declare no conflict of interest.
Acknowledgments
This study was supported by the National Natural Science Foundation of China (No. 81200607) and the project of the Key Laboratory for Major Obstetric Diseases of Guangdong Higher Education Institutes (No. 2012Z05).
J Diabetes Investig 2016; 7: 797–804
References
- 1. American Diabetes Association . Diagnosis and classification of diabetes mellitus. Diabetes Care 2012; 35: S64–S71. [DOI] [PMC free article] [PubMed] [Google Scholar]
- 2. Zhang F, Dong L, Zhang CP et al Increasing prevalence of gestational diabetes mellitus in Chinese women from 1999 to 2008. Diabet Med 2011; 28: 652–657. [DOI] [PubMed] [Google Scholar]
- 3. Kershaw EE, Flier JS. Adipose tissue as an endocrine organ. J Clin Endocrinol Metab 2004; 89: 2548–2556. [DOI] [PubMed] [Google Scholar]
- 4. Fasshauer M, Blüher M, Stumvoll M. Adipokines in gestational diabetes. Lancet diabetes Endocrinol 2014; 2: 488–499. [DOI] [PubMed] [Google Scholar]
- 5. Makowski L, Hotamisligil GS. Fatty acid binding proteins – the evolutionary crossroads of inflammatory and metabolic responses. J Nut 2004; 134: 2464S–2468S. [DOI] [PMC free article] [PubMed] [Google Scholar]
- 6. Hertzel AV, Bernlohr DA. The mammalian fatty acid‐binding protein multigene family: molecular and genetic insights into function. Trends Endocrinol Metab 2000; 11: 175–180. [DOI] [PubMed] [Google Scholar]
- 7. Hotamisligil GS, Johnson RS, Distel RJ et al Uncoupling of obesity from insulin resistance through a targeted mutation in aP2, the adipocyte fatty acid binding protein. Science 1996; 274: 1377–1379. [DOI] [PubMed] [Google Scholar]
- 8. Uysal KT, Scheja L, Wiesbrock SM et al Improved glucose and lipid metabolism in genetically obese mice lacking aP2. Endocrinology 2000; 141: 3388–3396. [DOI] [PubMed] [Google Scholar]
- 9. Xu A, Tso AW, Cheung BM et al Circulating adipocyte‐fatty acid binding protein levels predict the development of the metabolic syndrome: a 5‐year prospective study. Circulation 2007; 115: 1537–1543. [DOI] [PubMed] [Google Scholar]
- 10. Tso AW, Xu A, Sham PC et al Serum adipocyte fatty acid binding protein as a new biomarker predicting the development of type 2 diabetes: a 10‐year prospective study in a Chinese cohort. Diabetes Care 2007; 30: 2667–2672. [DOI] [PubMed] [Google Scholar]
- 11. Kralisch S, Stepan H, Kratzsch J et al Serum levels of adipocyte fatty acid binding protein are increased in gestational diabetes mellitus. Eur J Endocrinol 2009; 160: 33–38. [DOI] [PubMed] [Google Scholar]
- 12. Li YY, Xiao R, Li CP et al Increased plasma levels of FABP4 and PTEN is associated with more severe insulin resistance in women with gestational diabetes mellitus. Med Sci Monit 2015; 21: 426–431. [DOI] [PMC free article] [PubMed] [Google Scholar]
- 13. Ortega‐Senovilla H, Schaefer‐Graf U, Meitzner K et al Gestational diabetes mellitus causes changes in the concentrations of adipocyte fatty acid‐binding protein and other adipocytokines in cord blood. Diabetes Care 2011; 34: 2061–2066. [DOI] [PMC free article] [PubMed] [Google Scholar]
- 14. Metzger BE, Gabbe SG, Persson B et al International association of diabetes and pregnancy study groups recommendations on the diagnosis and classification of hyperglycemia in pregnancy. Diabetes Care 2010; 33: 676–682. [DOI] [PMC free article] [PubMed] [Google Scholar]
- 15. To I O M U, Guidelines R I PW . Weight Gain During Pregnancy: Reexamining the Guidelines. Washington (DC): National Academies Press (US)2009. [PubMed] [Google Scholar]
- 16. Blumer I, Hadar E, Hadden DR et al Diabetes and pregnancy: an endocrine society clinical practice guideline. J Clin Endocrinol Metab 2013; 98: 4227–4249. [DOI] [PMC free article] [PubMed] [Google Scholar]
- 17. The Asia‐Pacific perspective: redefining obesity and its treatment. Health Communications Australia Pty Ltd; 2000, WHO/IASO/IOTF.
- 18. HAPO Study Cooperative Research Group , Metzger BE, Lowe LP et al Hyperglycemia and adverse pregnancy outcomes. N Engl J Med 2008; 358: 1991–2002. [DOI] [PubMed] [Google Scholar]
- 19. Feig DS, Zinman B, Wang X et al Risk of development of diabetes mellitus after diagnosis of gestational diabetes. CMAJ 2008; 179: 229–234. [DOI] [PMC free article] [PubMed] [Google Scholar]
- 20. Kessous R, Shoham‐Vardi I, Pariente G et al An association between gestational diabetes mellitus and long‐term maternal cardiovascular morbidity. Heart 2013; 99: 1118–1121. [DOI] [PubMed] [Google Scholar]
- 21. Tam WH, Yang XL, Chan JC et al Progression to impaired glucose regulation, diabetes and metabolic syndrome in Chinese women with a past history of gestational diabetes. Diabetes Metab Res Rev 2007; 23: 485–489. [DOI] [PubMed] [Google Scholar]
- 22. Hillier TA, Pedula KL, Schmidt MM et al Childhood obesity and metabolic imprinting: the ongoing effects of maternal hyperglycemia. Diabetes Care 2007; 30: 2287–2292. [DOI] [PubMed] [Google Scholar]
- 23. Liao S, Mei J, Song W et al The impact of the International Association of Diabetes and Pregnancy Study Groups (IADPSG) fasting glucose diagnostic criterion on the prevalence and outcomes of gestational diabetes mellitus in Han Chinese women. Diabet Med 2014; 31: 341–351. [DOI] [PubMed] [Google Scholar]
- 24. Leng J, Shao P, Zhang C et al Prevalence of gestational diabetes mellitus and its risk factors in Chinese pregnant women: a prospective population‐based study in Tianjin. China. PLoS One 2015; 10: e0121029. [DOI] [PMC free article] [PubMed] [Google Scholar]
- 25. Morikawa M, Yamada T, Sato S, et al Prevalence of hyperglycemia during pregnancy according to maternal age and pre‐pregnancy body mass index in Japan, 2007–2009. Int J Gynaecol Obstet 2012; 118: 198–201. [DOI] [PubMed] [Google Scholar]
- 26. Torloni MR, Betran AP, Horta BL et al Prepregnancy BMI and the risk of gestational diabetes: a systematic review of the literature with meta‐analysis. Obes Rev 2009; 10: 194–203. [DOI] [PubMed] [Google Scholar]
- 27. Drehmer M, Duncan BB, Kac G, et al Association of second and third trimester weight gain in pregnancy with maternal and fetal outcomes. PLoS ONE 2013; 8: e54704. [DOI] [PMC free article] [PubMed] [Google Scholar]
- 28. Xu A, Wang Y, Xu JY et al Adipocyte fatty acid binding protein is a plasma biomarker closely associated with obesity and metabolic syndrome. Clin Chem 2006; 52: 405–413. [DOI] [PubMed] [Google Scholar]
- 29. Yeung DC, Xu A, Cheung CW et al Serum adipocyte fatty acid‐binding protein levels were independently associated with carotid atherosclerosis. Arterioscler Thromb Vasc Biol 2007; 27: 1796–1802. [DOI] [PubMed] [Google Scholar]
- 30. Haider DG, Schindler K, Bohdjalian A et al Plasma adipocyte and epidermal fatty acid binding protein is reduced after weight loss in obesity. Diabetes Obes Metab 2007; 9: 761–763. [DOI] [PubMed] [Google Scholar]
- 31. Baar RA, Dinfelder CS, Smith LA et al Investigation of in vivo fatty acid metabolism in AFABP/ap2(‐/‐) mice. Am J Physiol Endocrinol Metab 2005; 288: E187–E193. [DOI] [PubMed] [Google Scholar]