Abstract
Xenobiotics exposure increases endoplasmic reticulum (ER) proliferation and cytochrome P-450 (CYP) induction to sustain metabolic requirements. Whether autophagy is essential for the removal of excess ER and CYP and whether an autophagy receptor is involved in this process in mammals remains elusive. In this study, we show that autophagy is induced in mouse livers after withdrawal of the hepatic mitogen 1,4-bis[2-(3,5-dichloropyridyloxy)] benzene (TCPOBOP). Although isolated autophagosomes, autolysosomes, and lysosomes from mouse livers after withdrawal of TCPOBOP contained ER proteins, those in control mouse livers did not. Liver-specific Atg5 knockout mice had higher basal hepatic ER content that was further increased and sustained after withdrawal of TCPOBOP compared with wild-type mice. In addition to regulating ER degradation, our results also suggest that autophagy plays a role in regulating the homeostasis of hepatic CYP because blocking autophagy led to increased CYP2B10 accumulation either at the basal level or following TCPOBOP withdrawal. Furthermore, we found that the autophagy receptor protein sequestosome 1 (SQSTM1)/p62 is associated with the ER. After withdrawal of TCPOBOP, p62 knockout mice had increased ER content in the liver compared with wild-type mice. These results suggest that p62 may act as an autophagy receptor for the autophagic removal of excess ER in the mouse liver. Taken together, our results indicate that autophagy is important for the removal of excess ER and hepatic CYP enzymes in mouse livers, a process associated with the autophagy receptor protein p62.
Keywords: autophagy, cytochrome P-450, endoplasmic reticulum (ER), liver, p62 (sequestosome 1 (SQSTM1))
Introduction
Detection and removal of excess or damaged organelles are crucial to maintain cellular homeostasis and assure cell survival. To achieve this balance between degradation and biogenesis of new organelles, cells utilize a conserved process called autophagy (1). In response to starvation, non-selective autophagy is activated to provide cells with essential amino acids and nutrients for their survival. In contrast, selective autophagy occurs to specifically remove damaged or excess organelles even under nutrient-rich conditions. Selective autophagy is usually mediated by ubiquitin signaling and autophagy receptor proteins such as Sequestosome 1 (SQSTM1)/p62 (hereafter referred to as p62), NBR1 (a neighbor of BRCA1 gene 1), nuclear domain 10 protein 52 kDa (NDP52), or optineurin (2, 3). Autophagy receptor proteins share common features of both binding to ubiquitin through ubiquitin-associated domains and LC3 protein through their LC3-interacting region (3–5).
The endoplasmic reticulum (ER)4 is composed of very dynamic membrane tubules that can undergo dramatic changes in their numbers and sizes to meet demands for changes of ER-related functions. For example, a massive increase of rough ER occurs when B lymphocytes differentiate into plasma B cells to meet demands for the synthesis and secretion of prodigious amounts of immunoglobulin (6). Increased proliferation of smooth ER is likewise observed in cultured cells overexpressing HMG-CoA reductase (7, 8). In yeast, activation of the unfolded protein response, a conserved signaling pathway that relieves ER stress by activating a transcriptional program, also increases ER expansion and volume (9). Furthermore, it was discovered that Atg8 is closely associated with the ER compartment and that autophagic vacuoles contained ER membranes, suggesting a possible involvement of autophagy in the regulation of ER homeostasis (a term referred to as erphagy) in yeast (9). Two recent studies suggest that selective erphagy in yeast is regulated by the receptor protein Atg40, whereas erphagy in mammals is regulated by FAM134B, which has been implicated in the degeneration of sensory neurons (10, 11).
In mammals, the liver is a major site of producing cytochrome P-450 (CYP) enzymes to ensure the metabolism of xenobiotics, a process that generally causes proliferation of smooth ER. For example, in response to phenobarbital or 1,4-bis [2-(3,5-dichloropyridyloxy)] benzene (TCPOBOP), two constitutive androstane receptor (CAR) agonists, there is an increase in the proliferation of ER and hepatocytes in rodent livers concomitant with the induction of several CYP enzymes such as CYP2B and CYP3A (12–14). More interestingly, the proliferating ER can return to normal after the cessation of phenobarbital treatment in rat livers, suggesting that cells can utilize a mechanism or mechanisms to regulate the homeostasis of the ER by removing excess ER (13). Although autophagy has been suggested to play a role in regulating the homeostasis of the ER in these studies, this notion was mainly based on a morphological analysis that showed double-membrane autophagosomes enveloped with ER membranes (12, 13). However, the molecular and biochemical basis of how autophagy regulates ER homeostasis after exposure to xenobiotics in mammals is not clear. Concomitant with the proliferation of the ER, xenobiotics often induce various CYPs for their metabolism. Whether autophagy plays a role in regulating hepatic CYP homeostasis is also not known. Given the recent rapid progress and the availability of multiple genetic animal and molecular tools for autophagy research, we aimed to explore this interesting phenomenon and determined the role and mechanisms of how autophagy regulates the homeostasis of hepatic ER. In this study, we analyzed the clearance of excess ER after TCPOBOP withdrawal in GFP-LC3 transgenic mice and liver-specific Atg5 knockout (Li-ATG5 KO, Atg5fl/fl, Cre+) mice. Our results indicate that TCPOBOP-induced ER proliferation is CAR-dependent. Autophagy is important for removal of excess ER and hepatic CYP enzymes in mouse livers after TCPOBOP withdrawal, which may be mediated by the autophagy receptor protein p62.
Results
Dynamic Changes of ER Content after Withdrawal of TCPOBOP in Mouse Livers
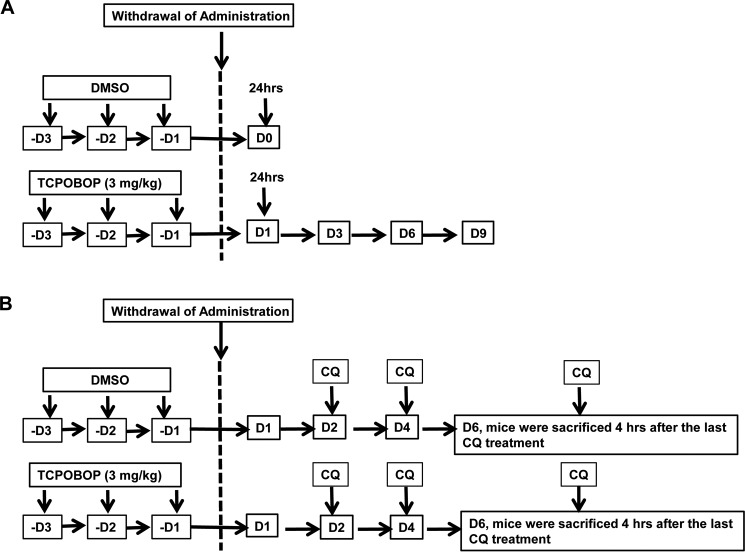
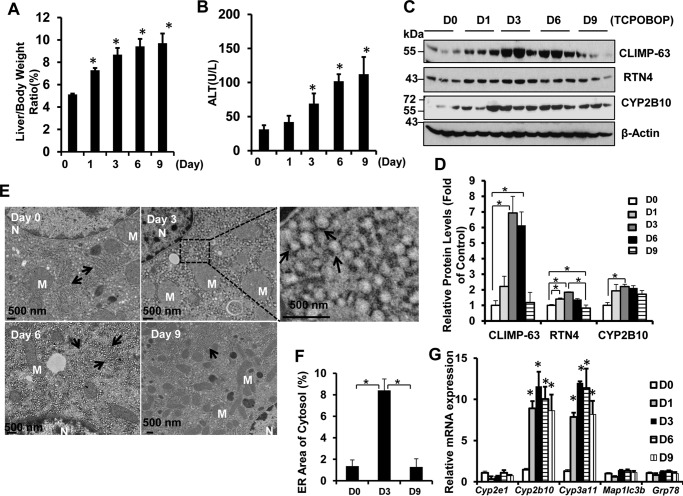
GFP-LC3 transgenic mice were sacrificed on days 1, 3, 6, and 9 after withdrawal of TCPOBOP administration (Fig. 1A). We found that the mouse liver to body weight ratio and serum alanine aminotransferase (ALT) levels increased after withdrawal of TCPOBOP (Fig. 2, A and B). Increased liver size was likely due to increased hepatocyte proliferation because withdrawal of TCPOBOP increased the levels of proliferating cell nuclear antigen (data not shown), a marker for proliferating hepatocytes. Western blotting analysis revealed that ER proteins, including the ER structural proteins CLIMP-63 and RTN4 (reticulon4 or Nogo-B), as well as the p450 enzyme CYP2B10 initially increased on day 1, peaked around days 3–6, and began declining on day 9 after withdrawal of TCPOBOP (Fig. 2, C and D). It should be noted that the magnitude of the degradation of each protein varied slightly. The degradation of CYP2B10 was less evident, likely because of the consistently increased expression of Cyp2b10 compared with other genes (Fig. 2G). Our results are also in agreement with a recent report that, in response to starvation, the levels of CLIMP-63 and RTN4 increased in Fam134b knockout mouse embryonic fibroblasts that have impaired erphagy (10). We found that the ER content did not change during the same time course after withdrawal of vehicle administration (data not shown). Furthermore, EM studies revealed a dramatic increase of ER structures on days 3 and 6 after withdrawal of TCPOBOP, but they returned to the basal control level on day 9 (Fig. 2E). Proliferating ER occupied majority of the cytosol in hepatocytes with an enlarged and dilated ER lumen on day 3 or tubular ER structures with some extent of dilation on day 6 after withdrawal of TCPOBOP. ER showed normal tubular structures that were enriched around mitochondrial areas on day 9 after withdrawal of TCPOBOP. Quantitative EM morphometric analysis of ER areas also revealed that the areas of ER in the cytosol increased on day 3 but declined on day 9 after withdrawal of TCPOBOP (Fig. 2F). The expression levels of Cyp2b10 and Cyp3a11 increased on day 1 and remained relatively constant on day 9, even after withdrawal of TCPOBOP, but the expression levels of Cyp2e1, Grp78, and the autophagy gene Map1lc3b did not change after withdrawal of TCPOBOP (Fig. 2G) (14). Collectively, these data suggest that withdrawal of TCPOBOP induces dynamic changes of ER content in hepatocytes.
FIGURE 1.
Schematics of the mouse treatment. A, male mice (8–12 weeks old) were either administered with vehicle (DMSO) or TCPOBOP (3 mg/kg) once a day (D) for 3 consecutive days. Mice were sacrificed 1, 3, 6, 9, and 12 days after withdrawal of TCPOBOP administration. The day 0 group consisted of mice that were sacrificed 1 day after withdrawal of DMSO administration. B, experimental schematic of the CQ treatment. Male mice were administered DMSO or TCPOBOP (3 mg/kg) once a day for 3 consecutive days. After withdrawal of DMSO or TCPOBOP administration, mice were further treated with saline or CQ (60 mg/kg) by one single intraperitoneal injection per day on days 2, 4, and 6. Then all mice were sacrificed 4 h after the last administration of CQ or saline on day 6.
FIGURE 2.
Induction of dynamic ER changes in GFP-LC3 transgenic mice after withdrawal of TCPOBOP administration. Male GFP-LC3 transgenic mice were either administered vehicle (DMSO) or TCPOBOP (3 mg/kg) once a day for 3 consecutive days. Mice were sacrificed 1, 3, 6, and 9 days after withdrawal of TCPOBOP administration. The day 0 (D0) group consisted of mice that were sacrificed 1 day after withdrawal of DMSO administration. A and B, the ratios of liver-to-body weight (A) and serum ALT levels (B) were quantified. Data are mean ± S.E. (n ≥ 3). *, p < 0.05 compared with the day 0 group (one-way ANOVA). C and D, total liver lysates were subjected to Western blotting analysis (C) and followed by densitometry analysis (D). All proteins were normalized to the loading control β-actin and presented as the -fold over vehicle control groups (mean ± S.E., n = 3). *, p < 0.05; one-way ANOVA. D, day. E, liver tissues were processed for EM studies. Shown is withdrawal of vehicle control (DMSO) and TCPOBOP (day 3, 6, and 9). Top right panel, an enlarged photograph from the boxed area. Arrows denote the ER. M, mitochondrion; N, nucleus. F, ER volumes were quantified using ImageJ software as described under “Materials and Methods.” Data are presented as the percentage of the volume of the ER versus cytosol area (mean ± S.E., n = 3). EM images were quantified from three different mice, and more than 10 cell sections were randomly selected and quantified in a blinded fashion from each mouse. *, p < 0.05; one-way ANOVA. G, hepatic mRNA was isolated, and real-time RT-PCR was performed as described under “Materials and Methods.” Data are presented as mean ± S.E. (n ≥ 3). *, p < 0.05 compared with the day 0 group (one-way ANOVA).
Autophagy Is Induced to Remove Excess ER after Withdrawal of TCPOBOP
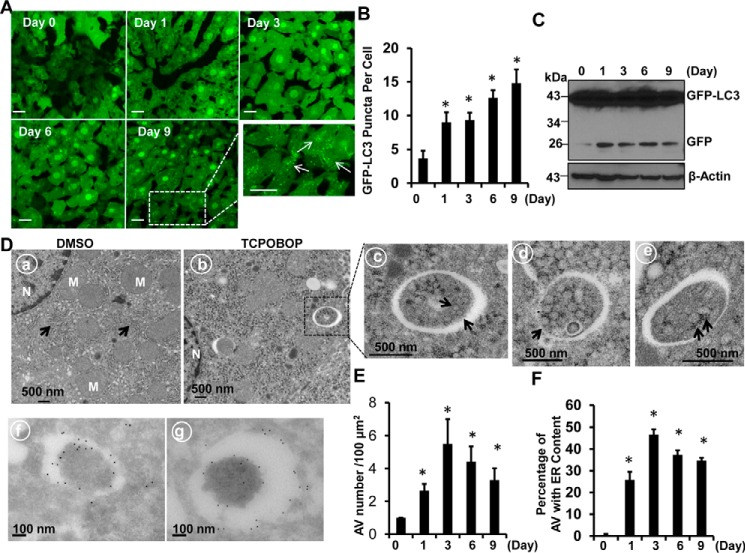
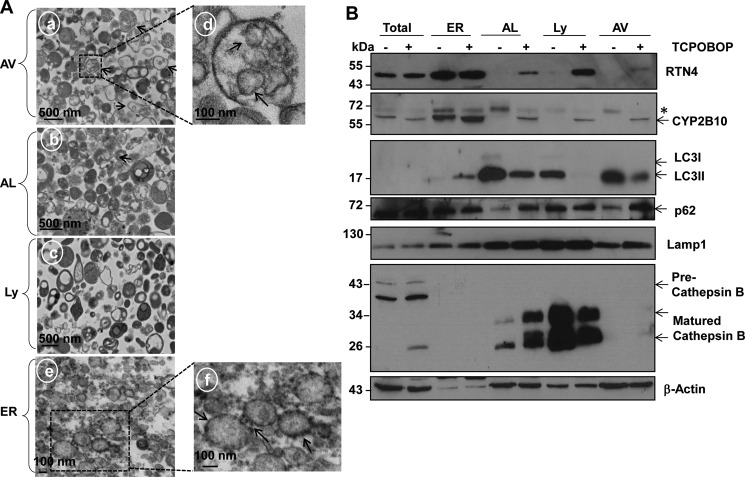
The results from fluorescence microscopy of cryo-liver sections revealed that TCPOBOP treatment markedly increased GFP-LC3 puncta in the liver, which represent autophagosomes in hepatocytes (Fig. 3, A and B). Immunoblot analysis indicated that the levels of free GFP increased after withdrawal of TCPOBOP (Fig. 3C). Free GFP is cleaved and released from the GFP-LC3 fusion protein in autolysosomes (15, 16). These results suggest that autophagic flux may be increased after withdrawal of TCPOBOP. EM studies indicated an increased accumulation of autophagosomes after TCPOBOP withdrawal (Fig. 3, D and E), and 20–50% double-membrane autophagosomes contained ER (Fig. 3, D, c–e, and F), suggesting that excess ER induced by TCPOBOP withdrawal may be removed via autophagy. Immuno-EM analysis revealed that these double-membrane structures were indeed GFP-LC3-positive autophagosomes (Fig. 3D, f and g). Isolated autophagosomes from livers after TCPOBOP withdrawal were enriched with double-membrane vesicles (Fig. 4A, a, arrows), and some of them seemed to have enveloped ER inside the vesicles (Fig. 4A, d, arrows). Autolysosomes and lysosomes were enriched with electron-dense single-membrane vesicles with little ER or mitochondrial contamination (Fig. 4A, b and c). The ER fraction was abundant with ER vesicles that had ribosomes decorating the surface of the ER (Fig. 4A, e and f, arrows). Western blotting analysis also revealed that isolated autophagosomes, autolysosomes, and lysosomes were abundant with LC3-II and lysosomal-associated membrane protein 1 (Lamp1, a lysosomal membrane protein) (Fig. 4B), which is consistent with previous reports (17, 18). Furthermore, only the lysosomal and autolysosomal fractions contained matured cathepsin B. These results, together with our EM studies, indicate that the cellular fractions we isolated were relatively pure. More importantly, the isolated autophagosomes, autolysosomes, and lysosomes contained the ER proteins RTN4 and CYP2B10 only after withdrawal of TCPOBOP administration but not vehicle control (DMSO) (Fig. 4B). Of those, isolated autophagosomes and autolysosomes also had increased p62 protein in the TCPOBOP withdrawal group compared with the vehicle control group (Fig. 4B). These results indicate that excess ER is indeed enveloped specifically by autophagosomes/autolysosomes for their autophagic degradation after withdrawal of TCPOBOP administration.
FIGURE 3.
Increased number of GFP-LC3 positive autophagosomes that contain ER in mouse liver after withdrawal of TCPOBOP administration. Male GFP-LC3 transgenic mice were treated as in Fig. 1, and liver cryosections were analyzed by fluorescence microscopy. A, representative GFP-LC3 fluorescence images. The enlarged photograph is from the boxed area. B, the number of GFP-LC3 puncta (mean ± S.E.) was quantified. More than 30 cells were counted in each individual section from three different mice. *, p < 0.05 compared with the day 0 group (one-way ANOVA). C, total liver lysates were subjected to immunoblot analysis. Representative blots from three independent experiments are shown. D, mouse liver samples were processed for EM (a–e) and immuno-EM (f and g) analysis. a, vehicle (DMSO). b, TCPOBOP (day 3). c, an enlarged photograph from the boxed area in b. d and e, representative images of autophagosomes that contain ER (erphagy) from mouse liver after withdrawal of TCPOBOP. f and g, representative GFP-labeled double-membrane autophagosomes. Arrows, ER; M, mitochondrion; N, nucleus. E, the number of autophagosomes (F) and the number of autophagosomes contained ER in mouse hepatocytes after withdrawal of DMSO and TCPOBOP administration was quantified (mean ± S.E., n = 3, more than 30 different cells were counted from each mouse). *, p < 0.05 compared with the day 0 group (Student's t test). AV, autophagosomes. Scale bars represent 20 μm.
FIGURE 4.
Isolated autophagosomes/autolysosomes contain ER from mouse livers after withdrawal of TCPOBOP administration. Male WT mice were treated as described in Fig. 1. Mice were sacrificed on day 3 after withdrawal of either DMSO or TCPOBOP administration, followed by mouse liver fractionation. A, all fractions were then fixed and processed for EM studies. a, autophagosomes. Arrows denote double-membrane autophagosomes. d, an enlarged photograph from the boxed area in a. Arrows denote enveloped ER in the autophagosome. b, autolysosomes. c, lysosomes. e, ER. f, an enlarged photograph of the boxed area in e. Arrows denotes ribosomes. B, proteins from total liver lysates (30 μg), ER, autolysosome (AL), lysosome (Ly), and autophagosome (AV) fractions (5 μg) were subjected to immunoblot analysis. Asterisk, nonspecific band.
Pharmacological Inhibition of Autophagy Led to Sustained Accumulation of ER Proteins after Withdrawal of TCPOBOP
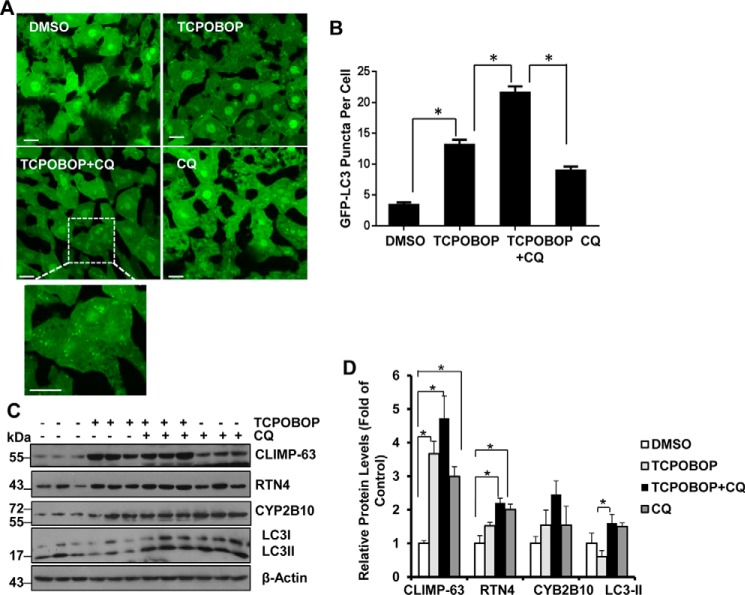
GFP-LC3 mice were treated with chloroquine (CQ) to inhibit autophagic degradation after withdrawal of TCPOBOP (Fig. 1B) (19, 20). CQ treatment further increased the number of GFP-LC3 puncta in hepatocytes after withdrawal of TCPOBOP administration, indicating induction of autophagic flux (Fig. 5A-B). Interestingly, we found that ER proteins (CLIMP-63, RTN4 and CYP2B10) increased in the presence of CQ after withdrawal of TCPOBOP compared with the TCPOBOP withdrawal group alone, although it did not reach statistical difference (Fig. 5, C and D). These results indicate that suppression of autophagy by CQ inhibits ER turnover after withdrawal of TCPOBOP. Furthermore, we found that the levels of most of these ER proteins were also increased by CQ treatment alone, indicating that basal autophagy may also regulate ER homeostasis under physiological conditions.
FIGURE 5.
Suppression of autophagy by CQ leads to sustained accumulation of ER proteins. Male GFP-LC3 transgenic mice were treated as described in Fig. 1B. Liver cryosections were analyzed by fluorescence microscopy, and representative images are shown in A. Bottom panel, an enlarged photograph from the boxed area. B, the number of GFP-LC3 puncta (mean ± S.E.) was quantified. More than 30 cells were counted in each individual section from three different mice. *, p < 0.05 (one-way ANOVA). C and D, WT mice were treated as in A, and total liver lysates were subjected to immunoblot analysis (C) followed by densitometry analysis (D). All proteins were normalized to the loading control β-actin and are presented as the -fold over vehicle control groups (mean ± S.E., n = 3). *, p < 0.05; one-way ANOVA. Scale bars represent 20 μm.
ER Proteins Are Persistently Accumulated in Li-Atg5 KO Mice after Withdrawal of TCPOBOP
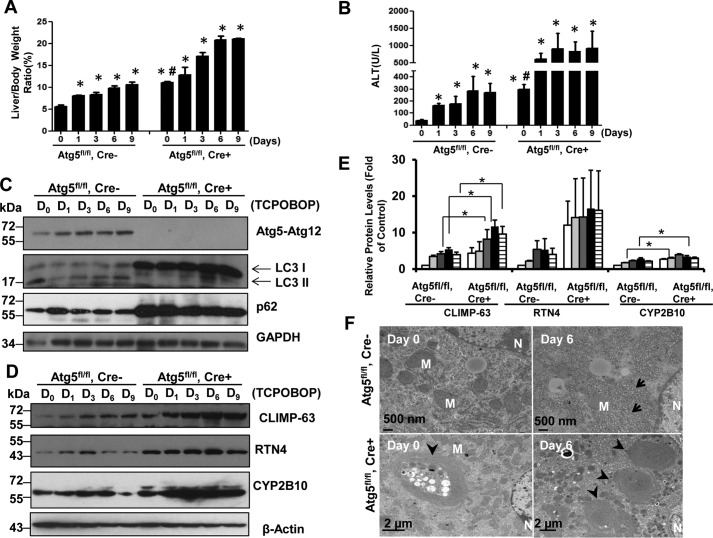
Similar to the observations in GFP-LC3 mice (Fig. 2, A and B), we found that the liver-to-body weight ratio and serum ALT levels were increased after withdrawal of TCPOBOP in Atg5 WT (Atg5fl/fl, Cre−) mice (Fig. 6, A and B). Although Li-Atg5 KO mice already had increased liver-to-body weight ratio and serum ALT levels, as we reported previously (20), they were further elevated after withdrawal of TCPOBOP administration (Fig. 6, A and B), indicating that activation of CAR by TCPOBOP may be independent of Atg5. The deletion of Atg5 was confirmed by Western blotting analysis showing absence of the Atg5-Atg12 conjugation form, lack of LC3-II but increased LC3-I forms, as well as increased p62 levels (Fig. 6C). After withdrawal of TCPOBOP, the levels of CLIMP-63, RTN4, and CYP2B10 increased as early as day 1 and declined on day 9 in WT mice. In contrast, we found that Li-Atg5 KO mice already had increased expression of all ER proteins we assessed, suggesting that blocking basal autophagy is sufficient to increase ER content in liver. After withdrawal of TCPOBOP, the levels of ER proteins further increased slightly compared with day 0, and these ER proteins persistently accumulated even after withdrawal of TCPOBOP in Li-Atg5 KO mice (Fig. 6, D and E). The mRNA levels of CYP2B10 significantly increased after withdrawal of TCPOBOP administration in both WT and Li-Atg5 KO (data not shown), further supporting the notion that TCPOBOP induces CAR activation independent of Atg5. Similar to the GFP-LC3 mice, EM studies revealed increased ER proliferation after withdrawal of TCPOBOP administration in Atg5 WT mice (Fig. 6F). Li-Atg5 KO mice had many aberrant multimembrane structures that were often surrounded by multiple lipid droplets, and these structures were not altered after withdrawal of TCPOBOP. The lack of significant changes in ER content in Li-Atg5 KO mice after withdrawal of TCPOBOP administration supports a critical role for autophagy in regulating hepatic ER homeostasis.
FIGURE 6.
Persistent accumulation of ER proteins in Li-Atg5 KO mice. Atg5 F/F, Cre+ (Li-Atg5 KO), and Atg5 F/F, Cre− mice were treated as in Fig. 1. A and B, ratios of liver to body weight (A) and serum ALT levels (B) were quantified. Data are presented as mean ± S.E. (n ≥ 3). *, p < 0.05 compared with the day 0 group (one-way ANOVA). #, p < 0.05 Atg5 F/F, Cre+ versus Atg5 F/F, Cre− mice (Student's t test). C–E, total liver lysates were subjected to immunoblot analysis (C and D) followed by densitometry analysis (E). All proteins were normalized to the loading control β-actin and are presented as -fold over vehicle control groups (mean ± S.E., n = 3). *, p < 0.05; one-way ANOVA. D, day. F, liver samples were processed for EM, and representative images are shown. Arrows, ER; arrowheads, aberrant ER membranes; M, mitochondrion; N, nucleus.
TCPOBOP Administration-induced ER Proliferation and Induction of CYP2B10 Are CAR-dependent
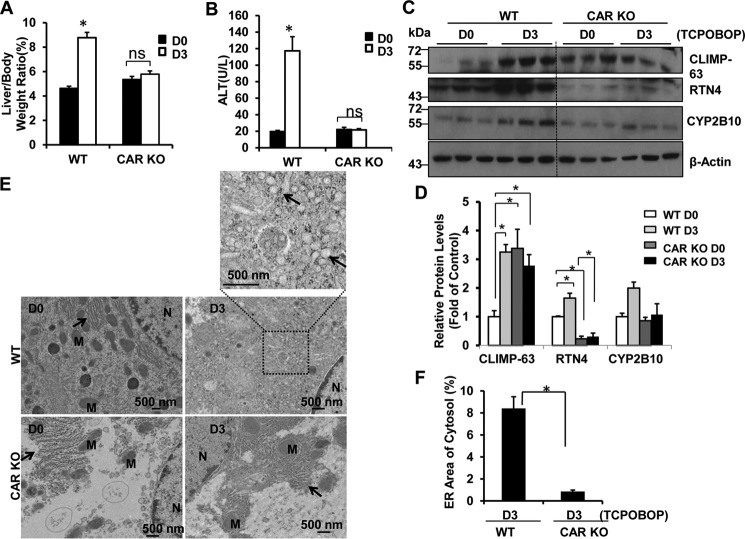
To determine whether ER proliferation and induction of CYP2B10 after withdrawal of TCPOBOP were dependent on CAR, we assessed the liver weight and levels of CLIMP-63, RTN4, and CYP2B10 on days 0 and 3 after withdrawal of TCPOBOP in WT and CAR KO mice. We found that WT mice had an increased ratio of liver to body weight and serum ALT levels after withdrawal of TCPOBOP that were completely inhibited in CAR KO mice (Fig. 7, A and B). Furthermore, we found that WT mice had increased levels of CLIMP-63, RTN4, and CYP2B10 proteins after withdrawal of TCPOBOP for 3 days that were not seen in CAR KO mice (Fig. 7, C and D). EM studies revealed increased ER content after withdrawal of TCPOBOP administration in WT mice, but the ER content remained at low levels in CAR KO mice (Fig. 7, E and F).
FIGURE 7.
CAR KO mice do not have accumulation of ER proteins after withdrawal of TCPOBOP administration. Male CAR KO and WT mice were treated with TCPOBOP (3 mg/kg) once a day for 3 consecutive days, and mice were sacrificed 3 days after withdrawal of TCPOBOP administration. A and B, the ratio of the liver to body weight (A) and serum ALT levels (B) were quantified. Data are presented as mean ± S.E. (n = 3). ns, no statistical difference (Student's t test). C and D, total liver lysates were subjected to Western blotting analysis (C) followed by densitometry analysis (D). All proteins were normalized to the loading control β-actin are and presented as -fold over vehicle control groups (mean ± S.E., n = 3). *, p < 0.05; one-way ANOVA. E, liver samples were processed for EM, and representative images are shown. Arrows, ER; N, nucleus; M, mitochondrion. F, ER areas in the cytosol were quantified using ImageJ software as described under “Materials and Methods.” Data are presented as the percentage of the volume of the ER versus cytosol area (mean ± S.E., n = 3). EM images from three different mice are shown, and more than 10 cell sections were randomly selected and quantified in a blinded fashion from each mouse. *, p < 0.05 (Student's t test).
p62 Localized in the ER and Was Associated with Erphagy after Withdrawal of TCPOBOP
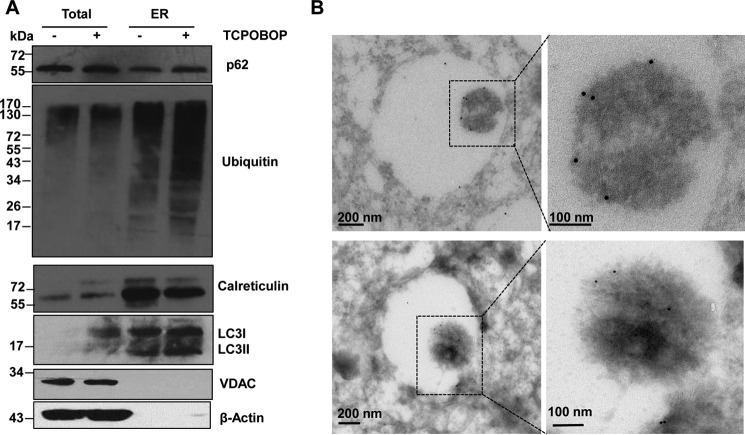
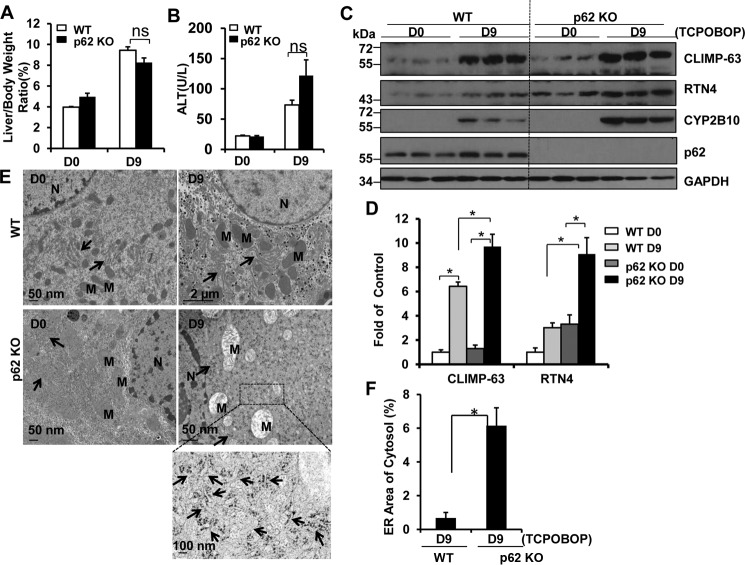
We found that hepatic ER contained a remarkable amount of ubiquitinated proteins, and the levels of ubiquitinated proteins increased after withdrawal of TCPOBOP administration. Interestingly, we found that p62 and LC3-II localized to the ER fractions isolated from mouse livers, and the levels of p62 and LC3-II that were associated with the ER increased after withdrawal of TCPOBOP (Fig. 8A). The isolated ER fractions were not contaminated with mitochondria or cytosol, as demonstrated by the lack of the mitochondrial marker voltage-dependent anion channel (VDAC) and the cytosolic marker β-actin but, instead, had much higher calreticulin levels. Immuno-EM studies revealed that ER-like content enveloped in the autophagosomes was labeled positive for p62 (Fig. 8B). These results suggest that the autophagy receptor protein p62 may be involved in the removal of the ER in hepatocytes. To further determine the role of p62 in the removal of excess ER after withdrawal of TCPOBOP in mouse livers, we assessed the levels of CLIMP-63, RTN4, and CYP2B10 on days 0 and 9 after withdrawal of TCPOBOP in WT and p62 KO mice. The reason why we chose this time point was because the ER content returns to the basal levels in WT mice on day 9 after withdrawal of TCPOBOP, and if p62 would be important for selective autophagic removal of ER, then the ER content should remain at higher levels on day 9 after withdrawal of TCPOBOP in p62 KO mice. Similar to WT mice, after withdrawal of TCPOBOP, the ratio of liver to body weight and ALT levels increased in p62 KO mice (Fig. 9, A and B). However, we found that the levels of ER proteins were much higher in p62 KO mice than in matched WT mice after withdrawal of TCPOBOP (Fig. 9, C and D). EM studies revealed increased ER content after withdrawal of TCPOBOP administration in p62 KO mice compared with matched WT mice (Fig. 9, E and F). Taken together, these data suggest that p62 is associated with autophagic removal of excess ER in hepatocytes after withdrawal of TCPOBOP.
FIGURE 8.
p62 is associated with hepatic ER and autophagosomes in hepatocytes. Male WT mice were either treated with DMSO vehicle or TCPOBOP (3 mg/kg) once a day for 3 consecutive days, and mice were sacrificed 3 days after withdrawal of DMSO or TCPOBOP administration. The mouse hepatic ER fraction was isolated using discontinuous Nycodenz gradient centrifugation as described under “Materials and Methods.” A, equal amounts of proteins from total liver lysates and ER were subjected to immunoblot analysis. B, mouse liver samples were processed for immuno-EM analysis using an anti-p62 antibody. Arrows denote tubular ER structures that are p62-positive. VDAC was used as a loading control for mitochondria.
FIGURE 9.
p62 KO mice had increased accumulation of ER proteins after withdrawal of TCPOBOP administration. Male p62 KO and matched WT mice were treated with TCPOBOP (3 mg/kg) once a day for 3 consecutive days, and mice were sacrificed 9 days after withdrawal of TCPOBOP administration. A and B, the ratio of the liver to body weight (A) and serum ALT levels (B) were quantified. Data are presented as mean ± S.E. (n ≥ 3). ns, no statistical difference (Student's t test). D, day. C and D, total liver lysates were subjected to Western blotting analysis (C) followed by densitometry analysis (D). All proteins were normalized to the loading control β-actin and are presented as -fold over vehicle control groups (mean ± S.E., n = 3). *, p < 0.05; one-way ANOVA. E, liver samples were processed for EM, and representative images are shown. Arrows, ER; N, nucleus; M, mitochondria. F, ER areas in the cytosol were quantified using ImageJ software as described under “Materials and Methods.” Data were presented as the percentage of the volume of the ER versus the cytosol area (mean ± S.E., n = 3). EM images from three different mice are shown, and more than 10 cell sections were randomly selected and quantified in a blinded fashion from each mouse. *, p < 0.05 (Student's t test).
Discussion
Autophagic removal of damaged or excess organelles such as mitochondria (mitophagy), peroxisomes (pexophagy), and the ER (erphagy) plays a critical role in regulating the homeostasis of hepatocytes and other type of cells. During red blood cell maturation, the cellular organelles, including mitochondria, are eliminated to form mature erythrocytes. Several recent studies indicate that the clearance of mitochondria is impaired in ULK1, Atg7, and NIX (Nip3-like protein X) knockout mouse reticulocytes, suggesting that the removal of mitochondria from reticulocytes is dependent on autophagy (21, 22). In addition, the removal of excess peroxisomes was impaired in Atg7 KO mouse livers (23). In mammals, the liver is a vital and major site for drug metabolism, and the ER in liver cells serves as the central hub by expressing key metabolism enzymes of CYPs. More than 50% of drugs are metabolized in the liver and are oxidized by the hepatic CYPs (24). To meet the needs for the metabolism of xenobiotics, liver cells need to quickly produce more CYPs, which requires increased proliferation of ER. After completing the mission of drug metabolism, cells must get rid of the excess ER and CYPs to reach cellular homeostasis. Using TCPOBOP, a potent CAR agonist and hepatic CYP2B inducer, we recapitulated the dynamic changes of an initial rise followed by a decrease of ER content and CYP2B levels in mouse livers after TCPOBOP withdrawal. More importantly, based on the pharmacological and genetic intervention of the autophagic process, our study convincingly supports the notion that autophagy plays a critical role in the removal of excess hepatic ER. It should also be noted that CYP-mediated metabolism of xenobiotics often leads to the generation of free oxygen radicals and reactive metabolites that can, in turn, functionally and structurally damage CYP. Several CYP enzymes have been shown to be ubiquitinated and proteolytically degraded by the ubiquitin proteasome system (25). However, it is not known whether the autophagy-lysosomal pathway may also participate in the disposal of excess/or damaged CYP enzymes. In this study, we found that both pharmacological and genetic inhibition of autophagy increased CYP2B expression after TCPOBOP withdrawal. It should be noted that chronic deletion of either Atg5 or Atg7 in the mouse livers leads to activation of Nrf2, which increases the gene expression of CYP2B (26, 27). Therefore, it is possible that persistent activation of Nrf2 in LI-Atg5 KO mice may also contribute to the increased CYP2B after TCPOBOP withdrawal. However, CQ treatment alone also increased CYP2B levels in mouse livers without obvious activation of Nrf2. Moreover, it is reported that deletion of Atg7 in the mouse liver does not affect proteasome activity (28). Therefore, our results suggest that autophagy may regulate the homeostasis of hepatic CYP by promoting autophagy-lysosomal degradation of CYP in addition to the proteasome.
Although the mechanisms for selective autophagy are not well understood, increasing evidence suggests that ubiquitination of cargos and subsequent recruitment of the ubiquitin-binding autophagy receptor complex is important for selective autophagy. Several autophagy receptor proteins have been identified, including p62, NBR1, NDP52, optineurin, and ALFY, that are either important for selective removal of organelles, invading pathogens, or protein aggregates (2, 3, 5). In general, all of these receptor proteins except ALFY share a conserved LC3-interacting region. Among them, p62 has been shown to play a role in selective autophagy for mitochondria, although its exact role is still controversial (29–32). In addition to selective mitophagy, several receptors for selective erphagy have also reported recently. A recent study showed that BNIP3, a Bcl-2 family protein that has a BH3 domain, an LC3-interacting region motif, and a C-terminal transmembrane domain that normally targets it to mitochondria, could also target to ER, although the amount of BNIP3 on ER was much less than mitochondria (33). Furthermore, ectopic overexpression of BNIP3 on ER increased the colocalization of ER with GFP-LC3 puncta and might promote the removal of ER via autophagy. Moreover, two recent studies independently identified Atg40 and FAM134B (both have a reticulon domain that may bind with the ER membrane and an LC3-interacting region that can directly bind with Atg8/LC3) for selective erphagy in yeast and mammalian cells, respectively (10, 11).
In this study, we found that hepatic ER contained a remarkable amount of p62. In contrast to Atg40 and FAM134B, p62 does not have a transmembrane domain or reticulon domain that can be associated with the ER membrane. Its localization on the ER is likely a secondary effect, which is most likely due to its capability of binding with ubiquitinated proteins. Indeed, we also found that there was a remarkable amount of ubiquitinated proteins on isolated ER fractions, which was further increased after withdrawal of TCPOBOP administration. It is likely that p62 further recruits LC3-II-positive autophagosomes to the ubiquitin-p62-decorated ER to initiate selective erphagy. The finding that there was increased LC3-II in ER fractions isolated from mouse livers and increased p62 in autophagosomes and autolysosomes after withdrawal of TCPOBOP administration might support this notion. It has been previously shown that siRNA knockdown of either p62 or NBR1 resulted in the accumulation of peroxisomes in HeLa cells, which indicates the involvement of p62 and NBR1 in selective pexophagy (34). Similar to p62 and NBR1-mediated pexophagy, we found that hepatic ER content was markedly higher after withdrawal of TCPOBOP administration in p62 KO mice than in WT mice. Our results thus support the notion that p62 may be involved in selective erphagy similar to its role in other selective types of autophagy. It is highly likely that multiple receptor proteins may be involved in selective autophagy, including erphagy. Although FAM134B is highly expressed in neuronal tissues and implicated in neuropathy, future studies are needed to determine whether FAM134B also plays a role in selective erphagy in the liver. In summary, our findings demonstrate that excess hepatic ER after withdrawal of the xenobiotic TCPOBOP is removed via autophagy (erphagy) that is associated with autophagy receptor protein p62. Moreover, our findings also suggest that excess hepatic CYP may be degraded via autophagy. Because of the increasing interest in clinical trials for modulating autophagy together with other treatments for treating human diseases, attention should be paid to possible altered drug-drug interactions because of the changes in drug metabolism enzymes such as CYP caused by autophagy manipulation.
Materials and Methods
Antibodies
The antibodies used in the study were as follows: GFP (Santa Cruz Biotechnology, sc-9996), p62/SQSTM1 (Abnova, H00008878-M01), Lamp1 (Developmental Studies Hybridoma Bank, 1D4B), β-actin (Sigma, a5541), GAPDH (Cell Signaling Technology, 2118), Atg5 (MBL, PM050), CLIMP-63 (Proteintech, 16686-1-AP), RTN4 (Proteintech, 10740-1-AP), ubiquitin (Santa Cruz Biotechnology, sc-8017), calnexin (Santa Cruz Biotechnology, sc-11397), CYP2B (Santa Cruz Biotechnology, sc-53242), and calreticulin (BD Biosciences, 612136). The rabbit polyclonal anti-LC3 antibody was described previously (35). The secondary antibodies used in this study were HRP-conjugated goat anti-mouse (Jackson ImmunoResearch Laboratories, 115-035-062) and rabbit antibodies (Jackson ImmunoResearch Laboratories, 111-035-045).
Animal Experiments
All animals received humane care. All procedures were approved by the Institutional Animal Care and Use Committee of the University of Kansas Medical Center. GFP-LC3 transgenic (C57BL/6J) and B6J;129-Atg5fl/fl mice were generated by Dr. Mizushima and were purchased from RIKEN (Japan) (36, 37). Atg5fl/fl mice were backcrossed to C57BL/6J for at least five generations. To induce the liver specific knockout of Atg5, we further crossed the mice with B6J-Tg (Alb-Cre) mice as described previously (27). p62 KO mice were generated by deletion of Sqstm1 exons 1–4 from a trifloxed targeted mutation allele using the MeuCre40 mice described before (38). Breeder pairs from the CAR KO mouse line on the C57BL/6 background were described previously (39). Male mice were given either DMSO diluted in saline to a final concentration of 3% or TCPOBOP (3 mg/kg, dissolved in DMSO at 10 mg/ml and further diluted in saline to 0.3 mg/ml) via gavage once a day for 3 consecutive days. The day 0 group consisted of mice that were sacrificed at 24 h after withdrawal of administration of DMSO. The day 1, 3, 6, 9, and 12 groups consisted of mice that were sacrificed 1, 3, 6, 9 and 12 days after the last administration of TCPOBOP (withdrawal of TCPOBOP administration).
To inhibit autophagy and determine autophagic flux in vivo, mice were treated either with DMSO or TCPOBOP once a day for 3 consecutive days in the first 3 days. Mice were further treated with CQ (60 mg/kg) by one single intraperitoneal injection per day on days 2, 4, and 6 after withdrawal of the administration of either DMSO or TCPOBOP. Then all mice were sacrificed 4 h after the last administration of CQ on day 6. The serum level of ALT was measured using an assay kit purchased from Pointe Scientific as we described previously (20).
Real-time PCR
RNA was isolated from mouse livers using TRIzol (Invitrogen) and reverse-transcribed into complementary DNA by RevertAid reverse transcriptase (Fermentas). Real-time PCR was used to quantify CYP2E1, CYP2B10, CYP3A11, Atg8/MAP1LC3B, BiP/GRP78, and β-actin and performed on an Applied Biosystems Prism 7900HT real-time PCR instrument (ABI, Foster City, CA) using Maxima SYBR Green/Rox quantitative PCR reagents (Fermentas). The sequences of the primers were as follows: β-actin forward, 5′-TGT TAC CAA CTG GGA CGA CA-3′; β-actin reverse, 5′-GGG GTG TTG AAG GTC TCA AA-3′; Cyp2e1 forward, 5′-TGG TGG AGG AGC TCA AAA AG-3′; Cyp2e1 reverse, 5′-GTG TTC CTT GGC TTT TCC AA-3′; Cyp2b10 forward, 5′-CAA TGG GGA ACG TTG GAA GA-3′; Cyp2b10 reverse, 5′-TGA TGC ACT GGA AGA GGA AC-3′; Cyp3a11 forward, 5′-CTC AAT GGT GTG TGT ATA TCC CC-3′; Cyp3a11 reverse, 5′-CCG ATG TTC TTA GAC ACT GCC-3′; Map1lc3b forward, 5′-CCG AGA AGA CCT TCA AGC AG-3′; and Map1lc3b reverse, 5′-ACA CTT CGG AGA TGG GAG TG-3′.
Subcellular Fractionation
Subcellular fractionation of the liver was conducted as described previously with modifications (17, 40). Wild-type male mice were treated with DMSO or TCPOBOP (3 mg/kg) via gavage once a day for 3 consecutive days. After withdrawal of DMSO or TCPOBOP administration, mice were starved overnight on day 2 and sacrificed on day 3. Livers were minced in 0.25 m sucrose and homogenized with a Dounce homogenizer. The homogenate was diluted and centrifuged at 2000 × g for 5 min. The pellet was suspended and centrifuged one more time. The pooled supernatants were then centrifuged at 17,000 × g for 12 min. The supernatants were collected from the previous centrifugation and further centrifuged at 100,000 × g for 1 h. The resulting supernatant was cytosol, and the pellet was enriched with ER. The resulting pellet from the previous centrifugation was resuspended in 1.9 ml of 0.25 m sucrose and mixed with 2.8 ml of 85.6% Nycodenz (Accurate Chemical and Scientific), resulting in a total of 4.7 ml of 50% Nycodenz solution and half of the solution was further layered with 4 ml of 26%, 2 ml of 24%, 2 ml of 20%, and 2 ml of 15% Nycodenz. After centrifugation at 247,000 × g for 3 h using a SW41 rotor (Beckman Instruments, Spinco Division, Palo Alto, CA), each fraction was collected by a syringe, and they were as follows: 15–20% interphase (autophagosome), 20–24% interphase (autolysosome), 24–26% interphase (lysosomes), and 50–26% interphase (mitochondria). Each fraction was further diluted in 0.25 m sucrose and centrifuged at 24,000 × g for 10 min, and the final pellets were resuspended in 0.25 m sucrose supplemented with protease inhibitors.
Immunoblot Assay
Total liver lysates were prepared using radioimmune precipitation assay buffer (1% Nonidet P-40, 0.5% sodium deoxycholate, and 0.1% sodium dodecyl (lauryl) sulfate) supplemented with protease inhibitors. Thirty micrograms of liver lysates from each sample or from the subcellular fractionations was separated by SDS-polyacrylamide gel electrophoresis and transferred to polyvinylidene fluoride membranes. The membranes were stained with primary antibodies followed by secondary HRP-conjugated antibodies. The membranes were further developed with SuperSignal West Pico chemiluminescent substrate (Pierce).
Fluorescence and Electron Microscopy
Cryosection of GFP-LC3 transgenic mouse livers was performed as described previously (19, 20), and the fluorescence images were digitally acquired with a Nikon Eclipse 200 inverted fluorescence microscope. For EM studies, liver tissues or cellular fractions were fixed with 2.5% glutaraldehyde in 0.1 mol/liter phosphate buffer (pH 7.4) followed by 1% OsO4. After dehydration, thin sections were stained with uranyl acetate and lead citrate for observation under a JEM 1011CX electron microscope (JEOL). Images were acquired digitally. The average number of autophagosomes from each cell was determined from a randomly selected pool of 15–20 fields under each condition. Immuno-EM was performed as described previously (41). GFP-LC3 mice were treated with TCPOBOP (3 mg/kg) once a day for 3 consecutive days. Three days after withdrawal of TCPOBOP administration, mice were sacrificed, and liver tissues were fixed in 2% paraformaldehyde/0.01% glutaraldehyde in PBS. Cells were pelleted in 3% gelatin in PBS and solidified on ice. Small blocks (∼0.5 mm) of the cell pellet were prepared and infiltrated with 2.3 m sucrose at 4 °C overnight. Blocks were mounted on aluminum stubs, frozen, and sectioned. The sections (60 nm) were picked up in drops of 2.3 m sucrose and collected on formvar-coated mesh grids. After blocking in 1% BSA in PBS, the sections were incubated with an anti-GFP antibody or anti-p62 antibody and subsequently incubated with a secondary antibody conjugated with 10 nm gold particles. The sections were fixed in 1% glutaraldehyde and stained with ice-cold 0.4% uranyl acetate/1% methyl cellulose (pH 4) and dried.
ER Volume Quantification
Digital images from the control (day 0) group and day 3 and day 9 groups after withdrawal of TCPOBOP administration were obtained using a JEM 1011CX electron microscope. The ER areas were manually selected, and the volume of the ER (areas of the ER lumen) and areas of the cytosol were calculated using ImageJ software. The results were generated from careful threshold and particle analysis of each image. The circularity and particle size settings of the analysis were changed according to the shape of the ER. Data are presented as the percentage of the volume of the ER versus the cytosol area. More than 10 cell sections were randomly selected and quantified in a double-blinded fashion from at least three different mice.
Statistical Analysis
Statistical analysis was conducted with one-way ANOVA followed by a Holm-Sidak test or by Student's t test as indicated. p < 0.05 was considered significant.
Author Contributions
Y. H. and H. M. N. performed the experiments for TCPOBOP and data analysis. F. G performed the immuno-EM experiments. Y. D designed software and quantified the ER volume imaging data. P. L., L. F. F., T. R., C. S., V. C. S., and K. Z. generated the p62 KO mice. Y. C. generated the CAR KO mice. M. K. generated the adenovirus for p62. Y. H. S., J. F., and W. X. D. conceived and supervised the project. Y. H., J. F., and W. X. D. wrote the manuscript.
Acknowledgments
We wish to acknowledge the Electron Microscopy Research Laboratory (EMRL) facility for assistance with electron microscopy. The EMRL is supported in part by National Institutes of Health COBRE Grant 9P20GM104936. The JEOL JEM-1400 transmission electron microscope used in the study was purchased with funds from National Institutes of Health Grant S10RR027564. We thank Dr. Noboru Mizushima (University of Tokyo, Japan) for providing reagents and Dr. Ana Maria Cuervo (Albeit Einstein College of Medicine) for providing guidance on the isolation of lysosomes. Y. D. was a summer intern from Blue Valley North High School in Kansas.
This work was supported in part by the National Institute on Alcohol Abuse and Alcoholism Grants R01 AA020518 and R01 DK102142 (to W. X. D.); National Center for Research Resources Grant 5P20RR021940-07; NIGMS, National Institutes of Health Grant 8 P20 GM103549-07; and National Natural Science Foundation of China Grants 81030038 and 81272389 (to J. F.). The authors declare that they have no conflicts of interest with the contents of this article. The content is solely the responsibility of the authors and does not necessarily represent the official views of the National Institutes of Health.
- ER
- endoplasmic reticulum/reticula
- CYP
- cytochrome P-450
- TCPOBOP
- 1,4-bis[2-(3,5-dichloropyridyloxy)] benzene
- CAR
- constitutive androstane receptor
- ALT
- alanine aminotransferase
- CQ
- chloroquine
- ALFY
- autophagy-linked FYVE protein
- ANOVA
- analysis of variance.
References
- 1. He C., and Klionsky D. J. (2009) Regulation mechanisms and signaling pathways of autophagy. Annu. Rev. Genet. 43, 67–93 [DOI] [PMC free article] [PubMed] [Google Scholar]
- 2. Park C., and Cuervo A. M. (2013) Selective autophagy: talking with the UPS. Cell Biochem. Biophys. 67, 3–13 [DOI] [PMC free article] [PubMed] [Google Scholar]
- 3. Johansen T., and Lamark T. (2011) Selective autophagy mediated by autophagic adapter proteins. Autophagy 7, 279–296 [DOI] [PMC free article] [PubMed] [Google Scholar]
- 4. Shaid S., Brandts C. H., Serve H., and Dikic I. (2013) Ubiquitination and selective autophagy. Cell Death Differ. 20, 21–30 [DOI] [PMC free article] [PubMed] [Google Scholar]
- 5. Manley S., Williams J. A., and Ding W. X. (2013) Role of p62/SQSTM1 in liver physiology and pathogenesis. Exp. Biol. Med. 238, 525–538 [DOI] [PMC free article] [PubMed] [Google Scholar]
- 6. van Anken E., Romijn E. P., Maggioni C., Mezghrani A., Sitia R., Braakman I., and Heck A. J. (2003) Sequential waves of functionally related proteins are expressed when B cells prepare for antibody secretion. Immunity 18, 243–253 [DOI] [PubMed] [Google Scholar]
- 7. Koning A. J., Roberts C. J., and Wright R. L. (1996) Different subcellular localization of Saccharomyces cerevisiae HMG-CoA reductase isozymes at elevated levels corresponds to distinct endoplasmic reticulum membrane proliferations. Mol. Biol. Cell 7, 769–789 [DOI] [PMC free article] [PubMed] [Google Scholar]
- 8. Lum P. Y., and Wright R. (1995) Degradation of HMG-CoA reductase-induced membranes in the fission yeast, Schizosaccharomyces pombe. J. Cell Biol. 131, 81–94 [DOI] [PMC free article] [PubMed] [Google Scholar]
- 9. Bernales S., McDonald K. L., and Walter P. (2006) Autophagy counterbalances endoplasmic reticulum expansion during the unfolded protein response. PLoS Biol. 4, e423. [DOI] [PMC free article] [PubMed] [Google Scholar]
- 10. Khaminets A., Heinrich T., Mari M., Grumati P., Huebner A. K., Akutsu M., Liebmann L., Stolz A., Nietzsche S., Koch N., Mauthe M., Katona I., Qualmann B., Weis J., Reggiori F., et al. (2015) Regulation of endoplasmic reticulum turnover by selective autophagy. Nature 522, 354–358 [DOI] [PubMed] [Google Scholar]
- 11. Mochida K., Oikawa Y., Kimura Y., Kirisako H., Hirano H., Ohsumi Y., and Nakatogawa H. (2015) Receptor-mediated selective autophagy degrades the endoplasmic reticulum and the nucleus. Nature 522, 359–362 [DOI] [PubMed] [Google Scholar]
- 12. Masaki R., Yamamoto A., and Tashiro Y. (1987) Cytochrome P-450 and NADPH-cytochrome P-450 reductase are degraded in the autolysosomes in rat liver. J. Cell Biol. 104, 1207–1215 [DOI] [PMC free article] [PubMed] [Google Scholar]
- 13. Feldman D., Swarm R. L., and Becker J. (1980) Elimination of excess smooth endoplasmic reticulum after phenobarbital administration. J. Histochem. Cytochem. 28, 997–1006 [DOI] [PubMed] [Google Scholar]
- 14. Wei P., Zhang J., Egan-Hafley M., Liang S., and Moore D. D. (2000) The nuclear receptor CAR mediates specific xenobiotic induction of drug metabolism. Nature 407, 920–923 [DOI] [PubMed] [Google Scholar]
- 15. Ni H. M., Bockus A., Wozniak A. L., Jones K., Weinman S., Yin X. M., and Ding W. X. (2011) Dissecting the dynamic turnover of GFP-LC3 in the autolysosome. Autophagy 7, 188–204 [DOI] [PMC free article] [PubMed] [Google Scholar]
- 16. Hosokawa N., Hara Y., and Mizushima N. (2006) Generation of cell lines with tetracycline-regulated autophagy and a role for autophagy in controlling cell size. FEBS Lett. 580, 2623–2629 [DOI] [PubMed] [Google Scholar]
- 17. Koga H., Kaushik S., and Cuervo A. M. (2010) Altered lipid content inhibits autophagic vesicular fusion. FASEB J. 24, 3052–3065 [DOI] [PMC free article] [PubMed] [Google Scholar]
- 18. Eskelinen E. L., Illert A. L., Tanaka Y., Schwarzmann G., Blanz J., Von Figura K., and Saftig P. (2002) Role of LAMP-2 in lysosome biogenesis and autophagy. Mol. Biol. Cell 13, 3355–3368 [DOI] [PMC free article] [PubMed] [Google Scholar]
- 19. Ding W. X., Li M., Chen X., Ni H. M., Lin C. W., Gao W., Lu B., Stolz D. B., Clemens D. L., and Yin X. M. (2010) Autophagy reduces acute ethanol-induced hepatotoxicity and steatosis in mice. Gastroenterology 139, 1740–1752 [DOI] [PMC free article] [PubMed] [Google Scholar]
- 20. Ni H. M., Bockus A., Boggess N., Jaeschke H., and Ding W. X. (2012) Activation of autophagy protects against acetaminophen-induced hepatotoxicity. Hepatology 55, 222–232 [DOI] [PMC free article] [PubMed] [Google Scholar]
- 21. Schweers R. L., Zhang J., Randall M. S., Loyd M. R., Li W., Dorsey F. C., Kundu M., Opferman J. T., Cleveland J. L., Miller J. L., and Ney P. A. (2007) NIX is required for programmed mitochondrial clearance during reticulocyte maturation. Proc. Natl. Acad. Sci. U.S.A. 104, 19500–19505 [DOI] [PMC free article] [PubMed] [Google Scholar]
- 22. Kundu M., Lindsten T., Yang C. Y., Wu J., Zhao F., Zhang J., Selak M. A., Ney P. A., and Thompson C. B. (2008) Ulk1 plays a critical role in the autophagic clearance of mitochondria and ribosomes during reticulocyte maturation. Blood 112, 1493–1502 [DOI] [PMC free article] [PubMed] [Google Scholar]
- 23. Iwata J., Ezaki J., Komatsu M., Yokota S., Ueno T., Tanida I., Chiba T., Tanaka K., and Kominami E. (2006) Excess peroxisomes are degraded by autophagic machinery in mammals. J. Biol. Chem. 281, 4035–4041 [DOI] [PubMed] [Google Scholar]
- 24. Cribb A. E., Peyrou M., Muruganandan S., and Schneider L. (2005) The endoplasmic reticulum in xenobiotic toxicity. Drug Metab. Rev. 37, 405–442 [DOI] [PubMed] [Google Scholar]
- 25. Correia M. A., Sadeghi S., and Mundo-Paredes E. (2005) Cytochrome P450 ubiquitination: branding for the proteolytic slaughter? Annu. Rev. Pharmacol. Toxicol. 45, 439–464 [DOI] [PubMed] [Google Scholar]
- 26. Komatsu M., Kageyama S., and Ichimura Y. (2012) p62/SQSTM1/A170: physiology and pathology. Pharmacol. Res. 66, 457–462 [DOI] [PubMed] [Google Scholar]
- 27. Ni H. M., Woolbright B. L., Williams J., Copple B., Cui W., Luyendyk J. P., Jaeschke H., and Ding W. X. (2014) Nrf2 promotes the development of fibrosis and tumorigenesis in mice with defective hepatic autophagy. J. Hepatol. 61, 617–625 [DOI] [PMC free article] [PubMed] [Google Scholar]
- 28. Komatsu M., Waguri S., Ueno T., Iwata J., Murata S., Tanida I., Ezaki J., Mizushima N., Ohsumi Y., Uchiyama Y., Kominami E., Tanaka K., and Chiba T. (2005) Impairment of starvation-induced and constitutive autophagy in Atg7-deficient mice. J. Cell Biol. 169, 425–434 [DOI] [PMC free article] [PubMed] [Google Scholar]
- 29. Ding W. X., Ni H. M., Li M., Liao Y., Chen X., Stolz D. B., Dorn G. W. 2nd, and Yin X. M. (2010) Nix is critical to two distinct phases of mitophagy, reactive oxygen species-mediated autophagy induction and Parkin-ubiquitin-p62-mediated mitochondrial priming. J. Biol. Chem. 285, 27879–27890 [DOI] [PMC free article] [PubMed] [Google Scholar]
- 30. Geisler S., Holmström K. M., Skujat D., Fiesel F. C., Rothfuss O. C., Kahle P. J., and Springer W. (2010) PINK1/Parkin-mediated mitophagy is dependent on VDAC1 and p62/SQSTM1. Nat. Cell Biol. 12, 119–131 [DOI] [PubMed] [Google Scholar]
- 31. Okatsu K., Saisho K., Shimanuki M., Nakada K., Shitara H., Sou Y. S., Kimura M., Sato S., Hattori N., Komatsu M., Tanaka K., and Matsuda N. (2010) p62/SQSTM1 cooperates with Parkin for perinuclear clustering of depolarized mitochondria. Genes Cells 15, 887–900 [DOI] [PMC free article] [PubMed] [Google Scholar]
- 32. Narendra D., Kane L. A., Hauser D. N., Fearnley I. M., and Youle R. J. (2010) p62/SQSTM1 is required for Parkin-induced mitochondrial clustering but not mitophagy; VDAC1 is dispensable for both. Autophagy 6, 1090–1106 [DOI] [PMC free article] [PubMed] [Google Scholar]
- 33. Hanna R. A., Quinsay M. N., Orogo A. M., Giang K., Rikka S., and Gustafsson Å. B. (2012) Microtubule-associated protein 1 light chain 3 (LC3) interacts with Bnip3 protein to selectively remove endoplasmic reticulum and mitochondria via autophagy. J. Biol. Chem. 287, 19094–19104 [DOI] [PMC free article] [PubMed] [Google Scholar]
- 34. Deosaran E., Larsen K. B., Hua R., Sargent G., Wang Y., Kim S., Lamark T., Jauregui M., Law K., Lippincott-Schwartz J., Brech A., Johansen T., and Kim P. K. (2013) NBR1 acts as an autophagy receptor for peroxisomes. J. Cell Sci. 126, 939–952 [DOI] [PubMed] [Google Scholar]
- 35. Ding W. X., Ni H. M., Gao W., Chen X., Kang J. H., Stolz D. B., Liu J., and Yin X. M. (2009) Oncogenic transformation confers a selective susceptibility to the combined suppression of the proteasome and autophagy. Mol. Cancer Ther. 8, 2036–2045 [DOI] [PMC free article] [PubMed] [Google Scholar]
- 36. Hara T., Nakamura K., Matsui M., Yamamoto A., Nakahara Y., Suzuki-Migishima R., Yokoyama M., Mishima K., Saito I., Okano H., and Mizushima N. (2006) Suppression of basal autophagy in neural cells causes neurodegenerative disease in mice. Nature 441, 885–889 [DOI] [PubMed] [Google Scholar]
- 37. Mizushima N., Yamamoto A., Matsui M., Yoshimori T., and Ohsumi Y. (2004) In vivo analysis of autophagy in response to nutrient starvation using transgenic mice expressing a fluorescent autophagosome marker. Mol. Biol. Cell 15, 1101–1111 [DOI] [PMC free article] [PubMed] [Google Scholar]
- 38. Leneuve P., Colnot S., Hamard G., Francis F., Niwa-Kawakita M., Giovannini M., and Holzenberger M. (2003) Cre-mediated germline mosaicism: a new transgenic mouse for the selective removal of residual markers from tri-lox conditional alleles. Nucleic Acids Res. 31, e21. [DOI] [PMC free article] [PubMed] [Google Scholar]
- 39. Aleksunes L. M., and Klaassen C. D. (2012) Coordinated regulation of hepatic phase I and II drug-metabolizing genes and transporters using AhR-, CAR-, PXR-, PPARα-, and Nrf2-null mice. Drug Metab. Dispos. 40, 1366–1379 [DOI] [PMC free article] [PubMed] [Google Scholar]
- 40. Ni H. M., McGill M. R., Chao X., Du K., Williams J. A., Xie Y., Jaeschke H., and Ding W. X. (2016) Removal of acetaminophen-protein adducts by autophagy protects against acetaminophen-induced liver injury in mice. J. Hepatol. 65, 354–362 [DOI] [PMC free article] [PubMed] [Google Scholar]
- 41. Ding W. X., Guo F., Ni H. M., Bockus A., Manley S., Stolz D. B., Eskelinen E. L., Jaeschke H., and Yin X. M. (2012) Parkin and mitofusins reciprocally regulate mitophagy and mitochondrial spheroid formation. J. Biol. Chem. 287, 42379–42388 [DOI] [PMC free article] [PubMed] [Google Scholar]


