

Abstract
Glycolysis is the primary step for major energy production in the cell. There is strong evidence suggesting that glucose consumption and rate of glycolysis are highly modulated by cytosolic pH/[H+], but those can also be stimulated by an increase in the intracellular [HCO3−]. Because proton and bicarbonate shift concomitantly, it remained unclear whether enhanced glucose consumption and glycolytic rate were mediated by the changes in intracellular [H+] or [HCO3−]. We have asked whether glucose metabolism is enhanced by either a fall in intracellular [H+] or a rise in intracellular [HCO3−], or by both, in mammalian astrocytes. We have recorded intracellular glucose in mouse astrocytes using a FRET-based nanosensor, while imposing different intracellular [H+] and [CO2]/[HCO3−]. Glucose consumption and glycolytic rate were augmented by a fall in intracellular [H+], irrespective of a concomitant rise or fall in intracellular [HCO3−]. Transport of HCO3− into and out of astrocytes by the electrogenic sodium bicarbonate cotransporter (NBCe1) played a crucial role in causing changes in intracellular pH and [HCO3−], but was not obligatory for the pH-dependent changes in glucose metabolism. Our results clearly show that it is the cytosolic pH that modulates glucose metabolism in cortical astrocytes, and possibly also in other cell types.
Keywords: astrocyte, bicarbonate, brain metabolism, glucose, metabolism, FRET nanosensor, pH, astrocytes, FRET nanosensors
Introduction
The high energy requirement of the mammalian brain is primarily fueled by the degradation of blood-derived glucose. Astrocytes, the major glial cells in the brain, take up a large portion of blood glucose, and by aerobic glycolysis, they preferably produce more lactate (1, 2). Accumulating evidence suggests that astrocytes metabolically support neurons by releasing lactate, which then could be taken up by neighboring neurons (3, 4). Therefore, glucose metabolism in astrocytes was proposed to be modulated by various means of signals presumably originating from neurons (5, 6). It is well documented that astrocytes respond to neuronal activity with an intracellular alkalinization (7–9). Recently, it was shown that the glycolytic rate in astrocytes can be significantly enhanced by an alkaline pHi shift derived from extracellular K+-induced membrane depolarization enhancing bicarbonate uptake via the electrogenic sodium bicarbonate cotransporter NBCe1 (10), which is highly expressed in mouse cortical astrocytes (11). In fact, cytoplasmic pH is well known to be a potential regulator of glucose metabolism, particularly the glycolytic rate, in various cell types (12–15). However, due to the dynamic chemical equilibrium of pH with [HCO3−] and [CO2], a rise in pHi at a constant [CO2] will also result in a concomitant rise in cytosolic [HCO3−] ([HCO3−]i). Interestingly, a shift in [HCO3−]i can also be a potential signal to a variety of cellular processes, including glucose metabolism (16–19). A rise in [HCO3−]i was shown to stimulate glucose metabolism in astrocytes, via the activation of bicarbonate-dependent soluble adenylyl cyclase (20). The question whether it is the rise in bicarbonate ions or a fall in [H+]i that mediates the cytoplasmic pH-dependent augmentation of the glycolytic rate has not been resolved.
Here we address this question by using intracellular H+ (H+i) imaging and FRET-based intracellular glucose imaging in cultured cortical astrocytes and organotypic hippocampal slices. To functionally dissect the contribution of H+ and HCO3− on glycolysis, we measured the glycolytic rate under different conditions: 1) during a fall in H+i (alkalinization) with either a concomitant fall or rise in intracellular bicarbonate, 2) during a rise in intracellular bicarbonate with either a concomitant fall or rise in [H+]i, and 3) during a fall in [H+]i in the nominal absence of CO2/HCO3−. Our results suggest that the glycolytic rate in astrocytes is primarily augmented by the fall in [H+]i and not by a rise in [HCO3−]i.
Results
We have approached the question whether glucose consumption and glycolysis are stimulated by a fall in [H+i], a rise in bicarbonate, or by both, by measuring glucose in cultured astrocytes and in organotypic slices of mouse hippocampus in culture after imposing different pH and bicarbonate changes in the cells. To change [H+] and [HCO3−] in astrocytes, we equilibrated the superfusing solutions with different [CO2] and [HCO3−] at pH values between 7 and 7.8. To evaluate the role of HCO3− transport into and out of astrocytes, we employed a genetic mouse model with a deletion in the gene for the electrogenic sodium bicarbonate cotransporter NBCe1 (SLC4A4) (21), which is highly expressed in mouse cortical astrocytes (11, 22).
Steady-state Glucose and Glycolytic Rate during Intracellular [H+] Fall, Associated with Either a Concomitant Rise or Fall in [HCO3−]i
In a first set of experiments, we measured cytosolic glucose under conditions that increase the intracellular pH, pHi, accompanied by opposite changes in [HCO3−]i. For this, we changed the pH of the external solution, pHe, from 7.4 to 7.8 either by reducing the [CO2] from 5 to 2% at constant [HCO3−] or by increasing the [HCO3−] from 26 to 61 mm at constant 5% [CO2]. In both solutions, the [H+]i decreased (Fig. 1A), on average by 23 ± 2.7 nm at reduced [CO2], and by 34.4 ± 4.3 mm at raised [HCO3−] (Fig. 1B). From these values, the [HCO3−]i, calculated with the Henderson-Hasselbalch equation, decreased by 7.8 ± 0.6 mm in 2% CO2/26 mm HCO3−, and increased by 10.1 ± 1.4 mm in 5% CO2/61 mm HCO3− (Fig. 1C). Cytosolic alkalinization of astrocytes induced by the exposure of a solution with reduced external [CO2] can be attributed to the diffusion of intracellular CO2 out of the cell. As CO2 leaves the cell, intracellular HCO3− and H+ convert to CO2, which then continues to leave the cell until equilibrium is reached with the external [CO2]. In contrast, cytosolic alkalinization induced by the exposure of a solution with elevated extracellular [HCO3−] at constant [CO2] can be attributed to the inward transport of bicarbonate via NBCe1.
FIGURE 1.

Alkalinization-induced rise in glucose consumption. A and F, recording of intracellular [H+] ([H+]i) in cortical astrocytes of WT mice (A) and NBCe1-KO (NBC-KO) animals (F) in solutions of varied [CO2], [HCO3−], and pH as indicated. B and G, changes from 5% CO2/26 mm HCO3−/pH 7.4, to 2% CO2/26 mm HCO3−/pH 7.8, and to 5% CO2/61 mm HCO3−/pH 7.8, in both alkalinized WT cells (B) and NBCe1-KO cells (G), whereas the [HCO3−]i decreased during the first change, but increased during the second change, respectively (H). C–E and I and J, cytosolic glucose, monitored with the FRET-based nanosensor, dropped in WT cells in both solutions, as did glucose during extracellular removal of glucose (Glu.) and lactate (Lac.) (D and E), whereas in NBCe1-KO cells, glucose dropped moderately during the first solution change, but did not change during the second solution change (I and J). Error bars represent means ± S.E. **, p ≤ 0.01, ***, p ≤ 0.001.
The steady-state cytosolic glucose levels decreased under these pHi changes in both solutions, reflecting increased glucose consumption (Fig. 1D). In 2% CO2/26 mm HCO3−, the glucose signal decreased by 4.9 ± 0.34% with a rate of 0.7 ± 0.05%/min, whereas in 5% CO2/61 mm HCO3−, the glucose signal decreased by 8.4 ± 0.39% with a rate of 2.6 ± 0.18%/min (Fig. 1E). Our experiments suggest that glucose consumption is stimulated by cytosolic alkalinization under conditions when [HCO3−]i increased or decreased. Removing glucose and lactate from the superfusing solution led to a fast and large drop in the glucose signal of 17.8 ± 0.26% with a rate of 4.3 ± 0.15%/min (Fig. 1, D and E). This rapid and reversible, in some instance biphasic, decrease in cytosolic glucose upon the complete removal of external glucose and lactate is attributed to the efflux of glucose via glucose transporters (GLUT) and the basal glucose consumption of the cell (phosphorylation by hexokinase) (23). We considered the saturation point of the glucose signal under complete removal of external glucose and lactate as the lowest level of cytosolic glucose, and used this protocol to correlate the level of stimulation-dependent glucose changes in cells.
We have previously shown that the electrogenic sodium bicarbonate cotransporter, NBCe1, is highly expressed in cortical astrocytes and responsible for fast HCO3− transport into and out of these cells (11, 24). We therefore asked how much of the change in pHi was attributable to NBCe1 activity, and hence how much it influenced glucose consumption. We therefore repeated the experiments in astrocytes prepared from a transgenic mouse model, in which the NBCe1 gene had been deleted (NBCe1-KO). The [H+]i decreased in solutions with either reduced [CO2] or increased [HCO3−] also in NBCe1-KO cells (Fig. 1F), by 18 ± 0.6 nm in 2% CO2/26 mm HCO3− and by 5.9 ± 1.1 nm in 5% CO2/61 mm HCO3− (Fig. 1G). From these values, the changes in [HCO3−]i were calculated; the [HCO3−]i decreased by 9.2 ± 0.7 mm in 2% CO2/26 mm HCO3− and increased by 1.8 ± 0.1 mm in 5% CO2/61 mm HCO3− (Fig. 1H).
There was a small decrease in the steady-state cytosolic glucose in NBCe1-KO cells of 3.4 ± 0.43% with a rate of 0.26 ± 0.03% in 2% CO2/26 mm HCO3−, but no change in 5% CO2/61 mm HCO3− (Fig. 1, I and J). Removing glucose and lactate resulted in a large and reversible decrease of the glucose signal by 18.9 ± 0.3% with a rate of 3.7 ± 0.26%/min (Fig. 1, I and J). These experiments suggest that a rise in glucose consumption is not necessarily coupled to the HCO3− transport via NBCe1, but are in line with a pH dependence of glucose metabolism.
We next asked the question how, more specifically, the glycolytic rate, indicated by the change in cytosolic glucose in the presence of the glucose transport inhibitor cytochalasin B (Cyt B,3 20 μm), was affected in these solutions of different pH/[CO2]/[HCO3−] (Fig. 2). The application of cytochalasin B induced a reversible, monophasic fall in cytosolic glucose, attributed to the basal glucose consumption of the cell (23). When a change to low CO2 or high HCO3− level was done during the ongoing Cyt B-induced gradual fall in the glucose level, an increase in the rate of fall was observed, corresponding in WT cells to an increase in the glycolytic rate by 420 ± 22 and 625 ± 78%, respectively (Fig. 2, A and B). In the same solutions, the glycolytic rate in NBCe1-KO cells increased to 363 ± 26% in 2% CO2/26 mm HCO3−, but only to 189 ± 8.7% in 5% CO2/61 mm HCO3− (Fig. 2, C and D). In organotypic hippocampal slices, transduced with the FRET-based nanosensor for glucose, the glycolytic rate in 2% CO2/26 mm HCO3− was enhanced to 359 ± 33% in WT astrocytes and to 370 ± 92% in NBCe1-KO astrocytes (Fig. 2, E–G), confirming the conclusions drawn from the experiments on cultured astrocytes. To estimate the glycolytic rate, the slope was calculated from the initial linear change of the FRET-ratio (1–2 min), induced by the exposure of a test solution. This corresponds to the cytosolic glucose changes during the early phase of pHi shifts induced by the same test solution. Because the peak of pHi changes, induced by the test solution (Fig. 1A), often occurs 1–4 min after the solution change, there may have been an underestimation of the values of the glycolytic rate presented here.
FIGURE 2.

Alkalinization-induced increase in glycolytic rate. A–D, recordings of glucose-sensitive FRET ratio in the presence of the glucose transport inhibitor Cyt B (20 μm) in WT cultured astrocytes (A) and in NBCe1-KO (NBC-KO) cultured astrocytes (C) in solutions of varied [CO2], [HCO3−], and pH as indicated and introduced in Fig. 1, and the corresponding relative glycolytic rate determined from these changes in the glucose signal in WT (B) and in NBCe1-KO (D) cells. gluc., glucose; lact., lactate. E–G, the first part of this experiment was done also in organotypic hippocampal brain slices, showing the glucose-sensitive FRET ratio in astrocytes from WT (E) and from NBCe1-KO (F) mice, from which the relative glycolytic rates were determined (G). Error bars represent means ± S.E. *, p ≤ 0.05, ***, p ≤ 0.001. n.s., not significant.
Glycolytic Rate during Intracellular [HCO3−] Rise, Associated with Either a Concomitant Fall or Rise in [H+]i
Because in the experiments so far the pHe was increased (from 7.4 to 7.8), which might itself affect cellular glucose consumption, we increased the [CO2] from 2 to 5%, and kept the pH of the solutions constant by increasing the [HCO3−] from 10 to 26 mm (isohydric hypercapnia). The steady-state [H+]i of WT and NBCe1-KO astrocytes in 2% CO2/10 mm HCO3− saline was 64.6 ± 3.2 nm (pHi 7.19 ± 0.02) and 51.9 ± 1.9 nm (pHi 7.3 ± 0.17), respectively. The change into the isohydric 5% CO2 solution resulted in a drop of [H+]i by −12.8 ± 1.1 nm in WT cells and in an increase of [H+]i by 15.9 ± 1.8 nm in NBCe1-KO cells (Fig. 3, A and B). Thus, in the 5% CO2/26 mm HCO3−, [H+]i was 53.4 ± 2.5 nm (pHi 7.3 ± 0.014) in WT cells, and 65.8 ± 3.1 nm (pHi 7.16 ± 0.023) in NBCe1-KO cells. Increasing the [CO2] would be expected to elicit an intracellular acidification and an increase in the [HCO3−]i, attributable to CO2 diffusion into the cells and subsequent partial degradation to H+ and HCO3−; in WT cells, however, the increase in [HCO3−]e also stimulates NBCe1 (11). The total [HCO3−]i rise was 12.7 ± 1.1 mm in WT cells and 11.1 ± 0.3 mm in NBCe1-KO cells (Fig. 3C). Under these conditions, glucose fell rapidly in WT cells, but fell much less in NBCe1-KO cells (Fig. 3D), indicating a change in glycolytic rate to 497 ± 50% in WT cells and to 39 ± 49% in NBCe1-KO cells.
FIGURE 3.
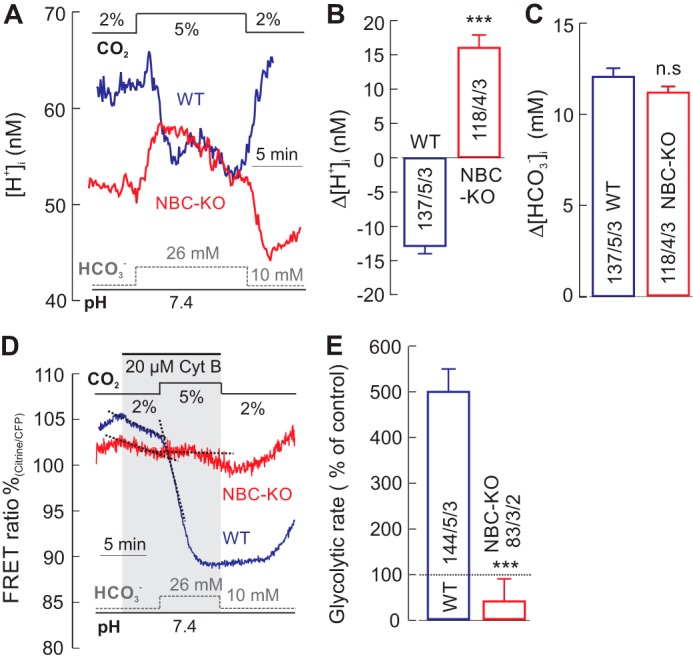
Glycolytic rate during a rise in [HCO3−]i with either a fall or rise in [H+]i. A, recordings of intracellular [H+] ([H+]i) in cortical astrocytes of WT (blue trace) and from NBCe1-KO (NBC-KO, red trace) mice, when increasing the [CO2] from 2 to 5% and increasing the [HCO3−] from 10 to 26 mm at constant pH of 7.4 (isohydric hypercapnia). B and C, the [H+]i changed in different directions in the cells from WT and NBCe1-KO mice (B), whereas the [HCO3−]i increased by a similar amount in the two preparations (C). D and E, the glucose-sensitive FRET ratio in the presence of Cyt B only dropped sharply in WT cells, but a fall in glycolytic rate in NBCe1-KO cells (D), indicating a robust increase in the relative glycolytic rate in WT cells, but only a small rise in glycolytic rate in NBCe1-KO cells (E). Error bars represent means ± S.E. ***, p ≤ 0.001. n.s., not significant.
When the [CO2] was raised from 2 to 5%, lowering the pHe to 7.0 at constant [HCO3−] of 10 mm (hypercapnic acidosis), a cytosolic acidification with a concomitant rise in bicarbonate was induced in both WT and NBC-KO astrocytes (Fig. 4, A–C). The glycolytic rate measured under this condition in primary cultured WT and NBCe1-KO astrocytes was 141 ± 11 and 129 ± 15%, respectively (Fig. 4, D–F). We have also measured glycolytic rate in astrocytes from hippocampal organotypic slice cultures under similar condition (hypercapnic acidosis) and found it to be changed by −37 ± 20% in WT and +199 ± 15% in NBCe1-KO astrocytes (Fig. 4, G and H). These results suggest that glycolytic rate can be enhanced in response to a rise in cytosolic bicarbonate, even if pHi is concomitantly falling, although to a much smaller extent than during isohydric hypercapnia (Fig. 3E), when pHi is concomitantly rising.
FIGURE 4.

Hypercapnic acidosis acidifies cells with a rise in [HCO3−]i, but does not stimulate glycolytic rate. A–C, recordings of intracellular [H+] ([H+]i) in cortical astrocytes from WT (A, blue trace) and from NBCe1-KO (NBC-KO) (A, red trace) mice during a solution change from 2% CO2 (pH 7.4) to 5% CO2 (pH 7.0) at constant [HCO3−] of 10 mm, which induced cytosolic acidification, with a concomitant rise in bicarbonate in both cell types (A–C). D–F, the glucose-sensitive FRET ratio in the presence of Cyt B showed little change during the hypercapnic acidosis in both WT (D and F) and NBCe1-KO (E and F) cells. gluc, glucose; lact, lactate. G and H, the same experiment was also done in organotypic hippocampal brain slices (G and H), showing the glucose-sensitive FRET ratio in astrocytes from WT (G) mice. The glycolytic rate was determined from the FRET ratio in hippocampal astrocytes from WT and NBCe1-KO mice (H). Error bars represent means ± S.E. *, p ≤ 0.05, ***, p ≤ 0.001. n.s., not significant.
Previous studies showed that depolarization of astrocytes by extracellular [K+] rise causes an intracellular alkalinization only in WT cells, but not in NBCe1-KO cells, which resulted in a robust stimulation of glycolysis in WT cells, but not in NBCe1-KO cells (10, 11). We repeated these experiments and found that a rise in K+ elicits an intracellular alkalinization and a fast fall in cytosolic glucose (rise in glucose consumption) only in WT cells, but not in NBCe1-KO cells (Fig. 5, A–E). The [H+]i decreased by 29.9 ± 2.1 nm in WT and by 4.05 ± 0.98 nm in NBCe1-KO cells (Fig. 5, A and B), and the [HCO3−]i rose by 10.7 ± 0.4 mm in WT cells and by 3.17 ± 0.24 mm in NBCe1-KO cells (Fig. 5C). When external K+ was raised from 3 to 15 mm in the normal solution (5% CO2/26 mm HCO3−, pH 7.4), a sharp drop of the glucose signal of 13.8 ± 0.47% was monitored in WT cells, but a small increase of glucose by 3.4 ± 0.54% in NBCe1-KO cells was seen (Fig. 5, D and E). Next, we used this depolarization protocol with 15 mm K+ to modulate the hypercapnic acidosis-associated H+i and HCO3− shifts in astrocytes. Exposing cells to an increase in CO2 (from 2 to 5%) and K+ (from 3 to 15 mm) at constant extracellular HCO3− (10 mm) resulted in an intracellular alkalinization in WT cells and acidification in NBC-KO cells with a concomitant rise in bicarbonate in both cell types (Fig. 5, F–H). The glycolytic rate under these conditions increased to 655 ± 31%/min in WT cells, but only to 181 ± 25% in NBCe1-KO cells (Fig. 5, I and J).The rise in extracellular K+ is known to stimulate glycolysis via activation of Na+/K+ pump in astrocytes (25). The moderate increase in glycolytic rate in NBCe1-KO cells (181 ± 25%) during the elevation of extracellular [K+]and [CO2](Fig. 5, I and J) may be attributed to the stimulation of Na+/K+ pump as reported by Ref. 25. These results strongly suggest that pHi is the main determinant of glucose consumption and glycolytic rate, whereas a rise in the [HCO3−]i is largely ineffective, if pHi decreases. Our results agree with those of Ref. 10, and in addition, support our main conclusion that it is cytosolic alkalinization that stimulates glucose metabolism.
FIGURE 5.

Depolarizing astrocytes leads to alkalinization, which increased glucose consumption and glycolytic rate only in WT cells, but not in NBCe1-KO cells. A–C, recordings of intracellular [H+] ([H+]i) in cortical astrocytes from WT (A, blue trace) and from NBCe1-KO (NBC-KO) (A, red trace) mice following an increase in the extracellular [K+] from 3 to 15 mm, which induced a robust alkalinization (A and B) and the rise of [HCO3−]i (C) in WT cells, but alkalinization was much less robust in NBCe1-KO cells. D and E, under these conditions, the glucose-sensitive FRET ratio dropped sharply only in WT cells (D, blue trace), but changed only little in NBCe1-KO cells (D, red trace), indicating a robust increase in glucose consumption in 15 mm [K+] only in WT cells (E). gluc, glucose; lact, lactate. F–H, recordings of intracellular [H+] ([H+]i) in cortical astrocytes from WT (F, blue trace) and from NBCe1-KO (F, red trace) mice during solution change from 2% CO2 (pH 7.4) to 5% CO2 (pH 7.0) at constant [HCO3−] (hypercapnic acidosis) with 15 mm K+, which induced a cytosolic alkalinization in WT cell (F and G, blue trace) and acidification in NBCe1-KO cells (F and G, red trace) with a concomitant rise in intracellular bicarbonate in both cell types (H). I and J, under these conditions, the glucose-sensitive FRET ratio in the presence of Cyt B dropped sharply only in WT (I, blue trace) but dropped much less in NBCe1-KO cells (I, red trace), indicating a robust increase in glycolytic rate in WT cells as compared with NBC-KO cells (J). Error bars represent means ± S.E. ***, p ≤ 0.001.
Glycolytic Rate during Cytosolic Alkalinization in the Nominal Absence of CO2/HCO3−
So far, all experiments were performed in CO2/HCO3−-containing solutions, which might open the possibility that, although a [HCO3−] rise was not necessary for stimulating glycolysis, the mere presence of millimolar concentrations of [HCO3−] might be required for an alkalinization-induced stimulation of glycolysis. Therefore, we used trimethylamine (TMA) to alkalinize the cells in the nominal absence of CO2/HCO3−. In a HEPES-buffered solution, 5 mm TMA resulted in a mean decrease of 16.8 ± 1.2 nm H+ in WT cells and of 15.6 ± 1 nm H+ in NBCe1-KO cells (Fig. 6, A and B). Under these conditions, TMA stimulated the glycolytic rate to 657 ± 74%/min in WT cells and to 588 ± 95%/min in NBCe1-KO cells (Fig. 6, C and D). The [HCO3−]e and [HCO3−]i attributable to dissolved air-CO2 would be below 300 μm under these conditions, whereas the [HCO3−]i would presumably change by less than 150 μm in TMA. This strongly suggests that the stimulation of glycolysis by intracellular alkalinization is independent of HCO3−.
FIGURE 6.
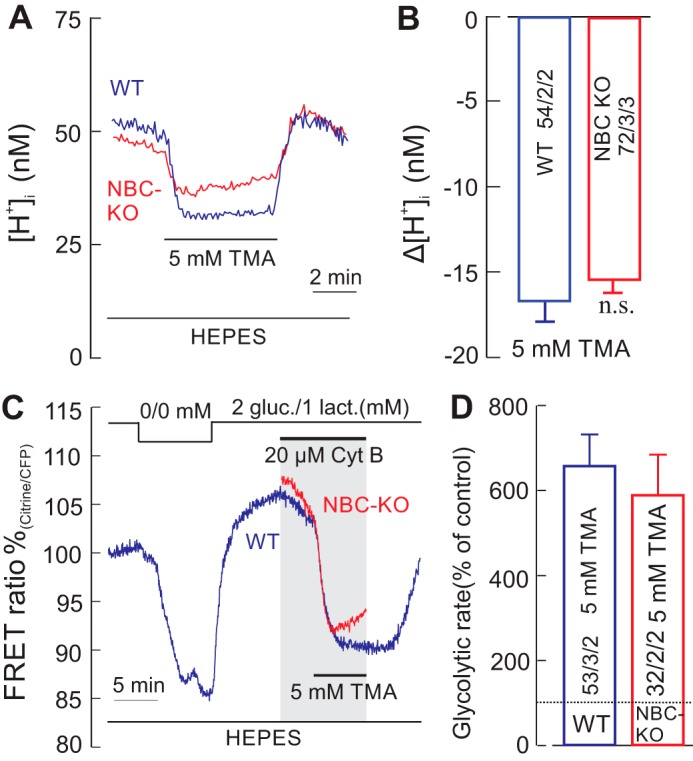
Alkalinization-induced stimulation of glycolytic rate is not dependent on the presence of bicarbonate. A and B, recordings of intracellular [H+] ([H+]i) in cortical astrocytes of WT (A, blue trace) and from NBCe1-KO (NBC-KO) (A, red trace) mice during application of 5 mm TMA in nominally CO2/HCO3−-free, HEPES-buffered solution, which caused a strong intracellular alkalinization (B). C and D, under these conditions, the glucose-sensitive FRET ratio in the presence of Cyt B dropped sharply in both WT (C, blue trace) and NBCe1-KO cells (C, red trace), indicating a robust increase in glycolytic rate in both preparations (D). gluc., glucose; lact., lactate. Error bars represent means ± S.E. n.s., not significant.
Because in the presence of CO2/HCO3− the H+ buffer strength is greatly increased attributable to fast HCO3− transport via NBCe1 (26), 5 mm TMA slightly changed pHi in astrocytes (<5 nm; Fig. 7, A and B). Under these conditions, a change in the glycolytic rate to only 198 ± 25% was determined in TMA (Fig. 7, C and D).
FIGURE 7.
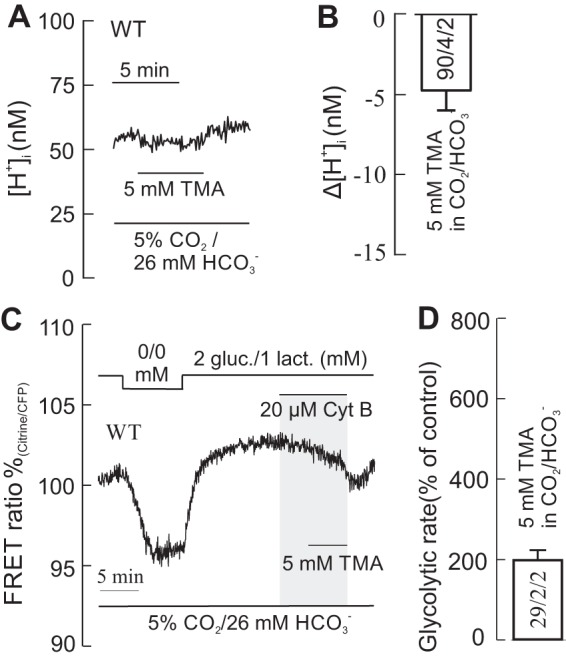
At high H+ buffering strength, TMA alkalinizes the cells much less and causes only a small increase in glycolytic rate. A and B, recordings of intracellular [H+] ([H+]i) in WT cortical astrocytes during application of 5 mm TMA in CO2/HCO3−-buffered solution (A), which causes only a small alkalinization (B). C and D, under these conditions, the glucose-sensitive FRET ratio in the presence of Cyt B caused only a relatively small drop in glucose (C), indicating only a moderate increase in glycolytic rate (D). gluc., glucose; lact., lactate. Error bars represent means ± S.E.
Discussion
The present study addresses a fundamental question in cellular glucose metabolism, i.e. whether pH-dependent stimulation of glycolysis reported in different cell types, including astrocytes, is mediated by a fall in [H+]i or a rise in [HCO3−]i. To functionally dissect the impact of intracellular pH and HCO3− on glycolysis in astrocytes, we measured the changes in steady-state glucose and glycolytic rate while altering the intracellular [H+] and [HCO3−]. We show that glycolytic rate is substantially enhanced (by 4–7-fold) when there is a fall in intracellular proton concentration with either a concomitant decrease or increase in [HCO3−]i. In contrast, there was only a mild activation of glycolysis (up to ∼2-fold) in response to a rise in [HCO3−]i (∼12 mm), unless pHi also increased. The glycolytic rate was enhanced up to 7-fold by intracellular alkalinization, even in the nominal absence of CO2/HCO3−. These results suggest that a fall in [H+]i is sufficient and necessary to enhance the glycolytic rate in astrocytes, whereas a change in the [HCO3−]i per se has little effect on glucose consumption and glycolytic rate. The impact of our conclusion on neuron-glia interactions, using acute slices and neuronal activation, still needs to be tested.
Proton Is a Key Signal for Glycolysis
Glycolysis is the primary step for major energy production in cells. The glycolytic rate is tightly controlled in different steps of 10 major enzymatic reactions involved in this process. The activity of 6-phospho frutokinase1 (PFK1), one of the pivotal regulatory enzymes of glycolysis, is known to have a steep pH dependence, in vitro, between the dynamic range of pH 7.1–7.35 (27). Intracellular alkalinization following bicarbonate uptake via NBCe1 has recently been shown to augment the glycolytic rate in astrocytes, presumably due to the pH-dependent activation PFK1 in astrocytes (10). On the other hand, activation of bicarbonate-sensitive soluble adenylyl cyclase (sAC) followed by bicarbonate entry via NBCe1 was also suggested to stimulate glucose metabolism and lactate release in mammalian astrocytes (20). Because the rise of pHi and [HCO3−]i may stimulate glucose metabolism independently, it was unresolved whether augmentation of glucose consumption and glycolytic rate reported in astrocytes was attributable to a rise in pHi or a rise in [HCO3−]i, or whether both pHi and [HCO3−]i had to increase. Our results now clearly show that it is a rise in pHi (fall in [H+]i) that mediates the robust stimulation of glycolysis in astrocytes, presumably by releasing a H+ block of PKF1 catalytic activity (27, 28). The measured steady-state pH of cultured astrocytes (7.17 ± 0.02 in HEPES and 7.2 ± 0.07 in 5% CO2/26 mm HCO3−-buffered solution) lies in the window of maximum pH dependence of PFK1 and below the saturation point for the pH-dependent activation of PFK1. This correlates with the substantial activation of glycolysis (up to 7-fold) during an alkaline shift of 0.1 to 0.15 pH unit in astrocytes. In response to cytosolic acidification, glycolytic rate was moderately enhanced (up to 2-fold) or even slightly decreased in astrocytes (Figs. 3, D and E, and 4, G and F). This indicates that there might be other pathways to which glucose is channelized in addition to glycolysis, and other factors, except pH, that affect glycolysis.
Role of Bicarbonate in Glycolysis
A rise in [HCO3−]i can occur via two different pathways: 1) by CO2 diffusion into the cells and its degradation to H+ and HCO3−, which is augmented by carbonic anhydrase (CA) activity, and 2) by the direct uptake of HCO3− via membrane transporters such as NBCe1. The rise of [HCO3−]i in cells via CO2 pathway results in an acidification, whereas the transporter-mediated rise in [HCO3−]i causes an alkalinization, as bicarbonate consumes intracellular H+ to produce CO2 and H2O. NBCe1 is known to be the major bicarbonate transporter in astrocytes and is functionally very active in these cells (11, 22). However, depending upon the intra- and extracellular bicarbonate concentrations, the direction of bicarbonate transport mediated by NBCe1 can be inwardly or outwardly directed. Therefore, the transporter activity can induce either an intracellular alkalinization or acidification (11, 24). The study that showed bicarbonate-dependent augmentation of glycolysis (20), however, was performed under the condition when NBCe1 was operating in the inwardly directed manner, which is associated with cytosolic alkalinization. Our results suggest that a rise in [HCO3−]i as such has no major impact on the acute activation of glycolytic rate in astrocytes. This conclusion is based on the following evidence. 1) Although a substantial rise in intracellular bicarbonate was observed (Δ HCO3− = ∼12 mm) via CO2 pathways under hypercapnic conditions, there was only a small activation of glycolytic rate (∼2-fold), when cells acidified. 2) A robust activation of glycolytic rate (5–7-fold) was observed during the rise of intracellular HCO3− (Δ HCO3− = ∼10 mm) only when the cells alkalinized concomitantly, attributable to NBCe1 activation in the inward direction. 3) Glycolytic rate was strongly activated during cytosolic alkalinization, which was associated with a decreasing [HCO3−]i. 4) Glycolytic rate was robustly activated (up to 6-fold) during cytosolic alkalinization even in the nominal absence of intra- and extracellular bicarbonate. These results suggest that it is not the rise in bicarbonate, but the alkalinization (fall of [H+]i) that primarily activates the glycolytic rate in astrocytes.
Hypercapnia-mediated pHi Shifts and Their Impact on Glycolysis
Isohydric hypercapnia (increase in [CO2]o and [HCO3−]o at constant pHo) is expected to induce an intracellular acidification, attributable to diffusion of CO2 into the cells, and its degradation to H+ and HCO3− (29, 30). However, one of the striking findings of the present study was that isohydric hypercapnia, i.e. switching extracellular solution from 2% CO2/10 mm HCO3−/7.4 pH to 5% CO2/26 mm HCO3−/7.4 pH, induced an intracellular alkalinization in astrocytes and activated glycolysis to more than 5-fold (Fig. 3). In NBCe1-KO astrocytes, in contrast, an acidification was evoked by the same solution change. This suggests that bicarbonate uptake via NBCe1 dominated over CO2 diffusion in WT astrocytes during the exposure of isohydric hypercapnia, and not only suppressed the CO2-mediated acidification, but even caused an alkalinization (see also Ref. 26). Attributed to the acidic pHi shift induced by isohydric hypercapnia in NBCe1-KO astrocytes, and despite the substantial bicarbonate rise by ∼12 mm, the glycolytic rate was not augmented as compared with WT, where the alkalinization was accompanied by a robust increase in glycolysis.
By exposing cells to a different kind of hypercapnia, hypercapnic acidosis (increase in [CO2]e and drop in pHe at the same [HCO3−]e), we could induce acidification in both WT and NBCe1-KO cells with a concomitant rise in bicarbonate. This acidification in both cells is presumably due to the domination of CO2 diffusion over NBCe1-mediated bicarbonate transport into the cells. Because both 2% and 5% CO2-buffered solutions had the same concentration of external bicarbonate, the free energy for NBCe1-mediated bicarbonate transport would be expected to be unaltered. Although there is a net bicarbonate rise in both WT and NBC-KO cells under these conditions, the glycolytic rate was enhanced only to 1.4-fold in WT and 1.3-fold in NBCe1-KO cells, suggesting that it is not the rise in bicarbonate ion stimulating glucose consumption in astrocytes. Interestingly, we could reverse the pH change induced by hypercapnic acidosis in WT cells, and thus enhance the glycolytic rate up to 6-fold, when external K+ was also concomitantly raised from 3 to 15 mm. Elevated extracellular K+ from 3 to 15 mm would depolarize astrocytes and stimulate inwardly directed NBCe1 (11, 22). The bicarbonate uptake via NBCe1 masked CO2-induced acidification, and even caused an alkalinization, thus stimulating glycolysis.
Hypercapnia-induced alkalinization in astrocytes and stimulation of glycolysis may have potential physiological significance in astrocyte-neuron metabolic shuttling. As neurons rely more on oxidative metabolism for their energy requirements as compared with astrocytes, their activity may lead to a substantial production of intracellular CO2 (31–33). The metabolically produced CO2 in neurons may diffuse out, following its chemical gradient, and then may degrade into H+ and HCO3−, catalyzed by extracellular carbonic anhydrases expressed by neurons and glial cells (34). A rise in extracellular CO2/HCO3−, originating from oxidative neurons, may activate NBCe1 in astrocytes, and the subsequent intracellular alkalization would stimulate glycolysis and lactate production in astrocytes. The lactate produced in astrocytes can be shuttled back to neurons for metabolic support as proposed by the astrocyte-neuron lactate shuttle hypothesis (35–37). Indeed, it was recently shown that CO2 exposure causes a rise in extracellular lactate in acute brain slices (38). Therefore, we hypothesize that the activity-induced production of CO2 in neurons, in addition to elevated extracellular K+, may function as a signal that stimulates glucose metabolism in neighboring astrocytes.
Experimental Procedures
Chemicals and Reagents
Standard chemicals for buffers, tissue culture reagents, and TMA were purchased from Sigma. BCECF-AM (2′,7′-bis-(2-carboxyethyl)-5-(and-6)-carboxyfluorescein) was obtained from Molecular Probes (Eugene, OR). The glucose sensor, FLIP12glu-700μΔ6, is available from Addgene, and adenovirus incorporating was FLIP12glu-700μΔ6 (serotype 5) was custom-made by Vector Biolabs (Malvern, PA).
Animals, Organotypic Hippocampal Slices, and Astrocyte Culture from Cerebral Cortex
Astrocyte cultures from wild type (C57BL/6, p0 to p3) and NBCe1-KO (129S6/SvEv and Black Swiss background, p0 to p3) mouse cerebral cortex were prepared as described previously (39). Astrocytes were plated on poly-d-lysine-coated glass coverslips and maintained in DMEM medium containing 5% FCS and 5% horse serum. The medium was renewed completely after 24 h of plating and subsequently every 3 days. Cells were used for experiments when they were 10–20 days in vitro.
Organotypic hippocampal slice cultures were prepared according to the protocol explained in detail by Refs. 40 and 41. Hippocampal slices of 400-μm thickness were prepared from 5–7 day-old C57BL/6 mice under sterile conditions using a McIlwain tissue chopper (Mickle Laboratory Engineering Co., Guildford, UK). Biopore membranes (Millicell standing inserts, Merck Millipore, Darmstadt, Germany) were used to maintain the slices in an interface between humidified normal atmosphere (5% CO2, 36.5 °C) and culture medium, which consisted of 50% minimal essential medium, 25% Hanks' balanced salt solution, 25% horse serum, and 2 mm l-glutamine and 5 mm d-glucose at pH 7.4 in an incubator (Memmert, Schwabach, Germany). The culture medium (1 ml) was renewed every 3 days.
Animals were maintained on a 12-h day/night cycle at constant room temperature with free access to water and standard mouse diet in the animal facility of the Technical University of Kaiserslautern. All procedures involving animals were approved by the Landesuntersuchungsamt Rheinland-Pfalz, Koblenz, Germany (23 177-07).
Intracellular H+i Imaging
To measure the intracellular H+ concentration ([H+]i) changes in cultured cortical astrocytes, we used a confocal imaging system and acetoxymethyl ester of a proton-sensitive dye, BCECF-AM. The dye was loaded into the cells by incubating them with 3 μm BCECF-AM in HEPES-buffered solution for 15 min at room temperature. Cells were then mounted on a chamber under a confocal laser scanning microscope (LSM 510, Zeiss, Oberkochen, Germany) and superfused continuously either with HEPES-buffered solution (in mm): 140 NaCl, 3 KCl, 2 α-d-glucose, 1 l-lactate, 0.5 NaH2PO4, 10 HEPES, 1 MgCl2, 2 CaCl2, or with CO2/HCO3−-buffered solution (in mm): 114 NaCl, 3 KCl, 0.5 NaH2PO4, 2 α-d-glucose, 1 l-lactate, 26 NaHCO3, 1 MgCl2, 2 CaCl2. BCECF was excited consecutively at 488 nm (proton-sensitive wavelength) and 458 nm (close to isosbestic point), and the changes in fluorescence emission were monitored at >505 nm (using LP 505 filter). Images were obtained every 5 s (0.2 Hz) with a 40× water immersion objective. The fluorescence emission intensity of 488 nm excitation changes inversely with a change in [H+]i, whereas the fluorescence emission intensity of 458 nm excitation is largely pH-insensitive. The changes of [H+]i were monitored using the ratio F458/F488. The ratio was converted into pH and absolute intracellular proton concentrations ([H+]i) using the nigericin-based calibration technique as explained in detail previously (11).
Intracellular Glucose Imaging
The detailed procedure of using fluorescence-based metabolite sensors is explained by Ref. 42. Primary cultured astrocytes were transfected with 1 μl of adenovirus containing glucose-sensitive FRET nanosensor FLIP12glu-700μΔ6 (0.59 × 10¹⁰ PFU/ml) and used for experiments after 2 days of transfection. Transfected astrocytes were imaged with a confocal microscope (LSM 700) equipped with a 20× water immersion objective. FLIP12glu-700μΔ6 was excited by 405 nm at 0.4 Hz, and the fluorescence emission was split at 508 nm into a <508-nm (CFP) fraction and a >508-nm (citrine) fraction. The ratio was calculated by dividing fluorescence emission from >508-nm (citrine) fraction by <508-nm (CFP) fraction. To measure the glycolytic rate, cytochalasin B (a potent inhibitor of glucose transport) was applied, which resulted in a gradual fall in the glucose signal (FRET ratio) reflecting glucose consumption by the cell. Then a test solution was applied in the continuous presence of cytochalasin B. The effect of the test solution on the glycolytic rate was determined by dividing the slope of the glucose signal seen in the simultaneous presence of cytochalasin B and the test solution, by the slope obtained with cytochalasin B alone.
For glucose imaging in astrocytes from organotypic hippocampal slices, 2-day cultures were transduced with 1 μl of adenovirus containing FLIIP12glu-700μΔ6 by overnight incubation (5.9 × 10¹⁰ PFU/ml). After 4 days of transduction, the slices were used for glucose imaging experiments for the next 4–5 days. Glucose imaging was performed with an upright wide-field fluorescence microscope (Olympus) equipped with a monochromator (Polychrome IV, Till Photonics), OptoSplit (Cairns Research, Faversham, UK), and cooled CCD camera (Till Photonics). The intact Biopore membranes carrying organotypic hippocampal slices were mounted in a recording chamber and continuously superfused with a CO2/HCO3− buffer at room temperature (22–24 °C). By using a xenon lamp, the CFP protein of glucose sensor was excited with 415 nm for 200–600 ms at 0.4 Hz. The fluorescence emission was separated for CFP and citrine by OptoSplit and captured with a CCD camera.
Statistical Analysis
All statistical analysis were performed using the software SigmaPlot 11.0 and clamp fit 10.2. Statistical values are presented as means ± S.E. For calculation of significance in differences, Student's t test was used. In the figures, significance levels are: *, p ≤ 0.05, **, p ≤ 0.01, and ***, p ≤ 0.001.
Author Contributions
S. M. T. and J. W. D. conceived the project and designed the experiments, S. M. T., T. W., and J. S. performed the experiments and analyzed the data, I. R. developed a method, contributed to research materials, and was involved in the critical reading of the paper, and S. M. T. and J. W. D. wrote the paper.
Acknowledgment
We thank Prof. Dr. Gary E. Shull, University of Cincinnati, for providing the NBCe1-KO mutant mouse model.
This work was supported by the Deutsche Forschungsgemeinschaft (Grant DE 231/24-1,2) and by the Priority Group of the Land Rheinland-Pfalz 'BioComp' at the University of Kaiserslautern (to J. W. D.). The authors declare that they have no conflicts of interest with the contents of this article.
- Cyt B
- cytochalasin B
- TMA
- trimethylamine
- BCECF-AM
- 2′,7′-bis-(2-carboxyethyl)-5-(and-6)-carboxyfluorescein.
References
- 1. Jakoby P., Schmidt E., Ruminot I., Gutiérrez R., Barros L. F., and Deitmer J. W. (2014) Higher transport and metabolism of glucose in astrocytes compared with neurons: a multiphoton study of hippocampal and cerebellar tissue slices. Cereb. Cortex 24, 222–231 [DOI] [PubMed] [Google Scholar]
- 2. Barros L. F., and Deitmer J. W. (2010) Glucose and lactate supply to the synapse. Brain Res. Rev. 63, 149–159 [DOI] [PubMed] [Google Scholar]
- 3. Sotelo-Hitschfeld T., Niemeyer M. I., Mächler P., Ruminot I., Lerchundi R., Wyss M. T., Stobart J., Fernández-Moncada I., Valdebenito R., Garrido-Gerter P., Contreras-Baeza Y., Schneider B. L., Aebischer P., Lengacher S., San Martín A., et al. (2015) Channel-mediated lactate release by K+-stimulated astrocytes. J. Neurosci. 35, 4168–4178 [DOI] [PMC free article] [PubMed] [Google Scholar]
- 4. Mächler P., Wyss M. T., Elsayed M., Stobart J., Gutierrez R., von Faber-Castell A., Kaelin V., Zuend M., San Martín A., Romero-Gómez I., Baeza-Lehnert F., Lengacher S., Schneider B. L., Aebischer P., Magistretti P. J., et al. (2016) In vivo evidence for a lactate gradient from astrocytes to neurons. Cell Metab. 23, 94–102 [DOI] [PubMed] [Google Scholar]
- 5. Magistretti P. J. (2006) Neuron-glia metabolic coupling and plasticity. J. Exp. Biol. 209, 2304–2311 [DOI] [PubMed] [Google Scholar]
- 6. Bélanger M., Allaman I., and Magistretti P. J. (2011) Brain energy metabolism: focus on astrocyte-neuron metabolic cooperation. Cell Metab. 14, 724–738 [DOI] [PubMed] [Google Scholar]
- 7. Chesler M., and Kraig R. P. (1987) Intracellular pH of astrocytes increases rapidly with cortical stimulation. Am. J. Physiol. 253, R666–R670 [DOI] [PMC free article] [PubMed] [Google Scholar]
- 8. Chesler M., and Kraig R. P. (1989) Intracellular pH transients of mammalian astrocytes. J. Neurosci. 9, 2011–2019 [DOI] [PMC free article] [PubMed] [Google Scholar]
- 9. Rose C. R., and Deitmer J. W. (1994) Evidence that glial cells modulate extracellular pH transients induced by neuronal activity in the leech central nervous system. J. Physiol. 481, 1–5 [DOI] [PMC free article] [PubMed] [Google Scholar]
- 10. Ruminot I., Gutiérrez R., Peña-Münzenmayer G., Añazco C., Sotelo-Hitschfeld T., Lerchundi R., Niemeyer M. I., Shull G. E., and Barros L. F. (2011) NBCe1 mediates the acute stimulation of astrocytic glycolysis by extracellular K+. J. Neurosci. 31, 14264–14271 [DOI] [PMC free article] [PubMed] [Google Scholar]
- 11. Theparambil S. M., Ruminot I., Schneider H. P., Shull G. E., and Deitmer J. W. (2014) The electrogenic sodium bicarbonate cotransporter NBCe1 is a high-affinity bicarbonate carrier in cortical astrocytes. J. Neurosci. 34, 1148–1157 [DOI] [PMC free article] [PubMed] [Google Scholar]
- 12. Kerly M., and Ronzoni E. (1933) The effect of pH on carbohydrate changes in isolated anaerobic frog muscle. J. Biol. Chem. 103, 161–173 [Google Scholar]
- 13. Erecińska M., Deas J., and Silver I. A. (1995) The effect of pH on glycolysis and phosphofructokinase activity in cultured cells and synaptosomes. J. Neurochem. 65, 2765–2772 [DOI] [PubMed] [Google Scholar]
- 14. Folbergrová J., MacMillan V., and Siesjö B. K. (1972) The effect of hypercapnic acidosis upon some glycolytic and Krebs cycle-associated intermediates in the rat brain. J. Neurochem. 19, 2507–2517 [DOI] [PubMed] [Google Scholar]
- 15. Brookes N. (1997) Intracellular pH as a regulatory signal in astrocyte metabolism. Glia 21, 64–73 [PubMed] [Google Scholar]
- 16. Wuttke M. S., Buck J., and Levin L. R. (2001) Bicarbonate-regulated soluble adenylyl cyclase. JOP 2, 154–158 [PubMed] [Google Scholar]
- 17. Zippin J. H., Chen Y., Straub S. G., Hess K. C., Diaz A., Lee D., Tso P., Holz G. G., Sharp G. W., Levin L. R., and Buck J. (2013) CO2/HCO3− and calcium regulated soluble adenylyl cyclase as a physiological ATP sensor. J. Biol. Chem. 288, 33283–33291 [DOI] [PMC free article] [PubMed] [Google Scholar]
- 18. Buck J., and Levin L. R. (2011) Physiological sensing of carbon dioxide/bicarbonate/pH via cyclic nucleotide signaling. Sensors 11, 2112–2128 [DOI] [PMC free article] [PubMed] [Google Scholar]
- 19. Chang J. C., and Oude-Elferink R. P. (2014) Role of the bicarbonate-responsive soluble adenylyl cyclase in pH sensing and metabolic regulation. Front Physiol. 5, 42. [DOI] [PMC free article] [PubMed] [Google Scholar]
- 20. Choi H. B., Gordon G. R., Zhou N., Tai C., Rungta R. L., Martinez J., Milner T. A., Ryu J. K., McLarnon J. G., Tresguerres M., Levin L. R., Buck J., and MacVicar B. A. (2012) Metabolic communication between astrocytes and neurons via bicarbonate-responsive soluble adenylyl cyclase. Neuron 75, 1094–1104 [DOI] [PMC free article] [PubMed] [Google Scholar]
- 21. Gawenis L. R., Bradford E. M., Prasad V., Lorenz J. N., Simpson J. E., Clarke L. L., Woo A. L., Grisham C., Sanford L. P., Doetschman T., Miller M. L., and Shull G. E. (2007) Colonic anion secretory defects and metabolic acidosis in mice lacking the NBC1 Na+/HCO3− cotransporter. J. Biol. Chem. 282, 9042–9052 [DOI] [PubMed] [Google Scholar]
- 22. Schrödl-Häußel M., Theparambil S. M., Deitmer J. W., and Roussa E. (2015) Regulation of functional expression of the electrogenic sodium bicarbonate cotransporter 1, NBCe1 (SLC4A4), in mouse astrocytes. Glia 63, 1226–1239 [DOI] [PubMed] [Google Scholar]
- 23. Bittner C. X., Loaiza A., Ruminot I., Larenas V., Sotelo-Hitschfeld T., Gutiérrez R., Córdova A., Valdebenito R., Frommer W. B., and Barros L. F. (2010) High resolution measurement of the glycolytic rate. Front. Neuroenergetics 2, 26. [DOI] [PMC free article] [PubMed] [Google Scholar]
- 24. Theparambil S. M., Naoshin Z., Thyssen A., and Deitmer J. W. (2015) Reversed electrogenic sodium bicarbonate cotransporter 1 is the major acid loader during recovery from cytosolic alkalosis in mouse cortical astrocytes. J. Physiol. 593, 3533–3547 [DOI] [PMC free article] [PubMed] [Google Scholar]
- 25. Bittner C. X., Valdebenito R., Ruminot I., Loaiza A., Larenas V., Sotelo-Hitschfeld T., Moldenhauer H., San Martín A., Gutiérrez R., Zambrano M., and Barros L. F. (2011) Fast and reversible stimulation of astrocytic glycolysis by K+ and a delayed and persistent effect of glutamate. J. Neurosci. 31, 4709–4713 [DOI] [PMC free article] [PubMed] [Google Scholar]
- 26. Theparambil S. M., and Deitmer J. W. (2015) High effective cytosolic H+ buffering in mouse cortical astrocytes attributable to fast bicarbonate transport. Glia 63, 1581–1594 [DOI] [PubMed] [Google Scholar]
- 27. Trivedi B., and Danforth W. H. (1966) Effect of pH on the kinetics of frog muscle phosphofructokinase. J. Biol. Chem. 241, 4110–4112 [PubMed] [Google Scholar]
- 28. Carpenter J. F., and Hand S. C. (1986) Comparison of pH-dependent allostery and dissociation for phosphofructokinases from Artemia embryos and rabbit muscle: nature of the enzymes acylated with diethylpyrocarbonate. Arch. Biochem. Biophys. 248, 1–9 [DOI] [PubMed] [Google Scholar]
- 29. Thomas R. C. (1974) Intracellular pH of snail neurones measured with a new pH-sensitive glass mirco-electrode. J. Physiol. 238, 159–180 [DOI] [PMC free article] [PubMed] [Google Scholar]
- 30. Thomas R. C. (1976) The effect of carbon dioxide on the intracellular pH and buffering power of snail neurones. J. Physiol. 255, 715–735 [DOI] [PMC free article] [PubMed] [Google Scholar]
- 31. Peng L., Zhang X., and Hertz L. (1994) High extracellular potassium concentrations stimulate oxidative metabolism in a glutamatergic neuronal culture and glycolysis in cultured astrocytes but have no stimulatory effect in a GABAergic neuronal culture. Brain Res. 663, 168–172 [DOI] [PubMed] [Google Scholar]
- 32. Dienel G. A., and Hertz L. (2001) Glucose and lactate metabolism during brain activation. J. Neurosci. Res. 66, 824–838 [DOI] [PubMed] [Google Scholar]
- 33. Hassel B., Westergaard N., Schousboe A., and Fonnum F. (1995) Metabolic differences between primary cultures of astrocytes and neurons from cerebellum and cerebral cortex: effects of fluorocitrate. Neurochem Res. 20, 413–420 [DOI] [PubMed] [Google Scholar]
- 34. Deitmer J. W. (2001) Strategies for metabolic exchange between glial cells and neurons. Respir. Physiol. 129, 71–81 [DOI] [PubMed] [Google Scholar]
- 35. Pellerin L., and Magistretti P. J. (1994) Glutamate uptake into astrocytes stimulates aerobic glycolysis: a mechanism coupling neuronal activity to glucose utilization. Proc. Natl. Acad. Sci. U.S.A. 91, 10625–10629 [DOI] [PMC free article] [PubMed] [Google Scholar]
- 36. Pellerin L., Bouzier-Sore A. K., Aubert A., Serres S., Merle M., Costalat R., and Magistretti P. J. (2007) Activity-dependent regulation of energy metabolism by astrocytes: an update. Glia 55, 1251–1262 [DOI] [PubMed] [Google Scholar]
- 37. Tang F., Lane S., Korsak A., Paton J. F., Gourine A. V., Kasparov S., and Teschemacher A. G. (2014) Lactate-mediated glia-neuronal signalling in the mammalian brain. Nat. Commun. 5, 3284. [DOI] [PMC free article] [PubMed] [Google Scholar]
- 38. Karagiannis A., Sylantyev S., Hadjihambi A., Hosford P. S., Kasparov S., and Gourine A. V. (2016) Hemichannel-mediated release of lactate. J. Cereb. Blood Flow Metab. 36, 1202–1211 [DOI] [PMC free article] [PubMed] [Google Scholar]
- 39. Stridh M. H., Alt M. D., Wittmann S., Heidtmann H., Aggarwal M., Riederer B., Seidler U., Wennemuth G., McKenna R., Deitmer J. W., and Becker H. M. (2012) Lactate flux in astrocytes is enhanced by a non-catalytic action of carbonic anhydrase II. J. Physiol. 590, 2333–2351 [DOI] [PMC free article] [PubMed] [Google Scholar]
- 40. Valdebenito R., Ruminot I., Garrido-Gerter P., Fernández-Moncada I., Forero-Quintero L., Alegría K., Becker H. M., Deitmer J. W., and Barros L. F. (2015) Targeting of astrocytic glucose metabolism by β-hydroxybutyrate. J. Cereb. Blood Flow Metab. 10.1177/0271678X15613955 [DOI] [PMC free article] [PubMed] [Google Scholar]
- 41. Schneider J., Lewen A., Ta T. T., Galow L. V., Isola R., Papageorgiou I. E., and Kann O. (2015) A reliable model for gamma oscillations in hippocampal tissue. J. Neurosci. Res. 93, 1067–1078 [DOI] [PubMed] [Google Scholar]
- 42. San Martin A., Sotelo-Hitschfeld T., Lerchundi R., Fernández-Moncada I., Ceballo S., Valdebenito R., Baeza-Lehnert F., Alegría K., Contreras-Baeza Y., Garrido-Gerter P., Romero-Gómez I., and Barros L. F. (2014) Single-cell imaging tools for brain energy metabolism: a review. Neurophoton 1, 011004 [DOI] [PMC free article] [PubMed] [Google Scholar]