Abstract
While infection with H. pylori is a strong risk factor for gastric cancer, most H. pylori-colonized individuals, even those with the high-risk CagA+VacA+ strain, remain asymptomatic over their lifetime. We hypothesized that the discordant outcomes were due to differences in the host immune responses. Previously, Tim-3-mediated immune modulation was observed in H. pylori-challenged mice. In this study, we compared Tim-3-related responses in CagA+VacA+ H. pylori-infected asymptomatic individuals and H. pylori-associated gastric adenocarcinoma patients. We showed that compared to H. pylori-uninfected individuals, both H. pylori-infected asymptomatic and gastric cancer patients upregulated Tim-3 overall. However, the Tim-3 upregulation was enriched on Th1 cells in asymptomatic patients and on Treg and CD8+ T cells in gastric cancer patients, with respective differences in T cell subset functions. In gastric cancer patients, high Tim-3 expression on Treg and CD8+ T cells, but not on Th1 cells, was associated with worse prognosis. H. pylori-antigen presentation by tumor-associated macrophages upregulated Tim-3 expression more effectively than by blood monocyte-derived macrophages in vitro. The upregulation of Tim-3 in vitro depended on the concentration of H. pylori antigen but not on whether the cells were from asymptomatic or cancer patients. These data suggest that the discrepancy in Tim-3 upregulation in asymptomatic and cancer subjects is induced by cancer but not the other way around. Once gastric cancer is developed, Tim-3 expression is associated with worse prognosis.
Keywords: Tim-3, H. pylori, gastric cancer
Introduction
The positive association between gastric cancer development and H. pylori infection is now well established [1,2]. H. pylori is an extremely common pathogen and is currently present in more than half of the world’s population [3,4]. Although chronic infection by H. pylori significantly elevates the risk for a whole spectrum of diseases, such as gastritis, gastric and duodenal ulceration, and gastric cancer, many of H. pylori-infected individuals do not present any symptoms. The propensity of cancer development has been attributed to several bacterial factors, such as the differences in H. pylori strains [5-7], and the presence of certain bacterial proteins, including the cytotoxin-associated protein (CagA) and the vacuolating cytotoxin (VacA) [7,8]. However, many individuals with CagA and VacA positive (CagA+VacA+) H. pylori strain do not develop cancer. Therefore, the relation between H. pylori-related gastric cancer and host factors require further examination [9,10].
The immune system, especially tumor antigen-specific T cells, plays a crucial role in combating infections and preventing de novo tumor establishment. It also combats established tumors in a less effective manner [11,12]. Effectiveness of T cell-mediated antitumor immunity can be suppressed by a number of factors, such as the antiinflammatory antigen-presentation to tumor-infiltrating T cells by tumor-associated macrophages (TAMs) [13-15], and the loss of effector functions through T cell exhaustion [16]. The expression of Tim-3 on CD4+ and CD8+ T cells marks a group of terminally differentiated or functionally exhausted T cells during chronic inflammation and cancer [17]. Blocking Tim-3 interaction with its ligand galectin 9 increases interferon gamma (IFN-γ) production by T cells and T cell survival [18-20], and is thought to enhance potential antitumor immunity [17,21-23]. In the case of gastric cancer development, persistent H. pylori infection is associated with increased cancer risk, in part through protumorigenic effects of the immune system [10,24]. Interestingly, H. pylori-challenged BALB/c mice upregulate Tim-3, with concurrent increase in Th1 cytokines [25]. Whether Tim-3-mediated immune modulation could contribute to clinical outcomes in chronic H. pylori-infected individuals and affect tumor prognosis requires more investigations.
In this study, the Tim-3 mediated immune responses in H. pylori-infected asymptomatic individuals and H. pylori-associated gastric adenocarcinoma patients were examined. To minimize potential differences induced by different H. pylori strains, only individuals with high-risk CagA+VacA+ H. pylori strain were included.
Materials and methods
Study participants
The H. pylori-associated primary gastric adenocarcinoma patients were recruited from The 155th Central Hospital of PLA. Only patients with confirmed H. pylori infection were included. Age- and gender-matched healthy volunteers who did not present any evidence of gastroduodenal diseases, or any other infections or inflammatory diseases were included. These controls were also screened for the absence or presence of H. pylori. Biopsy samples from both cancer subjects and healthy subjects were homogenized in PBS (pH 7.4) and were cultured on trypticase soy agar plates (Hardy Diagnostics) containing 7.5% sheep blood with serial dilution. Bacteria colonies were then used for DNA preparation (High Pure PCR Template Preparation Kit, Roche) and PCR assay with a previously published method [7] was used for the detection of cagA and vagA genes [26-28]. Only healthy (asymptomatic) and cancer subjects with CagA+VagA+ H. pylori strains, or healthy subjects without any H. pylori infection (uninfected) were included in the study. Written informed consent was obtained from each subject. Demographic and clinical information of all participants are listed in Table 1.
Table 1.
Demographic and clinical information of study participants
| Uninfected | Asymptomatic | Cancer | P | |
|---|---|---|---|---|
| N | 13 | 13 | 16 | |
| Age, years | 62 (55-70) | 63 (55-72) | 62 (53-71) | > 0.05 |
| Gender (M/F) | 8/5 | 8/5 | 10/6 | > 0.05 |
| Tumor size, cm | - | - | 4.3 (2.8-6.5) | - |
| Tumor stage, n (%) | - | - | - | |
| III | 16 (100) | |||
| Other | 0 (0) | |||
| 5-yr prognosis, n (%) | < 0.001 | |||
| Alive | 13 (100) | 13 (100) | 8 (50) | |
| Deceased | 0 (100) | 0 (100) | 8 (50) |
Numerical values are expressed as median (range). One-way ANOVA or Chi-square test was used to compute P values.
Sample preparation
A total of 100-200 mL of peripheral blood was drawn at the arm from each participant. Ficoll-Hypaque centrifugation was performed to obtain peripheral blood mononuclear cells (PBMCs). Freshly resected tumor was minced and digested in 50 mL HBSS (Thermo Fisher Scientific) supplemented with 40 mg collagenase, 4 mg DNase I and 100 U hyaluronidase for 2 h at 37°C with shaking. The homogenized tumor samples were then pushed through a 40 µL cell strainer and were centrifuged with Ficoll to obtain mononuclear leukocytes. H. pylori strain SS1 (CagA+VacA+) were grown in Brucella broth with 5% FBS for 48 hours, harvested by centrifugation at 2500 g for 10 min, and killed by heating in 95°C water-bath. The killed bacteria were then resuspended in complete culture medium at 0.1 mg/mL and sonicated before adding into the cell culture [29]. All cells were cultured at a final concentration of 106 cells per mL of complete RPMI 1680 media (supplemented with 10% FCS, 1% Penicillin-Streptomycin, and 1 × GlutaMax) at 37°C and 5% CO2.
Cell purification
Blood and tumor-infiltrating T cells, monocytes and tumor-associated macrophages were isolated using appropriate paramagnetic beads (Stemcell Technologies). Naive T cells were isolated by sorting live purified T cells with CD45RO+-expression in BD Aria cytometer. Blood monocyte-derived macrophages were obtained by culturing purified monocytes in RPMI complete medium (replaced every 3 days) for 6 to 8 days until enough adherent macrophages could be obtained.
Flow cytometry
The following anti-human antibodies and their appropriate isotype controls were used: CCR6 (G034E3), CXCR3 (G025H7), Tim-3 (F38-2E2), CD3 (HIT3a), CD4 (RPA-T4), CD8 (HIT8a), CD45RO (UCHL1), Foxp3 (206D), IFN-γ (B27), IL-10 (JES3-9D7), IL-17A (BL168), and TGF-β1 (TW4-2F8). Cells were washed and incubated in Violet DEAD Cell Stain (Life Technologies) for 15 min at 4°C, washed twice, and incubated with surface antibodies for 30 min at 4°C. Stained cells were washed twice and stained with intracellular antibodies using the Foxp3/Transcription Factor Staining Buffer Set (eBiosceince) following manufacturer’s protocol. Samples were sorted in BD Aria or acquired in BD LSR II and analyzed in FlowJo (Tree Star).
Statistical analysis
Mean ± SD was shown where appropriate. D’Agostino-Pearson normality test was first applied to each dataset to determine the distribution pattern. Parametric or nonparametric tests were then chosen accordingly. Two-tailed P < 0.05 was considered significant. All tests were performed in Prism 6 (GraphPad).
Results
Characterization of Tim-3-expressing T cells in H. pylori-infected asymptomatic and cancer patients
H. pylori challenge of mouse lymphocytes was shown to increase Tim-3 expression on Th1 cells, with concurrent upregulation of Th1 cytokines (IL-2, IFN-γ, and IL-12) [25]. But in general, how these changes will likely affect human immune responses toward H. pylori and the clinical outcome of chronic H. pylori-infection is largely unknown. To answer this, we examined the Tim-3 expression on T cells from 13 H. pylori-uninfected healthy controls (uninfected), 13 H. pylori-chronic infected asymptomatic patients (asymptomatic), and 16 H. pylori-related gastric cancer patients (cancer) (Figure 1A). We found that in line with previous discoveries in mice [25], the frequency of Tim-3+ cells in CD3+ T cells was significantly higher in asymptomatic subjects (13.76 ± 5.73%, mean ± SD) and cancer subjects (18.21 ± 5.90%) than in uninfected subjects (5.26 ± 4.00%) (Figure 1B). No significant differences were observed between the asymptomatic and gastric cancer patients.
Figure 1.
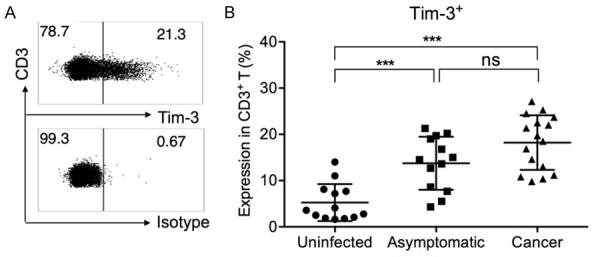
Expression of Tim-3 in CD3+ T cells, in H. pylori-uninfected, H. pylori-infected asymptomatic, and H. pylori-associated gastric cancer patients. A. Representative gating of Tim-3+ cells in CD3+ T cells. Panel shown was pre-gated on live/single/lymphocyte/CD3+ T cells in one asymptomatic subject. B. Summary of Tim-3 expression on total T cells, in all uninfected, asymptomatic, and cancer patients. One-way ANOVA followed by Tukey’s post-test. ***P < 0.001. ns: not significant.
CXCR3 and CCR6 expression was previously demonstrated to mark Th1, Th2 and Th17 cells with mutually exclusive signature cytokine expression in each subset [30-32], and was utilized here to distinguish Th1, Th2 and Th17 cells (Figure 2A). Interestingly, the asymptomatic and gastric cancer patients presented significantly different Tim-3 expression patterns in T cell subsets. Notably, Tim-3 expression on Th1 cells was significantly higher in asymptomatic patients than in cancer patients (Figure 2C). However, the Tim-3 expression on CD4+Foxp3+ regulatory T cells (Tregs) and on CD8+ T cells was significantly higher in cancer patients than in asymptomatic patients (Figure 2F and 2G). The Tim-3 expression levels on Th2 and Th17 cells were not significantly different between asymptomatic and cancer individuals (Figure 2D and 2E).
Figure 2.
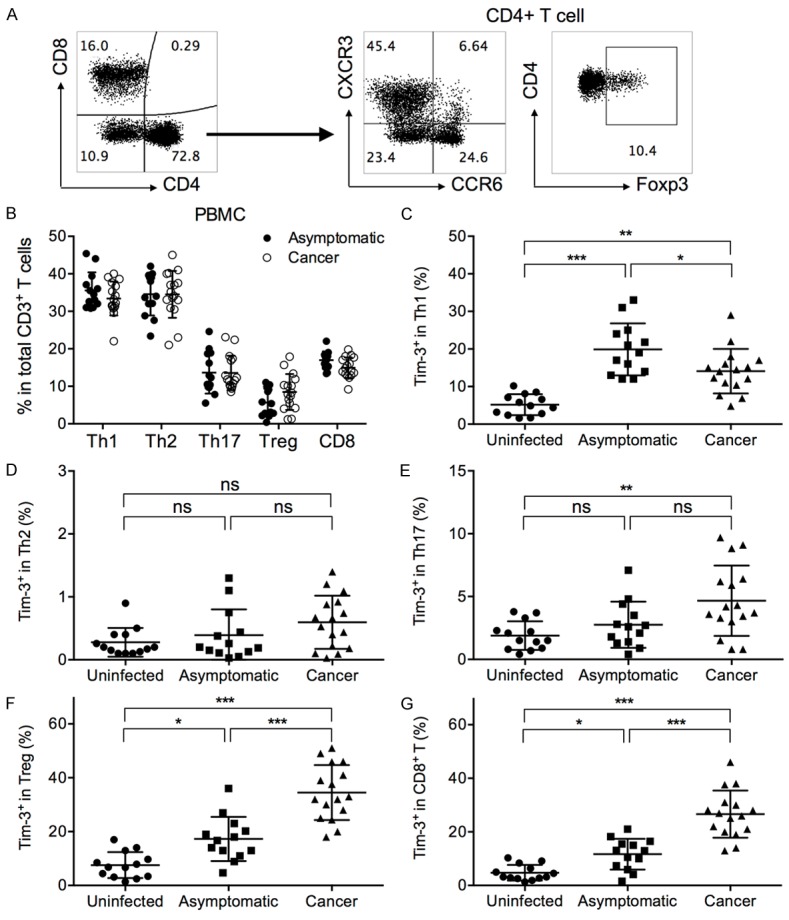
Expression of Tim-3 by T cell subsets in uninfected, asymptomatic, and gastric cancer patients. (A) Representative gating strategy of Th1, Th2, Th17, Treg, and CD8+ T cells in PBMCs from one asymptomatic subject. The first panel shown was pre-gated on live/single/lymphocyte/CD3+ T cells. (B) The frequencies of Th1, Th2, Th17, Treg, and CD8+ T cells in asymptomatic and gastric cancer patients. The frequencies of Th1, Th2, Th17 and Treg cells were represented as a percentage in total CD4+ T cells, while the frequency of CD8+ T cells were represented as a percentage in total CD3+ T cells. t test with Welch’s correction. (C-G) The levels of Tim-3+ cells in (C) Th1, (D) Th2, (E) Th17, (F) Treg, and (G) CD8+ T cells, as a percentage in each respective parent population. Gating of Tim-3+ cells was the same as in Figure 1A. One-way ANOVA followed by Tukey’s post-test. *P < 0.05. **P < 0.01. ***P < 0.001. ns: not significant.
Tim-3 expression affects T cell subset function differently in asymptomatic and cancer patients
Tim-3 was first identified as a Th1 activation and terminal differentiation marker [33,34]. Tim-3 expression on cytotoxic T cells in chronic virus-infected individuals and cancer patients was associated with reduced proinflammatory cytokine expression and suppressed cytotoxicity [17,20], but Tim-3 was also seen to assist in Treg-mediated immune suppression [35,36]. These previous studies on the multi-functionality of Tim-3 seem to suggest that the different Tim-3 upregulation patterns between asymptomatic and cancer patients could result in different immune responses, despite a similar overall frequency. Here, we examined the functions of Tim-3+ vs. Tim-3- T cells in each subset. Superantigen Staphylococcus aureus enterotoxin B (SEB) was used to simulate antigen-specific interaction between T cells and antigen-presenting cells. The PBMCs from 8 asymptomatic subjects and 8 cancer patients were cultured in plain medium (blank) or medium supplemented with SEB for 12 h. Signature cytokine secretion from each subset was analyzed. The Tim-3+ Th1 cells expressed significantly higher IFN-γ than Tim-3- Th1 cells in asymptomatic subjects ex vivo (Figure 3A). After SEB stimulation, Tim-3+ and Tim-3- Th1 cells expressed comparable amounts of IFN-γ in both asymptomatic and cancer patients. This suggested that Tim-3 expression in Th1 in H. pylori-infected subjects did not mark the exhausted phenotype, but rather represented activated Th1 cells ex vivo. The Th2 cell cytokines were not examined due to minimal Tim-3 expression in Th2 cells. The IL-17 expression by Tim-3+ and Tim-3- Th17 cells were comparable in asymptomatic and cancer patients, both ex vivo and after SEB (Figure 3B). The Tim-3+ Treg cells secreted significantly higher IL-10 and TGF-β than Tim-3- Treg cells in cancer patients ex vivo (Figure 3C and 3D). After SEB stimulation, the expression of IL-10 by Tim-3+ Tregs was significantly higher than that by Tim-3- Tregs, in both asymptomatic and cancer patients (Figure 3C). In CD8+ T cells (CTLs), Tim-3+ CD8+ T cells expressed significantly lower IFN-γ than Tim-3- CD8+ T cells in cancer patients directly ex vivo (Figure 3E). After SEB stimulation, the Tim-3+ CD8+ T cells had significantly lower frequencies of IFN-γ-expressing cells than Tim-3- CD8+ T cells in both asymptomatic subjects and cancer patients. Together, these results demonstrated that in different T cell subsets, Tim-3 expression had different effects on cytokine productions. In general, presence of Tim-3 was associated with elevated production of IL-10 and TGF-β in CD4+ T cells and was associated with reduced production of IFN-γ in CD8+ T cells.
Figure 3.
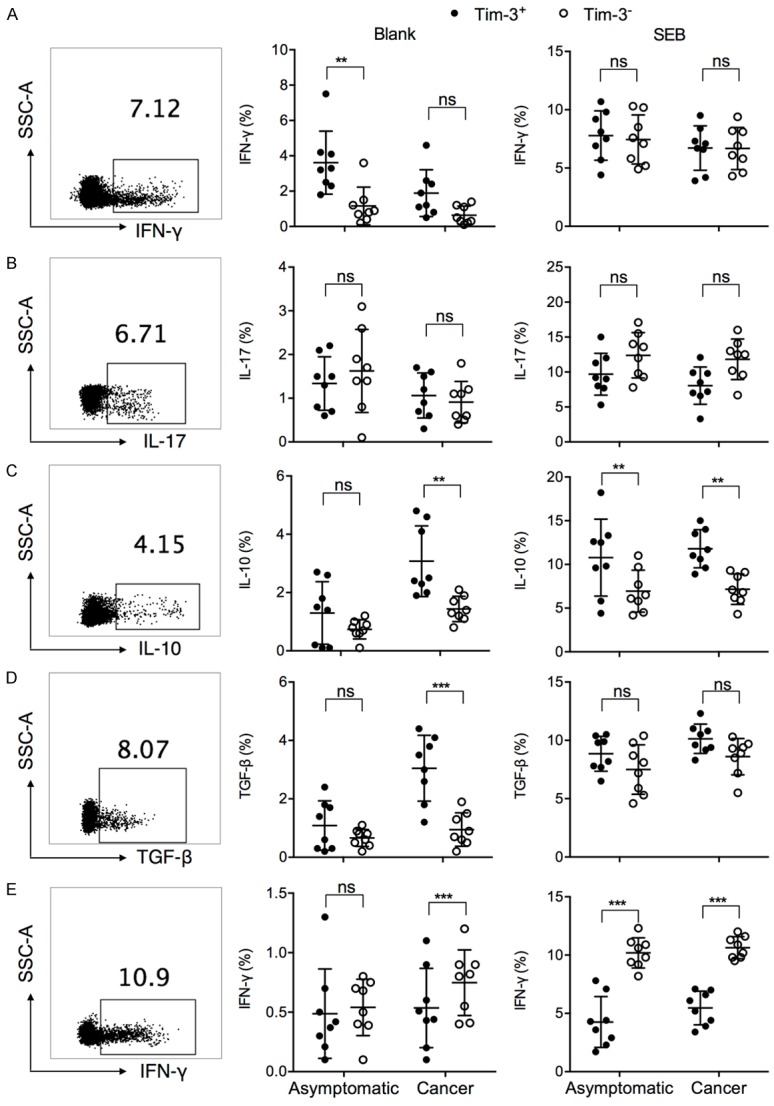
Signature cytokine expression by Tim-3+ vs. Tim-3- cells in each T cell subset, in asymptomatic subjects and gastric cancer patients. PBMCs from asymptomatic subjects or cancer patients were incubated in plain medium (blank) or with 2 µg/mL SEB for 12 h, in the presence of brefeldin A and monensin. The (A) IFN-γ expression by Th1, (B) IL-17 by Th17, (C) IL-10 and (D) TNF-β by Treg, (E) and IFN-γ by CD8+ T cells were examined in flow cytometry, by first gating on each T cell subset and then examining the percentage of cytokine-expressing cells. Representative intracellular staining of each cytokine was shown using sample from one cancer patient. t test with Welch’s correction. **P < 0.01. ***P < 0.001. ns: not significant.
Gastric cancer patients with worse prognosis had higher Tim-3 expression on Treg and CD8+ T cells
The effect of Tim-3 expression on T cell subsets on the prognosis of H. pylori-infected individuals was then examined. No asymptomatic individuals succumbed to gastritis, gastric or duodenal ulcer, or cancer over the study period; we therefore examined the Tim-3 expression in correlation with prognosis within the gastric cancer group (N = 16). Gastric cancer patients who did not survive within five years presented higher Tim-3 on Treg and CD8+ T cells (Figure 4). The Tim-3 expression on Th1 cells was not significantly different between live and deceased gastric cancer patients.
Figure 4.
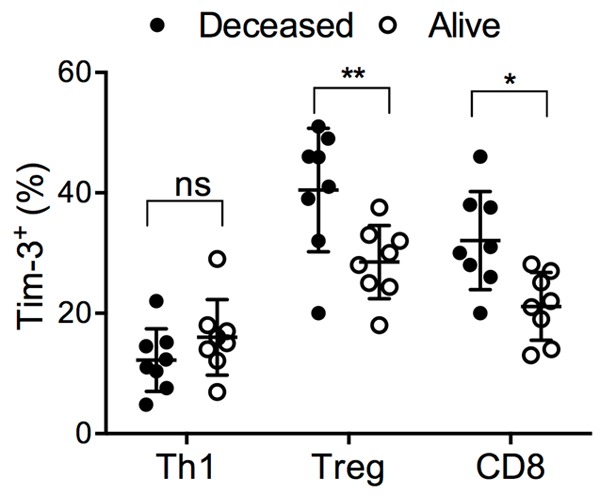
The Tim-3 expression in live or deceased gastric cancer patients within five years. The Tim-3 expression on Th1, Treg and CD8+ T cells in the gastric cancer patients included in this study, grouped according to whether the patient survived after five years (alive) or deceased within this period. t test with Welch’s correction. *P < 0.05. ns: not significant.
Tim-3+ cells were upregulated in gastric tumor
Activated Th1 cells could mediated antitumor immunity and was associated with better prognosis, while Tim-3+Foxp3+ Treg cells were thought to suppress antitumor effector T cells [22,36]. We previously observed the preferential upregulation of Tim-3 in Th1 but not Treg or CD8+ T cells in asymptomatic subjects, and vice versa in cancer patients, but the mechanism for inducing this preference was unknown. We wondered whether this was due to strong suppressive tumor microenvironment in gastric cancer patients. The tumor-infiltrating lymphocytes (TILs) harvested from 13 gastric cancer patients were then examined. We found that the TILs from gastric cancer patients contained significantly higher levels of CD4+Foxp3+ Treg cells than autologous PBMCs (18.8% ± 10.9% in TIL vs. 8.0% ± 5.1% in PBMC) (Figures 2B and 5A). The frequencies of CD8+ T cells were also higher in TILs than in PBMCs (22.0% ± 8.2% in TIL vs. 15.5% ± 3.0% in PBMC) (Figures 2B and 5A). The Treg and CD8+ T cells in TILs expressed significantly higher levels of Tim-3 than their counterparts in PBMCs (50.4% ± 16.9% in TIL vs. 34.2% ± 10.5% in PBMC; for CD8+ T, 47.2% ± 11.7% in TIL vs. 25.8% ± 9.3% in PBMC) (Figures 2F, 2G and 5B). The TAMs are known to exhibit M2-type and mediate immune suppression on TILs [14,15,37]. We therefore examined whether TAMs could actively induce Tim-3 expression on T cells. Tim-3- naive T cells (CD45RO-) were purified from the PBMCs and were co-cultured with equal numbers of autologous blood monocyte-derived macrophages or TAMs, in the absence (blank) or presence of sonicated H. pylori for 6 days. Interestingly, at the end of incubation, Tim-3 expression was significantly higher in T cells incubated with TAMs than those with blood monocyte-derived macrophages, even without H. pylori antigen (Figure 5C). With H. pylori, the Tim-3 upregulation was further elevated.
Figure 5.
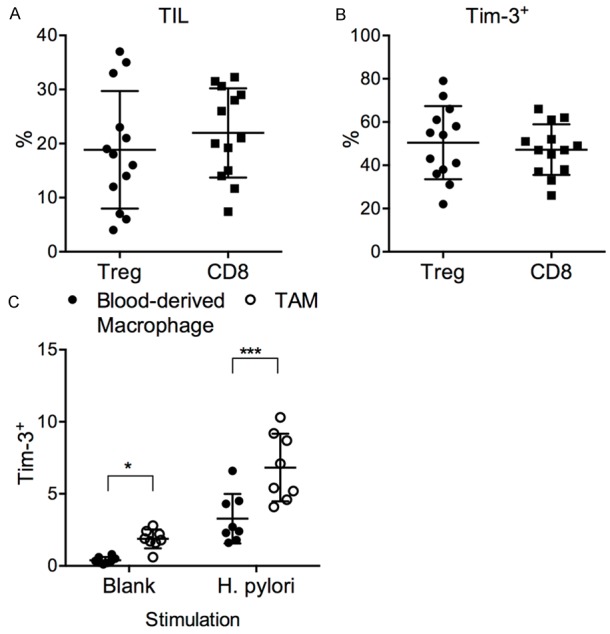
Tumor-mediated Tim-3 upregulation in gastric cancer patients. TILs and TAMs were harvested from freshly resected tumors from each gastric cancer patient in this study. A. The frequencies of Tregs in CD4+ T cells, and the frequencies of CD8+ T cells in CD3+ T cells, in the TILs. B. The Tim-3 expression on tumor-infiltrating Tregs and CD8+ T cells. C. The Tim-3 expression by T cells purified from PBMCs after coculturing with autologous blood monocyte-derived macrophages or TAMs for 6 days. t test with Welch’s correction. *P < 0.05. ***P < 0.001.
High dose H. pylori presentation by macrophages upregulated Tim-3 expression
Another possibility for the different Tim-3 upregulation patterns in asymptomatic and gastric cancer patients is that the antigen presentation by autologous macrophages might be different between asymptomatic and gastric cancer patients. To examine this, we incubated monocyte-derived macrophages with autologous Tim-3- naive T cells (CD45RO+) with sonicated H. pylori. The Tim-3 upregulation on T cells after incubation was then observed. We found that T cells from asymptomatic individuals and cancer individuals expressed similar levels of Tim-3 after coculture with H. pylori-pulsed macrophages (Figure 6A). This effect was dose-dependent, since incubation with a higher does of H. pylori-antigen resulted in significantly higher levels of Tim-3+ T cells (Figure 6B).
Figure 6.
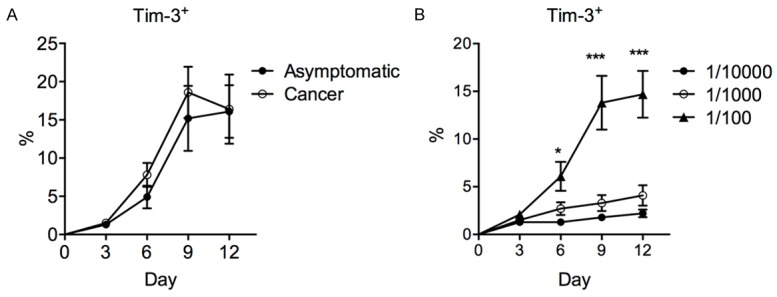
Mechanism of macrophage-mediated Tim-3 upregulation after H. pylori stimulation. Purified T cells from asymptomatic or cancer patients were cocultured with autologous blood monocyte-derived macrophages at 1:1 ratio in the presence of H. pylori. The Tim-3 expression in total T cells was examined by flow cytometry. A. The frequency of Tim-3+ T cells in five asymptomatic or five cancer patients, after stimulation with H. pylori at 1/100 dilution (stock 0.1 mg/mL). B. The frequency of Tim-3+ T cells in five asymptomatic subjects, after stimulation with H. pylori at varying dilutions (stock 0.1 mg/mL). One-way ANOVA followed by Tukey’s post-test. *P < 0.05. ***P < 0.001.
Discussion
Chronic H. pylori infection is widespread, with a diverse range of clinical outcomes. In vast majority of infected subjects, the infection is asymptomatic. However, H. pylori infection is associated with gastritis, gastric and duodenal ulceration, and gastric cancer gastric cancer development in a small portion of individuals. Although strain differences are partially accounting for this diversity, most subjects with the high-risk strain still present no symptoms [24,38]. Also, H. pylori stimulation has been shown to increase Th1 cytokine expression and upregulate Tim-3 on T cells [25]. In this study, we examined whether the different clinical outcomes of chronic H. pylori infection was correlated with Tim-3-mediated immune responses. We selected CagA+VacA+ H. pylori-infected individuals, either with no symptoms or with gastric cancer, and examined the modulation of immune responses by Tim-3. We found that asymptomatic and gastric cancer patients presented upregulated levels of Tim-3 on T cells overall. However in asymptomatic patients, the Tim-3 upregulation was enriched on Th1 cells, while in gastric cancer patients, the Tim-3 upregulation was enriched on Treg and CD8+ T cells. Since Tim-3 signaling presented different functions in different cell types, this varying upregulation pattern could results in contrasting in immune responses in asymptomatic vs. cancer individuals. We found that the Tim-3+ Th1 cells in asymptomatic subjects had significantly higher IFN-γ production compared to their Tim-3- counterparts under directly ex vivo conditions, while the Tim-3+ Treg cells in gastric cancer patients had significantly higher IL-10 and TGF-β production. The Tim-3+ CD8+ T cells in gastric cancer patients had significantly lower IFN-γ production. It appeared that the disease status in the individuals caused the discrepancies in ex vivo T cell inflammation between the asymptomatic subjects and cancer patients, rather than the alternative hypothesis that potential qualitative differences in T cells responses resulted in different clinical outcomes. This is because when the T cells were stimulated with superantigen SEB, the discrepancies between asymptomatic subjects and cancer patients in terms of cytokine production by Tim-3+ and Tim-3- T cell subsets no longer existed. Within the gastric cancer patients, higher Tim-3 expression on Treg cells and CD8+ T cells, but not on Th1 cells, was associated with worse prognosis, suggesting that elevated suppressive cytokine expression by Tim-3+ Treg cells and reduced inflammation in Tim-3+ CD8+ T cells resulted in worse prognosis in gastric cancer patients.
To examine the mechanism of Tim-3 upregulation, we analyzed the effects of the tumor microenvironment. We found that compared to their counterparts in PBMCs, Tregs and CD8+ T cells made up a significantly higher percentage in CD3+ TILs. Also, Tim-3 expression was significantly higher on TIL Tregs and TIL CD8+ T cells, than those from PBMCs. Naive T cells isolated from PBMCs and cocultured with autologous TAMs showed higher Tim-3 expression, than those cultured with autologous blood monocyte-derived macrophages, with or without H. pylori stimulation. This suggested that preferential infiltration of Tregs and CD8+ T cells in gastric tumor upregulated Tim-3 in these cell types, which could explain the Tim-3 upregulation pattern in cancer patients but not in asymptomatic patients. To examine whether the antigen presentation by macrophages might have resulted in different Tim-3 upregulation patterns between asymptomatic and gastric cancer patients, we cocultured naive T cells with autologous blood monocyte-derived macrophages, and found that the Tim-3 upregulation depended on the length of the stimulation and the amount of H. pylori antigen. Overall, our results showed that the presence of H. pylori infection-related gastric cancer could alter the peripheral T cell responses through upregulating Tim-3, which in turn affected the prognosis of gastric cancer patients.
Disclosure of conflict of interest
None.
Authors’ contribution
PS, RY, JT, HS, CG, LZ, HH, LS, PZ, NW, ZS, and CG conceived of the study, and participated in its design and drafted the manuscript. , CG, LZ, HH, and LS carried out the clinical information collection. PZ, NW, ZS, HKS, and CG performed the statistical analyses.
References
- 1.Peek RM, Blaser MJ. Helicobacter pylori and gastrointestinal tract adenocarcinomas. Nat Rev Cancer. 2002;2:28–37. doi: 10.1038/nrc703. [DOI] [PubMed] [Google Scholar]
- 2.Peterson WL. Helicobacter pylori and peptic ulcer disease. N Engl J Med. 1991;324:1043–1048. doi: 10.1056/NEJM199104113241507. [DOI] [PubMed] [Google Scholar]
- 3.Eusebi LH, Zagari RM, Bazzoli F. Epidemiology of Helicobacter pylori infection. Helicobacter. 2014;19(Suppl 1):1–5. doi: 10.1111/hel.12165. [DOI] [PubMed] [Google Scholar]
- 4.Brown LM. Helicobacter pylori: epidemiology and routes of transmission. Epidemiol Rev. 2000;22:283–297. doi: 10.1093/oxfordjournals.epirev.a018040. [DOI] [PubMed] [Google Scholar]
- 5.Israel DA, Salama N, Arnold CN, Moss SF, Ando T, Wirth HP. Helicobacter pylori strain-specific differences in genetic content, identified by microarray, influence host inflammatory responses. J Clin Invest. 2001;107:611–620. doi: 10.1172/JCI11450. [DOI] [PMC free article] [PubMed] [Google Scholar]
- 6.Yamaoka Y, Graham DY. Helicobacter pylori virulence and cancer pathogenesis. Future Oncol. 2014;10:1487–1500. doi: 10.2217/fon.14.29. [DOI] [PMC free article] [PubMed] [Google Scholar]
- 7.Enroth H, Kraaz W, Engstrand L, Nyrén O, Rohan T. Helicobacter pylori strain types and risk of gastric cancer: a case-control study. Cancer Epidemiol Biomarkers Prev. 2000;9:981–985. [PubMed] [Google Scholar]
- 8.Beigier-Bompadre M, Moos V, Belogolova E, Allers K, Schneider T, Churin Y. Modulation of the CD4+ T-cell response by Helicobacter pylori depends on known virulence factors and bacterial cholesterol and cholesterol α-glucoside content. J Infect Dis. 2011;204:1339–1348. doi: 10.1093/infdis/jir547. [DOI] [PubMed] [Google Scholar]
- 9.Kim HJ, Kim N, Kim HY, Lee HS, Yoon H, Shin CM. Relationship between body mass index and the risk of early gastric cancer and dysplasia regardless of Helicobacter pylori infection. Gastric Cancer. 2014;9:1–10. doi: 10.1007/s10120-014-0429-0. [DOI] [PubMed] [Google Scholar]
- 10.Epplein M, Xiang YB, Cai Q, Peek RM, Li H, Correa P. Circulating cytokines and gastric cancer risk. Cancer Causes Control. 2013;24:2245–2250. doi: 10.1007/s10552-013-0284-z. [DOI] [PMC free article] [PubMed] [Google Scholar]
- 11.Stromnes IM, Schmitt TM, Chapuis AG, Hingorani SR, Greenberg PD. Re-adapting T cells for cancer therapy: from mouse models to clinical trials. Immunol Rev. 2014;257:145–164. doi: 10.1111/imr.12141. [DOI] [PMC free article] [PubMed] [Google Scholar]
- 12.Gooden MJ, de Bock GH, Leffers N, Daemen T, Nijman HW. The prognostic influence of tumour-infiltrating lymphocytes in cancer: a systematic review with meta-analysis. Br J Cancer. 2011;105:93–103. doi: 10.1038/bjc.2011.189. [DOI] [PMC free article] [PubMed] [Google Scholar]
- 13.Biswas SK, Mantovani A. Macrophage plasticity and interaction with lymphocyte subsets: cancer as a paradigm. Nat Immunol. 2010;11:889–896. doi: 10.1038/ni.1937. [DOI] [PubMed] [Google Scholar]
- 14.Mantovani A, Romero P, Palucka AK, Marincola FM. Tumour immunity: effector response to tumour and role of the microenvironment. Lancet. 2008;371:771–83. doi: 10.1016/S0140-6736(08)60241-X. [DOI] [PubMed] [Google Scholar]
- 15.Mantovani A, Sozzani S, Locati M, Allavena P, Sica A. Macrophage polarization: tumor-associated macrophages as a paradigm for polarized M2 mononuclear phagocytes. Trends Immunol. 2002;23:549–555. doi: 10.1016/s1471-4906(02)02302-5. [DOI] [PubMed] [Google Scholar]
- 16.Wherry EJ. T cell exhaustion. Nat Immunol. 2011;12:492–499. doi: 10.1038/ni.2035. [DOI] [PubMed] [Google Scholar]
- 17.Anderson AC. Tim-3, a negative regulator of anti-tumor immunity. Curr Opin Immunol. 2012;24:213–6. doi: 10.1016/j.coi.2011.12.005. [DOI] [PubMed] [Google Scholar]
- 18.Zhu C, Anderson AC, Schubart A, Xiong H, Imitola J, Khoury SJ. The Tim-3 ligand galectin-9 negatively regulates T helper type 1 immunity. Nat Immunol. 2005;6:1245–1252. doi: 10.1038/ni1271. [DOI] [PubMed] [Google Scholar]
- 19.McMahan RH, Golden-Mason L, Nishimura MI, McMahon BJ, Kemper M, Allen TM. Tim-3 expression on PD-1+ HCV-specific human CTLs is associated with viral persistence, and its blockade restores hepatocyte-directed in vitro cytotoxicity. J Clin Invest. 2010;120:4546–4557. doi: 10.1172/JCI43127. [DOI] [PMC free article] [PubMed] [Google Scholar]
- 20.Jones RB, Ndhlovu LC, Barbour JD, Sheth PM, Jha AR, Long BR. Tim-3 expression defines a novel population of dysfunctional T cells with highly elevated frequencies in progressive HIV-1 infection. J Exp Med. 2008;205:2763–2779. doi: 10.1084/jem.20081398. [DOI] [PMC free article] [PubMed] [Google Scholar]
- 21.Anderson AC. Tim-3: an emerging target in the cancer immunotherapy landscape. Cancer Immunol Res. 2014;2:393–398. doi: 10.1158/2326-6066.CIR-14-0039. [DOI] [PubMed] [Google Scholar]
- 22.Sakuishi K, Apetoh L, Sullivan JM, Blazar BR, Kuchroo VK, Anderson AC. Targeting Tim-3 and PD-1 pathways to reverse T cell exhaustion and restore anti-tumor immunity. J Exp Med. 2010;207:2187–2194. doi: 10.1084/jem.20100643. [DOI] [PMC free article] [PubMed] [Google Scholar]
- 23.Guo Z, Cheng D, Xia Z, Luan M, Wu L, Wang G. Combined TIM-3 blockade and CD137 activation affords the long-term protection in a murine model of ovarian cancer. J Transl Med. 2013;11:215. doi: 10.1186/1479-5876-11-215. [DOI] [PMC free article] [PubMed] [Google Scholar]
- 24.Qadri Q, Rasool R, Gulzar GM, Naqash S, Shah ZA. H. pylori infection, inflammation and gastric cancer. J Gastrointest Cancer. 2014;45:126–132. doi: 10.1007/s12029-014-9583-1. [DOI] [PubMed] [Google Scholar]
- 25.Hu S, Xie Y, Zhou N, Jin L, Tan Y, Liu D. Expression of T-cell immunoglobulin- and mucin-domain-containing molecules-1 and -3 (Tim-1 and Tim-3) in Helicobacter pylori infection. Helicobacter. 2011;16:373–381. doi: 10.1111/j.1523-5378.2011.00855.x. [DOI] [PubMed] [Google Scholar]
- 26.Tummuru MK, Cover TL, Blaser MJ. Cloning and expression of a high-molecular-mass major antigen of Helicobacter pylori: Evidence of linkage to cytotoxin production. Infect Immun. 1993;61:1799–1809. doi: 10.1128/iai.61.5.1799-1809.1993. [DOI] [PMC free article] [PubMed] [Google Scholar]
- 27.Atherton JC, Cao P, Peek RM, Tummuru MK, Blaser MJ, Cover TL. Mosaicism in vacuolating cytotoxin alleles of Helicobacter pylori: association of specific vacA types with cytotoxin production and peptic ulceration. J Biol Chem. 1995;270:17771–17777. doi: 10.1074/jbc.270.30.17771. [DOI] [PubMed] [Google Scholar]
- 28.Atherton J, Peek R, Tham K, Cover T, Blaser M. Clinical and pathological importance of heterogeneity in vacA, the vacuolating cytotoxin gene of Helicobacter pylori. Gastroenterology. 1997;112:92–99. doi: 10.1016/s0016-5085(97)70223-3. [DOI] [PubMed] [Google Scholar]
- 29.Zabaleta J, McGee DJ, Zea AH, Hernández CP, Rodriguez PC, Sierra R. Helicobacter pylori arginase inhibits T cell proliferation and reduces the expression of the TCR zeta-chain (CD3zeta) J Immunol. 2004;173:586–593. doi: 10.4049/jimmunol.173.1.586. [DOI] [PubMed] [Google Scholar]
- 30.Pène J, Chevalier S, Preisser L, Vénéreau E, Guilleux MH, Ghannam S. Chronically inflamed human tissues are infiltrated by highly differentiated Th17 lymphocytes. J Immunol. 2008;180:7423–7430. doi: 10.4049/jimmunol.180.11.7423. [DOI] [PubMed] [Google Scholar]
- 31.Rivino L, Messi M, Jarrossay D, Lanzavecchia A, Sallusto F, Geginat J. Chemokine receptor expression identifies Pre-T helper (Th)1, Pre-Th2, and nonpolarized cells among human CD4+ central memory T cells. J Exp Med. 2004;200:725–735. doi: 10.1084/jem.20040774. [DOI] [PMC free article] [PubMed] [Google Scholar]
- 32.Qin S, Rottman JB, Myers P, Kassam N, Weinblatt M, Loetscher M. The chemokine receptors CXCR3 and CCR5 mark subsets of T cells associated with certain inflammatory reactions. J Clin Invest. 1998;101:746–754. doi: 10.1172/JCI1422. [DOI] [PMC free article] [PubMed] [Google Scholar]
- 33.Monney L, Sabatos CA, Gaglia JL, Ryu A, Waldner H, Chernova T, Manning S, Greenfield EA, Coyle AJ, Sobel RA, Freeman GJ, Kuchroo VK. Th1-specific cell surface protein Tim-3 regulates macrophage activation and severity of an autoimmune disease. Nature. 2002;415:536–541. doi: 10.1038/415536a. [DOI] [PubMed] [Google Scholar]
- 34.Hastings WD, Anderson DE, Kassam N, Koguchi K, Greenfield E, Kent SC. TIM-3 is expressed on activated human CD4+ T cells and regulates Th1 and Th17 cytokines. Eur J Immunol. 2009;39:2492–2501. doi: 10.1002/eji.200939274. [DOI] [PMC free article] [PubMed] [Google Scholar]
- 35.Sakuishi K, Ngiow SF, Sullivan JM, Teng MWL, Kuchroo VK, Smyth MJ. TIM3(+)FOXP3(+) regulatory T cells are tissue-specific promoters of T-cell dysfunction in cancer. Oncoimmunology. 2013;2:e23849. doi: 10.4161/onci.23849. [DOI] [PMC free article] [PubMed] [Google Scholar]
- 36.Sakuishi K, Sullivan J, Kuchroo V, Anderson A. FoxP3+Tim-3+ Tregs are site-specific suppressors supporting tumor growth by influencing the functional phenotype of tumor-infiltrating lymphocytes. J Immunol. 2012;188:46–50. [Google Scholar]
- 37.Noy R, Pollard JW. Tumor-Associated Macrophages: From Mechanisms to Therapy. Immunity. 2014;41:49–61. doi: 10.1016/j.immuni.2014.06.010. [DOI] [PMC free article] [PubMed] [Google Scholar]
- 38.Malfertheiner P, Selgrad M. Helicobacter pylori. Curr Opin Gastroenterol. 2014;30:589–595. doi: 10.1097/MOG.0000000000000128. [DOI] [PubMed] [Google Scholar]


