Abstract
A computational framework was developed to assist in screening and prioritizing chemicals based on their dosimetry, toxicity, and potential exposures. The overall strategy started with contextualizing chemical activity observed in high-throughput toxicity screening (HTS) by mapping these assays to biological events described in Adverse Outcome Pathways (AOPs). Next, in vitro to in vivo (IVIVE) extrapolation was used to convert an in vitro dose to an external exposure level, which was compared with potential exposure levels to derive an AOP-based margins of exposure (MOE). In this study, the framework was applied to estimate MOEs for chemicals that can potentially cause developmental toxicity following a putative AOP for fetal vasculogenesis/angiogenesis. A physiologically based pharmacokinetic (PBPK) model was developed to describe chemical disposition during pregnancy, fetal, neonatal, and infant to adulthood stages. Using this life-stage PBPK model, maternal exposures were estimated that would yield fetal blood levels equivalent to the chemical concentration that altered in vitro activity of selected HTS assays related to the most sensitive vasculogenesis/angiogenesis putative AOP. The resulting maternal exposure estimates were then compared with potential exposure levels using literature data or exposure models to derive AOP-based MOEs.
Keywords: PBPK, AOPs, life-stage, developmental toxicology, environmental toxicology
Adverse outcome pathways (AOPs) provide a biologically-based framework for linking molecular initiating events (MIEs) triggered by chemical exposures to cellular key events (KEs) leading to adverse outcomes (AOs) (Ankley et al., 2010). Putative AOPs may be developed where molecular/cellular responses to a chemical are experimentally determined using in vitro assays and are linked to KEs leading to an AO. Once constructed, these AOPs may be used qualitatively to evaluate chemicals for potential toxicity, and in some cases, quantitatively to build mechanistic models for predicting dose/response relationships and health risk estimates. One example of a putative AOP that is related to developmental toxicity was developed by Kleinstreuer et al. (2013). They used targeted high-throughput screening (HTS) and high-content screening assays to identify biological signatures for events critical to blood vessel formation, maintenance, and remodeling to develop a putative AOP for disruption of developmental vasculogenesis/angiogenesis. Disruption of vascular development has been directly correlated with prenatal loss, malformations, maternal placental complications, and neuro developmental problems (Kleinstreuer et al., 2013; Knudsen and Kleinstreuer, 2011; Tal et al., 2014).
To assist in developing and applying AOPs to Human Health Risk Assessment (HHRA), the U.S. Environmental Protection Agency ToxCast research project and the Federal Tox21 consortium are leading large-scale efforts to profile the biological activities of thousands of chemicals across multiple in vitro assays (Dix et al., 2007). However, the application of AOPs to HHRA necessitates the extrapolation of in vitro HTS data to in vivo doses which are converted to external exposure levels where regulatory limits are set. Such in vitro to in vivo extrapolation (IVIVE) helps interpret the biological plausibility of nominal in vitro concentrations that induce toxicity by placing them in the context of tissue concentrations that may be reasonably achieved in the whole organism due to real-life exposure scenarios. However, linking tissue concentrations to external doses requires the understanding and characterization of absorption, distribution, metabolism, and excretion (ADME) for each chemical within the context of the relevant AOP (Strikwold et al., 2013).
Existing approaches for IVIVE that utilize HTS data are usually based on predictions for an oral equivalent dose that will produce steady-state blood levels comparable to the HTS in vitro assay concentration where half-maximal effects are observed (ie, AC50) (Judson et al., 2011; Rotroff et al., 2010; Wetmore et al., 2012). In most cases, such an assumption is appropriate when blood levels are reasonable surrogates for target tissue levels, and steady-state blood levels are attained quickly for chemicals with short half-lives. However, in situations where target tissue levels are different from blood, perhaps due to accumulation of a chemical because of specific protein binding, deposition in the lipid phase, or active membrane transport activation or inhibition, external equivalent doses estimated based on steady-state blood levels are inadequate. In other situations, steady-state assumptions may not be appropriate due to rapidly changing physiological processes, as is the case during pregnancy and fetal, perinatal and infant development. In these situations, temporal changes in physiological and biochemical processes impacting a chemical’s ADME and/or toxicity should be explicitly described using life-stage physiologically based pharmacokinetic (PBPK) modeling for more appropriate IVIVE (Martin et al., 2015).
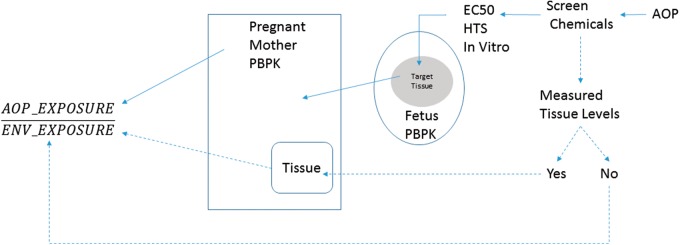
Here we present the development of a computational framework that utilized life-stage PBPK models in combination with AOP-interpretable HTS in vitro and observed or predicted environmental concentrations to screen and prioritize chemicals based on margins of exposure (MOE) estimates. Figure 1 illustrates this screening process in which health risks that arise from exposure to chemicals can be assessed based on an understanding of chemicals’ interactions with target tissues based on their ADME properties, and in vitro dose-response data as outlined in relevant AOPs. This generalizable PBPK-HTS approach, was applied to a set of selected chemicals that were screened following a putative vasculogenesis/angiogenesis disruption AOP. The selected chemicals were perfluorooctanesulfonic acid (PFOS), Triclosan [5-chloro-2-(2,4-dichlorophenoxy)phenol], Pyridaben [2-tert-butyl-5-[(4-tert-butylphenyl)methylsulfanyl]-4-chloropyridazin-3-one], and Fluazinam [3-chloro-N-[3-chloro-2,6-dinitro-4-(trifluoromethyl)phenyl]-5-(trifluoromethyl)pyridin-2-amine]. These four chemicals demonstrate the versatility of the computational approach to estimate AOP-Based MOEs for chemicals spanning a range of efficacies for triggering various MIEs in a putative fetal vasculogenesis/angiogenesis disruption AOP where human environmental exposure data exist (PFOS), or are absent (Pyridaben, Triclosan, and Fluazinam).
FIG. 1.
A schematic depicting flow of information to estimate an AOP-based Margin of Exposure. The AOP-derived MOE is the ratio of the PBPK model-derived in vivo exposure needed for the chemical to illicit biological activity (as described by the AOP) to the chemical’s environmental exposure estimate. The steps needed for the derivation of the in vivo exposure levels are depicted using the solid lines. The dashed lines represent steps taken to estimate environmental exposure levels. An AOP is used to select chemicals and determine their toxicity potential using in vitro HTS data. The chemicals are queried for any documented tissue levels (eg, blood or urine in literature or using NHANES data). If this data are available, the PBPK model for the mother is used to reconstruct Life-Time exposure (ENV_EXPOSURE) (as was shown for PFOS). If this data is not available, elaborate exposure models such as SHEDS-HT is used to estimate environmental exposures (ENV_EXPOSURE). Similarly, using the in vitro levels in target tissue (eg, fetal blood), the AOP_EXPOSURE is constructed by the PBPK model. The AOP-based Margin of Exposure is estimated as the ratio of the AOP_EXPOSURE to ENV_EXPOSURE.
MATERIALS AND METHODS
Overall life-stage PBPK model
Physiological descriptions of life-stages for fetus, neonate, growing child, and pregnant woman were considered in the overall PBPK model (Figure 2). The inclusion of the life-stages was intended for the purpose of estimating maternal blood levels during pregnancy as a result of lifetime exposure to chemicals suspected of bioaccumulation to varying degrees. The life-stage PBPK model was applied by assuming initial blood levels of the chemicals to be negligible for a neonate at birth. Afterwards, model simulations starts by considering increasing chemical oral intake rate based on increasing bodyweight of a neonate and continues until adulthood and during pregnancy (conception was assumed to occur at age 25 years). During pregnancy, the model is extended to include a fetal PBPK submodel to predict in vivo chemical concentrations in fetal blood. For every life-stage, the predicted blood concentrations can be related to in vitro dose–response data obtained from HTS assays in view of the AOP of concern
FIG. 2.
Schematic of the Life-Stage PBPK Model compartments and time line. Growing child is modeled using a PBPK model until conception (assumed at age 25). The PBPK model is then converted to a pregnancy one and included a fetal sub-model. The fetal sub-model illustrates the directions of blood flow as the chemical(s) is distributed to fetal tissues with descriptions for shunts (ductus venosus DV, and ductus arteriosus DA) and the foramen ovale (FO) in the heart. Influence of the shunts and FO is reduced until they disappear as the fetus is born and the submodel continues to describe a neonate.
Physiological parameters for the neonate, infant, growing child, and nonpregnant woman were obtained from the literature (Brown et al., 1997; Clewell et al., 2007; Gentry et al., 2003). Information on body growth for female children and adults were obtained from the National Center for Health Statistics. Partition coefficients for the four selected chemicals were obtained using ADMET Predictor and GastroPlus software (Simulations Plus, California). Oral absorption constants for each chemical were also obtained using GastroPlus and are described by first order kinetics using a first order constant rate Ka (h−1).
PBPK parameters for the growing child
The PBPK submodel for the neonate/infant and growing child to adulthood (before pregnancy) included tissue compartments for skin, fat, brain, mammary, uterus, kidney, liver, lung, and slowly and rapidly perfused tissue. The volumes of the tissue compartments were linearly scaled, using tissue fractions from published literature based on increasing bodyweight (Brown et al., 1997). Blood flows to the compartments were also scaled linearly as a fraction of total cardiac output which was described using the following equation (Jegier et al., 1963).
where x is cardiac output (l/h), and BW(t) (kg) is body weight of an infant at time t (h).
Clearance of the chemicals during childhood growth was described via hepatic metabolism and systemic renal excretion. Temporal in vivo hepatic clearance rates were accounted for by linearly scaling values obtained from HTS in vitro hepatic clearance rates as described later in the hepatic clearance IVIVE section. This linear scaling for hepatic metabolism was adequate for life-time exposure situations as was illustrated when compared with available enzyme ontogeny information (as shown later for CYP1A2 ontogeny example in the results section). Temporal change in renal clearance was scaled based on body surface area (SA).
The maturation of kidney structure and function has a profound impact on those drugs that depend on renal clearance for elimination and/or termination of pharmacological action (Hines, 2008). Vasoconstriction and reduced renal blood flow result in a substantially diminished glomerular filtration rate (GFR) in the term infant versus the adult. With parturition and the resulting decrease in vascular resistance and increase in cardiac output and renal blood flow, GFR increases rapidly and approaches adult levels by the first year of life (Alcorn and McNamara, 2003). Therefore, an equation that describes the change of GFR rate during infant development was developed using data from Alcorn and McNamara (2003) as:
where GFR is given in ml/min/m2. Converting GFR units from ml/min/m2 to ml/min was obtained by multiplying the equation above with the changing SA of a developing infant to adulthood and during pregnancy. SA, as a function of bodyweight BW(t), is modeled for different life stages according to data obtained from the literature (Coulthard, 1994) as follows:
where SA(T) is SA (m2), and BW(t) (kg) is body weight of a growing female up to adulthood (age at conception is 25 years) and during pregnancy.
Tissue growth during pregnancy
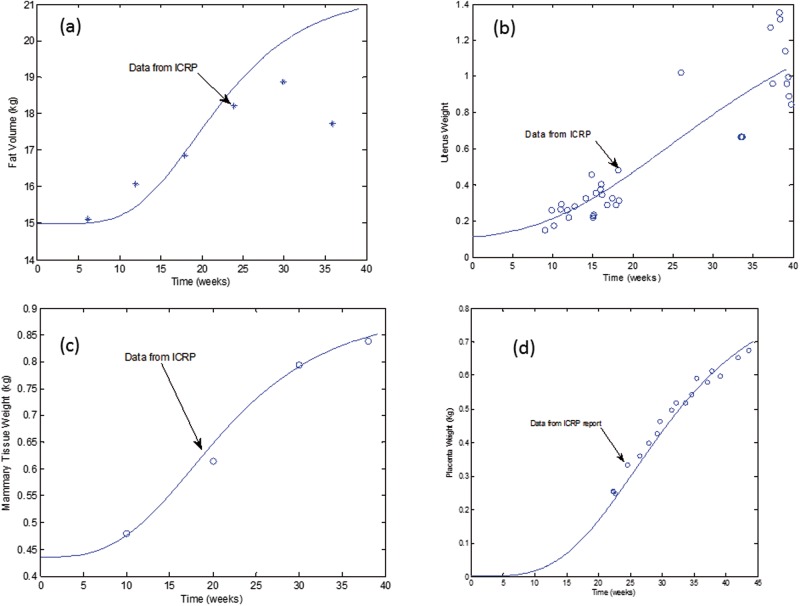
Mathematical equations were derived to describe growth of fat, mammary gland, uterus, and placenta in a woman during pregnancy using information from the Annals of International Commission on Radiological Protection report (ICRP) (Valentin, 2003).
For fat tissue volume growth, the following equation was derived and optimized using available data from the ICRP report (Figure 3a):
VFat (t) represents the time dependent fat tissue volume (l) during pregnancy, VF is baseline fat volume of an adult female at 25 years age (l), BW (kg) is total body weight, and t is gestational time (h).
FIG. 3.
Mathematical equations fit to data describing growth of tissues during pregnancy. Data were obtained from the ICRP (1989).
Uterus growth during pregnancy was described using the following equation:
where VUter (t) is time dependent uterus volume (l) in a pregnant female, VU is baseline uterus volume at 25 years age (l), BW is total body volume (l), and t is gestational time (h). The derived equation fit compared with available data is shown in Figure 3b.
Mammary tissue growth was described using the following equation:
where VMam (t) is time dependent mammary tissue volume (l) during gestation, VM is baseline mammary tissue volume at 25 years age (l), BW is total body volume (l), and t is gestational time (h). Figure 3c illustrates the fit of the equation to data for mammary tissue growth during pregnancy.
Placenta growth was described using the following equation:
where VPla(t) is time dependent placenta tissue volume (l), and t is gestational time (h). Figure 3d illustrates the fit of the equation to data for placental growth during pregnancy.
Using the equations above for fat, uterus, mammary tissue, and placenta volume growth, the total body volume for the mother during pregnancy can then be estimated as:
where x is the mother’s body volume during pregnancy (l), BW is the body weight (kg) before conception (at age 25years), and VFet (t) is the time dependent fetal weight (kg) (given under the ‘Fetal PBPK Submodel’ section).
Tissue blood flows during pregnancy
Total cardiac output is changed during pregnancy, and data from the ICRP report were used to optimize a mathematical equation in the following form:
where x is cardiac output during pregnancy (l/h), and t is gestational time (h).
Fractional tissue blood flows for the fat, uterus, and mammary gland compartments were linearly scaled to the ratio of their respective volume increase over a steady state baseline volume at conception (Gentry et al., 2003). For the other tissues, blood flows rates were set to values used for an adult female at age 25.
Fetal PBPK submodel
The fetus tissue compartments consisted of the plasma, lungs, fat, brain, liver, kidneys, and the rest of the body, and the temporal growth of these tissues were modeled by fitting data for each to an empirical equation. Data for deriving the equations for the tissues were obtained from (Luecke et al., 1995) and the ICRP report.
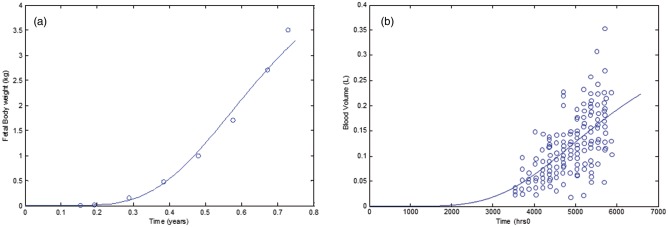
Total fetal body weight growth is described using the following equation as described by data from ICRP report (Figure 4a):
where Vfet(t) is the fetal body volume (l) and t (h) is the time after conception. Volume of fetal plasma was modeled using an exponential function with parameters adopted from Leucke et al. (1995) and checked against data from (Smith and Cameron, 2002) (Figure 4b).
FIG. 4.
Mathematical equations fit to data describing a, fetal volume; b, fetal blood volume.
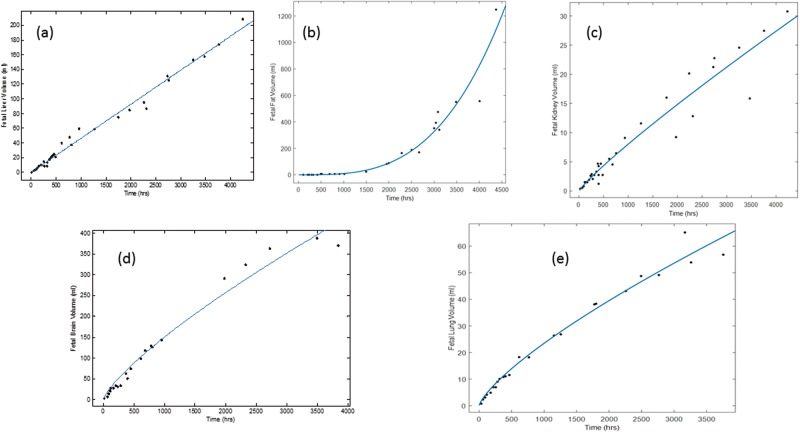
Fetal liver, kidneys, fat, lungs, and brain volume growth data (Leucke et al., 1995) were fitted to an exponential function as follows:
where x is the fetal tissue volume (l) at a particular time t. The fit of the exponential equation to data is shown in Figure 5 for each tissue with their corresponding parameter (a and b) estimates. The rest of the fetal body was considered to be mostly muscle, bone, heart, thymus and thyroid, which were summed using equations provided by Luecke et al. (1995).
FIG. 5.
Mathematical equations (a*Vfetb) fit to data describing fetal tissue volumes, where Vfet is the volume of fetus, for a, liver (a = 0.05, b = 0.99); b, fat (a = 0.01, b = 3.22); c, kidney (a = 0.01. b = 0.9); d, brain (a = 0.15, b = 0.77); and e, lung (a = 0.024, b = 0.752). Data were refit from Luecke et al. (1995).
In an adult, blood circulates from the left ventricle to the systemic circulation and is returned to the right side of the heart, where it circulates through the lungs for reoxygenation. This serial circulatory design is inappropriate for the fetus because oxygenation occurs in the placenta; therefore, a parallel circulation is present. This is made possible by anatomical shunts, which normally close rapidly at birth when circulation independent of the mother is required (Dawes, 1968; Rudolph, 1985).
Available literature data were used to derive mathematical equations describing blood flow to tissues in the fetal model. High-resolution color Doppler ultrasound technology was used by Mielke and Benda (2001) to conduct a prospective study in 222 normal fetuses from 13 to 41 weeks of gestation to show that the right, left, biventricular heart blood output increased exponentially with gestational age. In the fetal PBPK model, total cardiac output in the fetus (Qcf) was assumed to be equal to the sum of flow from the left ventricular heart (Qlvf) and flow from the ductus arteriosus (Qda). Qlvf (ml/min) is fitted to data using the exponential function, Qlvf = 53.68exp(0.06103t); where t is gestational time (weeks). Qda (ml/min) is similarly described by fitting data to the following exponential function: Qda = 49.66exp (0.0693t). Blood flow through the formane ovale (QFA) was approximated to equal Qlvf (Baschat, 2006). Blood flow from the right ventricular (Qrvf) (ml/min) was also fitted to data using the following exponential function Qrvf = 59.73exp(0.071t). (Mielke and Benda, 2001). Figures 6a–c are illustrations of derived equations fit to data for Qlvf, Qda, and Qrvf; respectively.
FIG. 6.
Mathematical equations fit to data describing fetal blood flow for a, heart left ventricular; b, ductus arteriosus; c, heart right ventricular; d, portal vein; and e, kidney.
Fetal total cardiac output (Qcf) is equal to sum of blood flows to fetal tissues and placenta (Qcf=∑Qt + Quv), where Qt is blood flow to tissue and Quv is the umbilical vein blood flow (via placenta). Qcf also is equal to Qda+ Qlvf, thus Qda + Qlvf = ∑Qt + Quv. To continue with the kinetic modeling of chemicals after birth, total blood flows after birth (Qlvf) (where Quv = 0, and Qda = 0) was set equal to all cardiac output flowing to tissues (∑Qt = Qlvf). This leads to the assumption that umbilical blood flow (Quv) during gestation must be to be equal to flow through the ductus arteiosis (Qda), which disappears after birth.
Fetal blood flow to the liver (Qlivf) was described using the portal vein component that is derived from ductal flow (Qpvf) and a direct liver flow via the ductus venosus (Qdv) from umbilical blood flow. Qpvf (ml/min) was fitted against data using the following equation: Qpvf = 0.5737*exp(0.1116 t) where t is gestational weeks (Kessler et al., 2011; Figure 6d). Blood flow through the ductus venosus (Qdv) was assumed to be 30% of the umbilical vein blood flow (Quv) (Haugen et al., 2004; Kessler et al., 2006; Kiserud et al., 2000).
Fetal blood flow to the lungs (Qlungf) was set equal to flow originating from the heart right ventricular compartment (Qrvf) minus the flow via the ductus arteriosus (Qda). No data were available on blood flow to fat in the fetus. In the fetal PBPK sub-model, blood flow to fetal fat (Qfatf) was scaled back from the baseline of an infant (5.2% of total blood flow) based on ratio of temporal fetal fat tissue to total fetal volume using the following equation:
Where Qcf is fetal cardiac output (ml/min), Vfatf is the volume of fetal fat (l), Vfet is the fetal volume (l). Hence, fetal fat flow will increase with increasing fat tissue volume until it reaches the neonatal level.
Kiserud et al. (2005) and Baschat (2006) approximated blood flow to the fetal brain to be approximately equal to total cardiac output less the pulmonary circuit. Hence blood flow to the brain (Qbrf) was set equal to the blood flow from the heart left ventricular compartment (Qlvf). Fetal blood flow to the kidneys (Qkidf, ml/min) was fitted to an exponential function using available data from Veille et al. (1993) as shown in the equation: Qkidf= (4.635exp(0.0716t); where t is gestational weeks (as shown in Figure 6e).
The rest of fetal body blood flow (Qbf) was calculated as the difference between total fetal blood flow (Qcf) and blood flows to the brain, liver, kidneys, fat, and lungs. Descriptions of the fetal PBPK submodel equations are given in the Appendix.
Hepatic clearance IVIVE
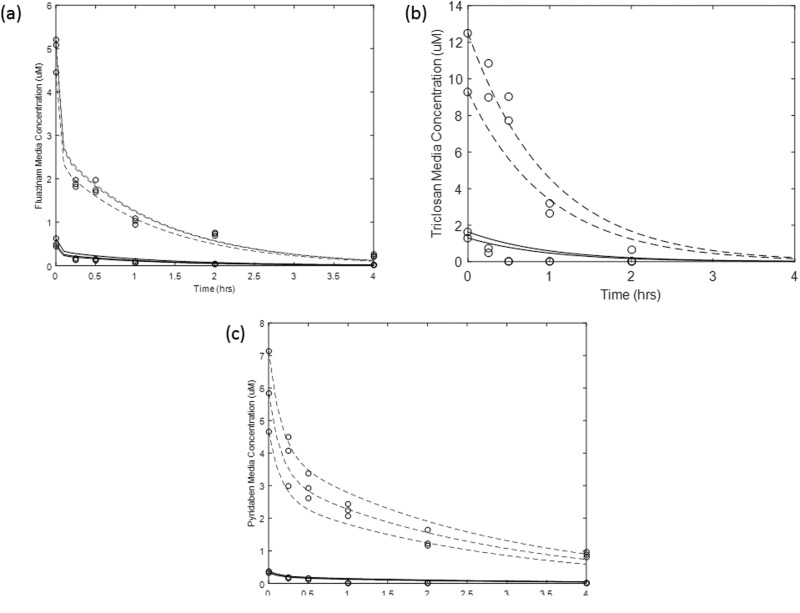
During infant growth to adulthood, temporal in vivo hepatic clearance rates were estimated by linear scaling of in vitro HTS clearance rates using hepatocyte content as a function of liver weight. Data for HTS in vitro hepatic clearance per hepatocyte content were generated using time course levels of chemicals in media in the presence of human hepatocytes at 2 different initial concentrations (1 and 10 µM) (Wetmore et al., 2012, 2014). Time-course data generated for the disappearance of chemicals using both initial concentrations were used simultaneously to calculate in vitro clearance values for the selected chemicals. The calculations were based on modified equations accounting for passive diffusion into cells, and hepatic clearance (Poirier et al., 2009a,b).
The following equation was used to estimate concentrations of the chemical in media:
The following equation was used to estimate concentration of the chemical in cells
where Acell and Am are the amounts (pmoles) of the chemical in cellular and media matrices, respectively. Vcell and Vintra are the cell volume (3.9 µl per 1 million cells) and the total cellular volume (µl), which was calculated using the number of cells in media; respectively. Pdiff (µl/h•million cells) is the first order constant describing the diffusion of the chemical from media to the cellular matrix. Cl is the first order in vitro hepatic clearance rate (µl/h).
Estimation for in vitro hepatic clearance rate using all available data for each selected chemical was achieved by optimizing for Cl and Pdiff for each chemical (Figure 7). The optimized value for Cl was then converted to an in vivo hepatic clearance rate for an adult liver using GastroPlus metabolism conversion function.
FIG. 7.
Determination of in vitro clearance rates by fitting data to equations that included descriptions for intra cellular diffusion for a, Fluazinam; b, Triclosan; and c, Pyridaben. The dashed and solid lines are fitted lines to data (given in circles) at the 1 and 10 µM for each chemical initial media concentrations, respectively. The estimated in vitro clearance rates were 0.012, 0.59, 0.01 µl/min per million cells for Fluazinam, Triclosan and Pyridaben, respectively.
A comparison between our estimates and published metabolic rates was conducted for Triclosan (the only selected chemical that had measurement data available). Following absorption, Triclosan is metabolized primarily through conjugation reactions to glucuronide and sulfate conjugates that are eliminated in feces and urine (Wang et al., 2004). Using the Wetmore et al. (2012) in vitro time course data to estimate Cl for Triclosan did not allow us to differentiate between the conjugation pathways for Triclosan metabolism. Therefore, the comparison was made between our in vivo calculated clearance rates and the combined calculated in vivo intrinsic rates from published data. This comparison is reasonable since Wang et al. (2004) suggested that Triclosan glucuronide and sulfate may be formed in the liver at approximately equal rates at environmentally relevant concentrations (1 to 5 μM). Our optimization of the in vitro data for Triclosan resulted in an in vivo Cl estimate of 46 l/h which falls within the range of the converted in vivo estimated values of the combined published in vitro intrinsic metabolic rates in human liver cytosol and microsomes (35–105 l/h) (Wang et al., 2004).
For all studied chemicals, the resulting hepatic clearance rates were scaled using hepatocyte content. To account for life-stage changes in enzyme activities, hepatocyte content was modeled as a product of hepatocellularity per gram of liver, and liver weight (Barter et al., 2007).
In vitro HTS data
The U.S. EPA ToxCast project provides HTS data on an expanding chemical library currently consisting of close to 2000 unique compounds across >700 in vitro assays in Phases I and II (complete) and Phase III (under way). This public data set can be used to evaluate concentration-dependent effects on many diverse biological targets and build predictive models of prototypical AOPs that can aid decision making for assessments of human developmental health and disease (Kavlock et al., 2012). These in vitro assays measure direct interactions between chemicals and molecular targets (eg, receptors, enzymes), as well as downstream effects on reporter gene activity or cellular consequences. Quantitative measures of in vitro activity, such as half-maximal activity concentration (AC50), lowest effective concentration, or statistically significant measures from controls, were derived for each assay–chemical combination (Kleinstreuer et al., 2013, 2014). For the selected chemicals, the HTS assays that mapped to the putative fetal vasculogenesis/angiogenesis disruption AOP were screened against all assays in the ToxCast database using the iCSS dashboard (http://actor.epa.gov/dashboard2). The matched assays were then considered for determining the most sensitive AOP-related HTS assay with the lowest AC50 (LAC) value for each chemical.
Environmental exposure predictions
To illustrate the utility of the computational approach to estimate AOP-based MOEs, chemicals were selected so that lifetime environmental exposures to pregnant women could either be estimated using available data (PFOS) or using exposure models such as SHEDS-High Throughput (SHEDS-HT) (Pyridaben, Triclosan, and Fluazinam). SHEDS-HT is a physically based, probabilistic, high-throughput model that can simulate aggregate exposures via dietary and residential routes of exposure for multimedia, multipathway environmental chemicals (Isaacs et al., 2014). SHEDS-HT has recently been parameterized for approximately 2500 case-study chemicals using information describing chemical presence in (1) household consumer products and (2) foods and drinking water. Input data for consumer products were derived from material safety data sheet sources (Goldsmith et al., 2014), while food and water concentrations were obtained from the USDA Pesticide Data Program databases (USDA, 2014). Table 1 provides a list of SHEDS-HT exposure predictions for the adult female in the U.S. population for Pyridaben, Triclosan, and Fluazinam.
TABLE 1.
Predicted Oral Exposures Using SHED-HT Model (mg/kg/d)
| Chemical | CAS | Mean | SD | 50% Percentile | 99% Percentile |
|---|---|---|---|---|---|
| Triclosan | 3380-34-5 | 0.0341 | 0.0567 | 0.0209 | 0.2133 |
| Fluazinam | 79622-59-6 | 3.2E-7 | 1.6E-6 | 2.32E-9 | 7.52E-6 |
| Pyridaben | 96489-71-3 | 7.48E-5 | 0.0001 | 1.53E-5 | 0.0007 |
Sensitivity analysis
In general, if one considers that the model’s system of equations can be written as , where is the vector of state variables (predicted blood levels) and is the vector of the set parameters (eg, Vmax or Km), then the derivation of the sensitivity equations can be described as:
Switching the order of differentiation leads to a system of ordinary differential equations (ODEs) whose state variables represent the sensitivity of the model states to each parameter. The formulation of the sensitivity equations was completed using the automatic differentiation package for MATLAB, (available at www.mathworks.com/matlabcentral). The system of sensitivity equations were integrated along with the model equations, using MATLAB’s ODE solver. Finally, the sensitivities were normalized by dividing by the value of the state variable, and multiplying by the parameter for which the derivative was being determined (ie, ). Normalizing the sensitivities ensures that observed changes are equivalent regardless of the initial magnitude of the parameter or state variable. Results for the most sensitive parameters for the mother and fetal predictions of chemical(s) blood levels are given in Figures 8 and 9; respectively. As expected, the oral absorption constant is most sensitive at the beginning of exposure while body weight and hepatic clearance become more sensitive as chemicals are distributed throughout the body (Figure 8). For the fetal model, the partition coefficients to placenta are most important initially while the brain and fat partition coefficients become more significant as the fetus and tissues grow (Figure 9).
FIG. 8.
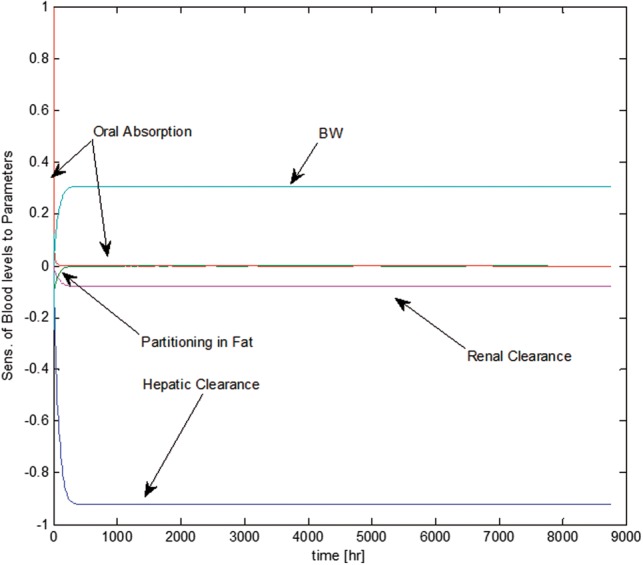
Temporal descriptions of the most sensitive parameters to blood levels of the maternal PBPK sub-model.
FIG. 9.
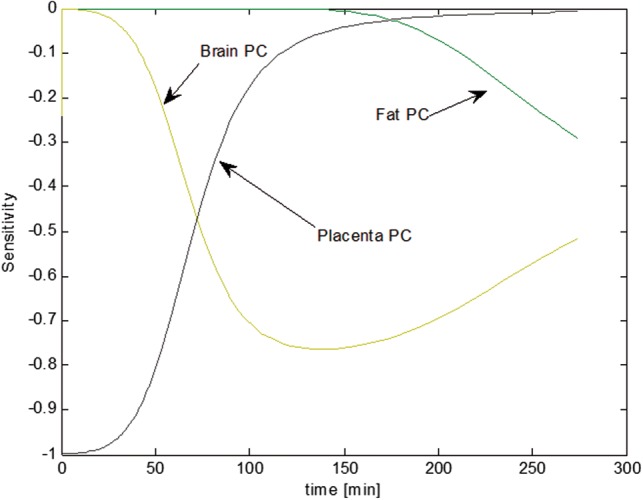
Temporal descriptions of the most sensitive parameters to blood levels of the fetal submodel.
RESULTS
Impact of Life-time Exposure on Hepatic Metabolic Scaling During Growth
Quantitative descriptions of metabolic activity changes during development are dependent on specific enzyme ontogeny information, which is dependent on the chemical(s) of concern. These descriptions require the investigations of (1) the type of enzyme(s) involved in metabolic activity, (2) changes in their life-time expression levels, if any, during child development, and (3) the quantitative impact of expression changes on metabolic activity. The identity of enzymes involved in chemical hepatic metabolism can be obtained from the literature if available, can be estimated using commercial software, or can be determined experimentally using recombinant enzyme systems. Information about enzyme ontogeny and expression changes during child development are increasingly available in the literature, as recently reviewed by Hines (2013). The quantitative impact of changes in enzyme expression during development can then be assessed by scaling of adult enzyme activity using ratios of child to adult enzyme expression levels. When information about metabolic enzyme ontogeny during development is lacking, direct (using hepatocyte content) or allometric (using bodyweight to ¾ power) can be used for estimation of adult blood levels in response to life-time environmental chemical exposure (Zaya et al., 2006). The majority of enzymes involved in drug and toxicant disposition are expressed at lower levels, if any, at birth, but expression can increase dramatically in the perinatal period, generally achieving mature levels within a few weeks to between 6 months and 2 years after birth (Hines, 2008). However, the impact of low or absent enzyme expression in the neonate and infant is diminished or negligible for estimating steady-state blood levels based on life-time chemical exposures, as is done in this study.
For example, CYP1A2 ontogeny is more delayed, as reviewed by Hines (2012). CYP1A2 is not detectable in fetal liver, but a progressive increase in catalytic activity and protein levels is observed in postnatal samples with neonates at 4–5% of adult levels, tissue from 1- to 3-month-old infants at 10–15% of adult levels, samples from 3- to 12-month-old children at 20–25% of adult levels, and samples from children aged 1–9 years at 50–55% of adult. Data describing temporal CYP1A2 ontogeny was mathematically described using the interpolation function in MatLab (Mathworks) as shown in Figure 10. The resulting mathematical description was then used to investigate the difference in blood levels predictions for a chemical during lifetime exposure using both developmental ontogeny data or direct scaling (using hepatocyte content) as shown in Figure 11. During the neonatal and early childhood stages, predicted blood levels of the chemical would be considerably higher than the steady-state levels attained during adulthood. However, simulated blood levels using both ontogeny adjusted or direct scaling of hepatic clearance converge to the same steady state by 16–17 years of age. Figure 11 illustrates that direct hepatocyte content scaling during development is adequate for estimating steady-state blood levels in adulthood during lifetime exposure scenarios in absence of detailed enzyme ontogeny data. However, this scaling is not appropriate when early life-stages of children health are of concern.
FIG. 10.
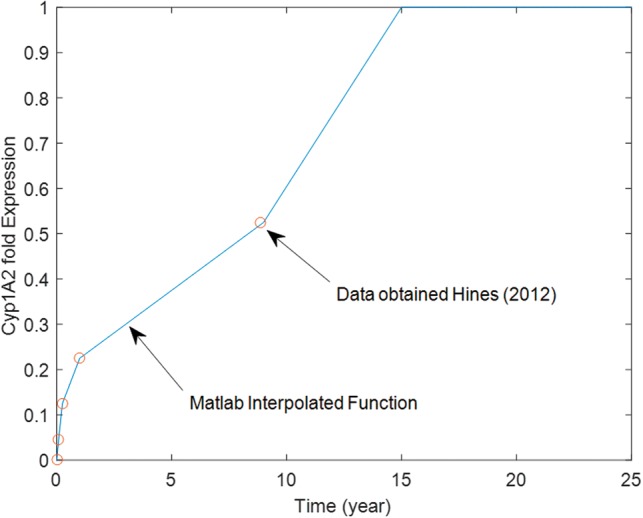
Ontogeny profile for CYP1A2. Data were obtained from Hines (2012) and interpolated to provide a function of age as described by the solid line for use in the life-stage PBPK model.
FIG. 11.
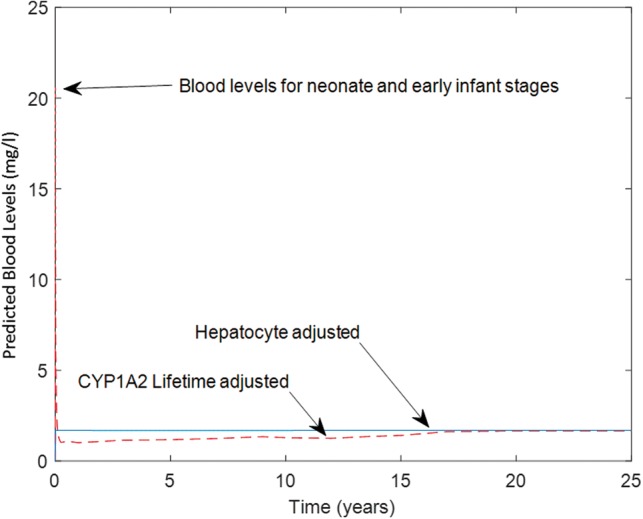
Impact of including CYP1A2 ontogeny function (dashed line) in comparison to direct scaling using liver hepatocyte content (solid line) on predicted blood levels during life-stages from neonate to adulthood.
Estimation of the Developmental Vasculogenesis/Angiogenesis Disruption AOP-Based MOE For PFOS Acid
The life-stage PBPK model was used to estimate 25-year old pregnant woman PFOS exposure levels resulting in maximal fetal blood levels equivalent to a potential level of concern as determined from AOP-based in vitro assays. For this purpose, a modification to the model specific to PFOS kinetics was performed to consider renal reabsorption of the chemical as was described earlier (Loccisano et al., 2013). This process was described using saturable kinetics with a maximal rate of 3.5 µg/h/kg0.75, and a concentration of 0.023 µg/l at half maximal reabsorption rate (Loccisano et al., 2013). Partition coefficients for the chemical were estimated using GastroPlus software utilizing tissue specific compositions and chemical lipophilic potential (Table 2). Metabolism of PFOS was considered to be insignificant (ATSDR, 2009).
TABLE 2.
Chemical Specific Model Parameters Estimated Using GastroPlus
| Chemical | PFOS | Triclosan | Pyridaben | Fluazinam |
|---|---|---|---|---|
| Fraction unbound | 0.092 | 0.072 | 0.067 | 0.092 |
| Lung PC | 0.21 | 0.95 | 0.95 | 0.95 |
| Brain PC | 0.05 | 11.10 | 11.13 | 11.17 |
| Fat PC | 0.05 | 25.73 | 26.36 | 24.7 |
| Liver PC | 0.09 | 6.94 | 6.96 | 7 |
| Skin PC | 0.28 | 5.26 | 5.28 | 4.14 |
| Kidney PC | 0.13 | 4.21 | 4.22 | 4.24 |
| Mammary PC | 0.05 | 4.26 | 4.27 | 4.28 |
| Uterus/Placenta PC | 0.14 | 4.22 | 4.23 | 4.24 |
| Slowly Perfused PC | 0.12 | 5.26 | 5.28 | 5.3 |
| Rapidly Perfused PC | 0.2 | 4.26 | 4.27 | 4.28 |
Model simulations for exposure and blood levels were compared with available literature data for PFOS. Blood levels of PFOS in 11 plasma samples of mothers and their corresponding cord plasma samples were determined for a group of women and their offsprings (Midasch et al., 2007). These observed blood levels fell well within the bounds of several other studies for PFOS (Loccisano et al., 2013). The PBPK model was used to back-calculate a lifetime exposure level of 23.02 ng/kg/d that would result in the observed near-birth blood levels of PFOS. This model-calculated PFOS exposure rate was within the range of 3–220 ng/kg/d exposure levels reported for the chemical as shown in Figure 12 (Trudel et al., 2008). Consequently, given model-simulated exposure level of 23.02 ng/kg/d, blood levels of PFOS in placenta (simulating cord blood levels) were predicted and compared with the observed data (Midasch et al., 2007). Figure 13 showed that the model-estimated cord-blood levels when maternal lifetime exposure is set to 23.02 ng/kg/d agreed with measured cord blood levels. The life-stage PBPK model calibration (estimating a lifetime exposure level) and evaluation (simulating cord-blood levels) in comparison to published data provided confidence in the predictive ability of the life-stage PBPK model.
FIG. 12.
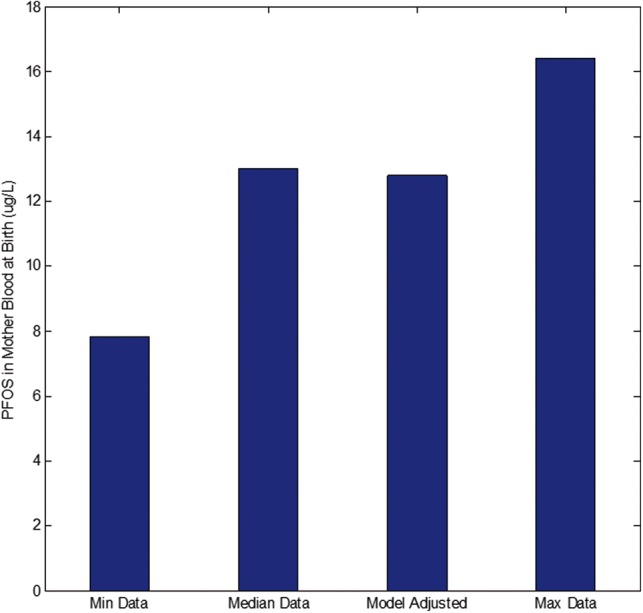
Life-time PFOS exposure (mg/kg/d) was estimated by calibrating the Life-Stage model using blood levels data for near-birth mothers.
FIG. 13.
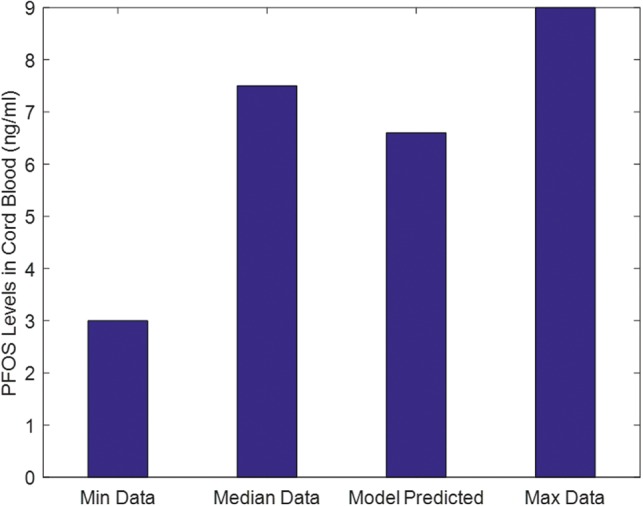
Using the estimated life-time exposure, the Life-Stage model was used to predict cord blood levels in comparison to PFOS data.
For each chemical, HTS assay data that were associated with the putative fetal vasculogenesis/angiogenesis disruption AOP were compared with identify the lowest in vitro AC50 level. For PFOS, this LAC was determined to be 7.67 µM for the hepatic PTEN gene assay (Kleinstreuer et al., 2013, 2014; Tal et al., 2014). The assay measures enzyme activity related to the PTEN gene which is associated with increased cell proliferation and reduced cell death. The life-stage PBPK model for PFOS was then used to estimate an exposure of 2420 ng/kg/d necessary to yield maximal fetal blood levels equivalent to the determined LAC during gestation. This AOP-based exposure level was then divided by the previously model-determined environmental lifetime exposure level (23.02 ng/kg/d) to yield a value for the AOP-Based MOE equal to 105 (2420/23.02).
Estimation of the Developmental Vascular Disruption/Angiogenesis AOP-Based MOE to Pyridaben, Triclosan, and Fluazinam
Chemical-specific parameters used in the life-stage PBPK model for simulating internal dosimetry of Pyridaben, Triclosan and Fluazinam are listed in Table 2. Fetal vasculogenesis/angiogenesis disruption AOP HTS assays were examined, and LACs were determined to be NF-κB expression (a protein complex that controls transcription, cytokine production, and cell survival) for Pyridaben, and vascular cell proliferation for Triclosan and Fluazinam. The estimated LACs for these assays were 0.09, 3.88, and 0.264 µM for Pyridaben, Triclosan, and Fluazinam; respectively (Kleinstreuer et al., 2013, 2014; Tal et al., 2014).
Maternal lifetime exposure levels yielding maximal fetal blood levels equal to the selected LACs during pregnancy were determined using the life-stage and fetal PBPK models as 0.09, 120, and 0.34 mg/kg/d for Pyridaben, Triclosan and Fluazinam; respectively. In the absence of literature data, estimated lifetime environmental exposure levels were determined using simulations by the SHEDS-HT model. Using the median environmental exposure levels (50% percentile) for each chemical, AOP-Based MOEs were estimated as 5882 (0.09/1.53e-9), 5714 (120/0.021), and 1.6 × 10⁸ (0.36/2.232e-9) for Pyridaben, Triclosan and Fluazinam; respectively.
DISCUSSION
Utilizing HTS in vitro data to investigate toxicological pathways that may be activated in response to chemical exposure is a core activity for the Tox21 initiative. The assays selected for HTS can be related to biological events that are organized into biological pathways leading to an AO as described in AOPs. Once AOPs are inferred from HTS data, they can be used to screen chemicals based on their possible interactions with MIEs (Ankley et al., 2010). However, the simple interaction of a chemical with an MIE does not necessarily lead to AOs. The parent chemical should reach the target tissue where the MIE interaction will take place at the right time, and dose, especially when developmental toxicity is of concern.
Developing fetuses and infants are especially sensitive to toxicity caused by exposure to xenobiotics. The time and dose to which a developing target tissue is exposed during pregnancy or via lactation after birth are critical factors in developmental toxicology. This time-tissue dose relationship to toxicity can only be determined using resource-exhaustive experimentations which are ethically prohibited. In lieu of experiments, a life-stage PBPK model is helpful because temporal and target tissue dose can be predicted and associated with critical stages during fetal development (Figure 14). However, application of the PBPK models to a large set of chemicals related to a developmental AOP necessitates quantitative approaches for obtaining physiological and biochemical parameters. In this study, physiological parameters for various life-stages were obtained from or calibrated using literature data, and are applicable to any chemical. Biochemical parameters such as partition coefficients can be calculated using chemical–physical properties and tissue composition. Free fraction of chemicals (a parameter needed for calculating chemical renal excretion) also can be experimentally measured or obtained using published SAR models or commercial software. For the purposes of investigating life-time maternal exposures and its impact on near birth tissue levels in pregnant women, the only parameters that are chemical specific in the model described herein, and need to be obtained from HTS in vitro data, are related to maternal metabolism, transport kinetics and AOP-related responses.
FIG. 14.
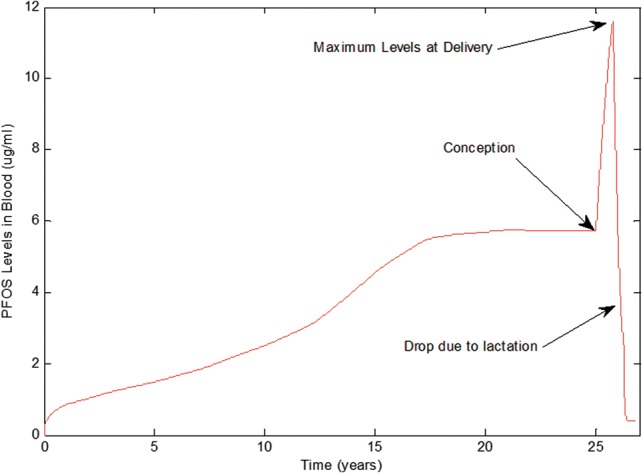
The Life-Stage model prediction of maternal blood levels for PFOS during child growth, pregnancy and through lactation.
Several factors impact chemical levels in fetal blood during gestational exposures. Quantitatively higher levels of maternal exposure (via food intake) and higher renal clearance rates during pregnancy will impact steady-state levels of chemicals in maternal and fetal blood. Although, the life-stage model was purposefully developed to investigate the impact of maternal chemical clearance on fetal tissue levels, whenever quantitative fetal data on enzyme and/or transporter ontogeny data are available, these chemical-specific parameters could be incorporated into the model to refine model outputs (Hines, 2008). Placental transport kinetics and fetal metabolic capacity for the chemicals, if present, add further complexities to the delivery and disposition of chemicals in fetal tissues during gestation. Although there are exceptions for a few enzyme systems, fetal metabolism, if present, is usually in the range of negligible to low in comparison to adult levels (Hines, 2012; Tayman et al., 2011). Transport kinetics for chemicals, specifically across placenta, can be obtained from targeted in vitro assays. These kinetic parameters can be included in the PBPK model whenever they are available. In this effort, chemical transport through placenta was approximated using partitioning between maternal blood and placenta tissue. This approximation is based on tissue solubility of the chemical and is diffusion related, which is a reasonable assumption given that transport kinetic Hill equation approaches a linear diffusion-like transport mechanism quantitatively for low near-environmental exposures levels. More elaborate placental transport kinetics descriptions are needed when chemicals are at high enough saturable levels, cannot cross membranes by simple diffusion, or are inhibited from transport by other chemicals or endogenous chemicals. In these cases, the addition of transporter kinetics in the model will influence the rate but not the amount (integrated over time) of chemical diffusion from placenta to fetal tissue. Therefore, when considering all the assumptions made herein, the estimated levels of parent chemicals in fetal blood using the life-stage PBPK model produced conservative MOE estimates when compared with relevant HTS assay LACs.
Combining knowledge about biological mechanisms (AOPs and in vitro HTS assays), IVIVE toxicokinetics (PBPK models) and exposure estimates (SHEDS-HT Models) enabled the calculations of the AOP-Based MOEs for several chemicals using the following formula:
The intent for estimating AOP-based MOE is to prioritize interest for research and regulation across chemicals, and would not to be appropriate for regulatory decision making. For the set of chemicals used in this paper, the priority for further research and assessment would be PFOS, followed by Triclosan, Pyridaben and Fluazinam when considering the potential for disrupting fetal vascular development. In contrast to the AOP-based MOE, estimated MOEs used in regulatory decision making are usually calculated as the dose at which a point of departure (POD) in the dose–response relationship using toxicological studies in animals (eg, NOAEL) is divided by the dose (exposure level) to which humans are exposed (estimated dietary intake). Hence, regulatory MOEs are calculated using the following formula:
Human health regulatory MOEs are usually compared with uncertainty factors typically used to account for human relevancy of the toxic endpoint and data availability and adequacy for inter- and intra-species extrapolations, and sensitive subpopulations (eg, children, pregnant women). A listing of available MOE estimates from literature for the chemicals used in this study is given in supplementary Table 1. A large MOE range exists for each chemical based on the choice of toxic endpoint, exposure level, and uncertainty factors used in determining the human equivalent POD. With the exception of Fluazinam, all of the developmental AOP-based MOE estimates in the current study are close or within the same range as these previously reported MOE. In general, for a given human exposure level, an AOP-based MOE would be more conservative than a regulatory MOE because the in vivo estimate of the human dose where biological activity is considered is based on the selection of the ‘most’ sensitive in vitro endpoint, while in many cases a POD can be identified in an animal study based on an observed toxic endpoint, which may already be indicative of an in vivo AO.
Supplementary Material
APPENDIX
The presence of the blood shunts in fetal heart, venous and arterial blood ducts, necessitated the separate mass balance description of venous and arterial blood compartments.
Fetal venous blood receives blood tissue, the ductus venosus (bypassing the liver), and loses blood to lung tissue via right heat ventricular, directly to the arterial blood flow through the foramen ovale (FO) in the heart, and to arterial blood directly via ductus arteriosus (Qda). Therefore, the mass balance equation for venous blood is:
Where Mven (mg) is the amount of chemical in venous blood, Cpla, Cli, Cfat, Ckid, Cb (mg/l)are the chemical concentrations in placenta, liver, fat, kidney, and rest of body, respectively.
Arterial blood receives blood flows from venous blood directly via the ductus arteriosus (Qda), Forma ovale in the heart (Qfa), and from the lung directly; it loses blood to tissues including placenta (Quv). The arterial blood flow mass balance equation for the fetus was described as follows:
Where Mart and Cart are the amount (mg) and concentration (mg/l) of the chemical in arterial blood.
Lung receives blood portion that did not pass through the ductus arteriosus directly to arterial ductual flow, leading the following mass balance equation for fetal lung
where Mlung is the amount of chemical (mg) in lung. The mass balance for placenta includes delivery of umbilical arterial blood flow with chemical concentration (Cart). Blood flow existing the placenta is divided into a portion that is shunted to the venous blood compartment (Quv-Qdv) via the ductus venous, and a portion that is transferred to the liver via Qdv. Therefore, the equation describing this mass balance is as described below:
where Mpla is the amount of chemical (mg) in placenta.
The other fetal tissues are described as:
where Mi is the amount (mg) of chemical in tissue (i), Qif is fetal tissue blood flow (l/h), Cart is the arterial blood concentration (mg/l), Civf is fetal tissue concentration in venous blood (mg/l), Vif is the tissue volume (l) and PC is chemical partition coefficient (tissue/blood).
REFERENCES
- Alcorn J., McNamara P. J. (2003). Pharmacokinetics in the newborn. Adv. Drug Deliv. Rev. 55, 667–686. [DOI] [PubMed] [Google Scholar]
- Ankley G. T., Bennett R. S., Erickson R. J., Hoff D. J., Hornung M. W., Johnson R. D., Mount D. R., Nichols J. W., Russom C. L., Schmieder P. K., et al. (2010). Adverse outcome pathways: A conceptual framework to support ecotoxicology research and risk assessment. Environ. Toxicol. Chem. 29, 730–741. [DOI] [PubMed] [Google Scholar]
- Agency for Toxic Substances and Disease Registry (ATSDR). (2015). Draft toxicological profile for perfluoroalkyls In U.S. Department of Health and Human Services. Public Health Services, Atlanta, GA. [Google Scholar]
- Barter Z. E., Bayliss M. K., Beaune P. H., Boobis A. R., Carlile D. J., Edwards R. J., Houston J. B., Lake B. G., Lipscomb J. C., Pelkonen O. R., et al. (2007). Scaling factors for the extrapolation of in vivo metabolic drug clearance from in vitro data: reaching a consensus on values of human microsomal protein and hepatocellularity per gram of liver. Curr. Drug Metab. 8, 33–45. [DOI] [PubMed] [Google Scholar]
- Baschat A. A. (2006). The fetal circulation and essential organs-a new twist to an old tale. Ultrasound Obstet. Gynecol. 27, 349–354. [DOI] [PubMed] [Google Scholar]
- Brown R. P., Delp M. D., Lindstedt S. L., Rhomberg L. R., Beliles R. P. (1997). Physiological parameter values for physiologically based pharmacokinetic models. Toxicol. Ind. Health 13, 407–484. [DOI] [PubMed] [Google Scholar]
- Clewell R. A., Merrill E. A., Gearhart J. M., Robinson P. J., Sterner T. R., Mattie D. R., Clewell H. J., 3rd (2007). Perchlorate and radioiodide kinetics across life stages in the human: using PBPK models to predict dosimetry and thyroid inhibition and sensitive subpopulations based on developmental stage. J. Toxicol. Environ. Health A 70, 408–428. [DOI] [PubMed] [Google Scholar]
- Coulthard M. G. (1994). Surface area is best estimated from weight alone: pocket calculators and nomograms are unnecessary. Arch. Dis. Child 71, 281.. [DOI] [PMC free article] [PubMed] [Google Scholar]
- Dawes G. S. (1968). Foetal blood-gas homeostasis during development. Proc. R .Soc. Med. 61, 1227–1231. [PMC free article] [PubMed] [Google Scholar]
- Dix D. J., Houck K. A., Martin M. T., Richard A. M., Setzer R. W., Kavlock R. J. (2007). The ToxCast program for prioritizing toxicity testing of environmental chemicals. Toxicological sciences : an official journal of the Society of Toxicology. 95(1), 5–12. [DOI] [PubMed] [Google Scholar]
- Gentry P. R., Covington T. R., Clewell H. J., 3rd (2003). Evaluation of the potential impact of pharmacokinetic differences on tissue dosimetry in offspring during pregnancy and lactation. Regul. Toxicol. Pharmacol. 38, 1–16. [DOI] [PubMed] [Google Scholar]
- Goldsmith M. R., Grulke C. M., Brooks R. D., Transue T. R., Tan Y. M., Frame A., Egeghy P. P., Edwards R., Chang D. T., Tornero-Velez R., et al. (2014). Development of a consumer product ingredient database for chemical exposure screening and prioritization. Food Chem. Toxicol. 65, 269–279. [DOI] [PubMed] [Google Scholar]
- Haugen G., Kiserud T., Godfrey K., Crozier S., Hanson M. (2004). Portal and umbilical venous blood supply to the liver in the human fetus near term. Ultrasound Obstet. Gynecol. 24, 599–605. [DOI] [PubMed] [Google Scholar]
- Hines R. N. (2008). The ontogeny of drug metabolism enzymes and implications for adverse drug events. Pharmacol. Ther. 118, 250–267. [DOI] [PubMed] [Google Scholar]
- Hines R. N. (2012). Age-Dependent Expression of Human Drug-Metabolizing Enzymes In Encyclopedia of Drug Metabolism and Interactions (Lyubimov A. V., Ed.), pp. 1–24. John Wiley & Sons, Inc, Philadelphia. [Google Scholar]
- Hines R. N. (2013). Developmental expression of drug metabolizing enzymes: Impact on disposition in neonates and young children. Int. J. Pharm. 452, 3–7. [DOI] [PubMed] [Google Scholar]
- Isaacs K. K., Glen W. G., Egeghy P., Goldsmith M. R., Smith L., Vallero D., Brooks R., Grulke C. M., Ozkaynak H. (2014). SHEDS-HT: an integrated probabilistic exposure model for prioritizing exposures to chemicals with near-field and dietary sources. Environ. Sci. Technol. 48, 12750–12759. [DOI] [PubMed] [Google Scholar]
- Jegier W., Sekelj P., Auld P. A., Simpson R., McGregor M. (1963). The relation between cardiac output and body size. Br. Heart J. 25, 425–430. [DOI] [PMC free article] [PubMed] [Google Scholar]
- Judson R. S., Kavlock R. J., Setzer R. W., Hubal E. A. C., Martin M. T., Knudsen T. B., Houck K. A., Thomas R. S., Wetmore B. A., Dix D. J. (2011). Estimating toxicity-related biological pathway altering doses for high-throughput chemical risk assessment. Chem. Res. Toxicol. 24, 451–462. [DOI] [PubMed] [Google Scholar]
- Kavlock R., Chandler K., Houck K., Hunter S., Judson R., Kleinstreuer N., Knudsen T., Martin M., Padilla S., Reif D., et al. (2012). Update on EPA’s ToxCast program: providing high throughput decision support tools for chemical risk management. Chem. Res. Toxicol. 25, 1287–1302. [DOI] [PubMed] [Google Scholar]
- Kessler J., Rasmussen S., Godfrey K., Hanson M., Kiserud T. (2011). Venous liver blood flow and regulation of human fetal growth: evidence from macrosomic fetuses. Am. J. Obstet. Gynecol. 204, 429.e1–427. [DOI] [PubMed] [Google Scholar]
- Kessler J., Rasmussen S., Hanson M., Kiserud T. (2006). Longitudinal reference ranges for ductus venosus flow velocities and waveform indices. Ultrasound Obstet. Gynecol. 28, 890–898. [DOI] [PubMed] [Google Scholar]
- Kiserud T., Rasmussen S., Skulstad S. (2000). Blood flow and the degree of shunting through the ductus venosus in the human fetus. Am. J. Obstet. Gynecol. 182, 147–153. [DOI] [PubMed] [Google Scholar]
- Kleinstreuer N., Dix D., Rountree M., Baker N., Sipes N., Reif D., Spencer R., Knudsen T. (2013). A computational model predicting disruption of blood vessel development. PLoS Comput. Biol. 9, e1002996.. [DOI] [PMC free article] [PubMed] [Google Scholar]
- Kleinstreuer N. C., Yang J., Berg E. L., Knudsen T. B., Richard A. M., Martin M. T., Reif D. M., Judson R. S., Polokoff M., Dix D. J., et al. (2014). Phenotypic screening of the ToxCast chemical library to classify toxic and therapeutic mechanisms. Nat. Biotechnol. 32, 583–591. [DOI] [PubMed] [Google Scholar]
- Knudsen T. B., Kleinstreuer N. C. (2011). Disruption of embryonic vascular development in predictive toxicology. Birth Defects Res C Embryo Today. 93(4), 312–323. [DOI] [PubMed] [Google Scholar]
- Loccisano A. E., Longnecker M. P., Campbell J. L., Jr., Andersen M. E., Clewell H. J., 3rd (2013). Development of PBPK models for PFOA and PFOS for human pregnancy and lactation life stages. J. Toxicol. Environ. Health A 76, 25–57. [DOI] [PMC free article] [PubMed] [Google Scholar]
- Luecke R. H., Wosilait W. D., Young J. F. (1995). Mathematical representation of organ growth in the human embryo/fetus. Int. J. Biomed. Comput. 39, 337–347. [DOI] [PubMed] [Google Scholar]
- Martin S. A., McLanahan E. D., Bushnell P. J., Hunter E. S., 3rd, El-Masri H. (2015). Species extrapolation of life-stage physiologically-based pharmacokinetic (PBPK) models to investigate the developmental toxicology of ethanol using in vitro to in vivo (IVIVE) methods. Toxicol. Sci. 143, 512–535. [DOI] [PubMed] [Google Scholar]
- Midasch O., Drexler H., Hart N., Beckmann M. W., Angerer J. (2007). Transplacental exposure of neonates to perfluorooctanesulfonate and perfluorooctanoate: a pilot study. Int. Arch. Occup. Environ. Health 80, 643–648. [DOI] [PubMed] [Google Scholar]
- Mielke G., Benda N. (2001). Cardiac output and central distribution of blood flow in the human fetus. Circulation 103, 1662–1668. [DOI] [PubMed] [Google Scholar]
- Poirier A., Cascais A. C., Funk C., Lave T. (2009a). Prediction of pharmacokinetic profile of valsartan in human based on in vitro uptake transport data. J. Pharmacokinet. Pharmacodyn. 36, 585–611. [DOI] [PubMed] [Google Scholar]
- Poirier A., Funk C., Scherrmann J. M., Lave T. (2009b). Mechanistic modeling of hepatic transport from cells to whole body: Application to napsagatran and fexofenadine. Mol. Pharm. 6, 1716–1733. [DOI] [PubMed] [Google Scholar]
- Rotroff D. M., Wetmore B. A., Dix D. J., Ferguson S. S., Clewell H. J., Houck K. A., Lecluyse E. L., Andersen M. E., Judson R. S., Smith C. M., et al. (2010). Incorporating human dosimetry and exposure into high-throughput in vitro toxicity screening. Toxicol. Sci. 117, 348–358. [DOI] [PMC free article] [PubMed] [Google Scholar]
- Rudolph A. M. (1985). Distribution and regulation of blood flow in the fetal and neonatal lamb. Circ. Res. 57, 811–821. [DOI] [PubMed] [Google Scholar]
- Smith G. C. S., Cameron A. D. (2002). Estimating human fetal blood volume on the basis of gestational age and fetal abdominal circumference. Bjog. 109(6), 721–722. [DOI] [PubMed] [Google Scholar]
- Strikwold M., Spenkelink B., Woutersen R. A., Rietjens I. M. C. M., Punt A. (2013). Combining in vitro embryotoxicity data with physiologically based kinetic (PBK) modelling to define in vivo dose-response curves for developmental toxicity of phenol in rat and human. Arch. Toxicol. 87, 1709–1723. [DOI] [PubMed] [Google Scholar]
- Tal T. L., McCollum C. W., Harris P. S., Olin J., Kleinstreuer N., Wood C. E., Hans C., Shah S., Merchant F. A., Bondesson M., Knudsen T. B., Padilla S., Hemmer M. J. (2014). Immediate and long-term consequences of vascular toxicity during zebrafish development. Reprod Toxicol. 48, 51–61. [DOI] [PubMed] [Google Scholar]
- Tayman C., Rayyan M., Allegaert K. (2011). Neonatal pharmacology: Extensive interindividual variability despite limited size. J. Pediatr. Pharmacol. Ther. 16, 170–184. [DOI] [PMC free article] [PubMed] [Google Scholar]
- Trudel D., Horowitz L., Wormuth M., Scheringer M., Cousins I. T., Hungerbuhler K. (2008). Estimating consumer exposure to PFOS and PFOA. Risk analysis : an official publication of the Society for Risk Analysis. 28(2), 251–269. [DOI] [PubMed] [Google Scholar]
- Valentin J. (2003). Basic anatomical and physiological data for use in radiological protection: reference values Published for the International Commission for Radiological Protection (ICRP). Elsevier Science Ltd, Oxford. [Google Scholar]
- Veille J. C., Hanson R. A., Tatum K., Kelley K. (1993). Quantitative assessment of human fetal renal blood flow. Am. J. Obstet. Gynecol. 169, 1399–1402. [DOI] [PubMed] [Google Scholar]
- Wang L. Q., Falany C. N., James M. O. (2004). Triclosan as a substrate and inhibitor of 3'-phosphoadenosine 5'-phosphosulfate-sulfotransferase and UDP-glucuronosyl transferase in human liver fractions. Drug Metab. Dispos. 32, 1162–1169. [DOI] [PubMed] [Google Scholar]
- Wetmore B. A., Allen B., Clewell H. J., 3rd, Parker T., Wambaugh J. F., Almond L. M., Sochaski M. A., Thomas R. S. (2014). Incorporating population variability and susceptible subpopulations into dosimetry for high-throughput toxicity testing. Toxicol. Sci. 142, 210–224. [DOI] [PubMed] [Google Scholar]
- Wetmore B. A., Wambaugh J. F., Ferguson S. S., Sochaski M. A., Rotroff D. M., Freeman K., Clewell H. J., 3rd, Dix D. J., Andersen M. E., Houck K. A., et al. (2012). Integration of dosimetry, exposure, and high-throughput screening data in chemical toxicity assessment. Toxicol.. Sci. 125, 157–174. [DOI] [PubMed] [Google Scholar]
- Zaya M. J., Hines R. N., Stevens J. C. (2006). Epirubicin glucuronidation and UGT2B7 developmental expression. Drug Metab. Dispos. 34, 2097–2101. [DOI] [PubMed] [Google Scholar]
Associated Data
This section collects any data citations, data availability statements, or supplementary materials included in this article.


