

Abstract
Identification of circulating microRNAs for the diagnosis of liver injury and as an indicator of underlying pathology has been the subject of recent investigations. While several studies have been conducted, with particular emphasis on miR-122, the timing of miRNA release into the circulation and anchoring to tissue pathology has not been systematically evaluated. In this study, miRNA profiling was conducted over a time course of hepatobiliary injury and repair using alpha-naphthylisothiocyanate (ANIT) and a proprietary compound, FP004BA. ANIT administration (50 mg/kg) to rats caused significant biliary epithelial cell and hepatocellular necrosis between 24 and 72 h, followed by resolution and progression to biliary hyperplasia by 120 h which was associated with miRNA release into the blood. FP004BA (100 mg/kg) was used to confirm associations of miRNA along a time course with similar hepatic pathology to ANIT. Treatment with ANIT or FP004BA resulted in significant alterations of overlapping miRNAs during the early and peak injury phases. In addition to well-characterized liver injury markers miR-122‐5p and miR-192‐5p, multiple members of the 200 family and the 101 family along with miR-802‐5p and miR-30d‐5p were consistently elevated during hepatobiliary injury caused by both toxicants, suggesting that these species may be potential biomarker candidates for hepatobiliary injury. After 14 days of dosing with 4BA, miR-182‐5p remained elevated—while miR-122‐5p and miR-192‐5p had returned to baseline—suggesting that miR-182‐5p may have added utility to monitor for hepatobiliary injury in the repair phases when there remains histological evidence of ongoing cellular injury.
Keywords: drug-induced liver injury, biomarkers, miRNA, hepatobiliary injury, biliary hyperplasia
Drug-induced liver injury (DILI) accounts for a disproportionately large number of drugs being withdrawn from the market post-approval (Stevens and Baker, 2009). Traditional laboratory tests are currently the gold standard for detection of DILI reactions. Hepatocellular injury is characterized by elevations in the blood of alanine aminotransferase (ALT) and aspartate aminotransferase (AST), while cholestasis is typically diagnosed via elevations in alkaline phosphatase (ALP) and γ-glutamyl transpeptidase (GGT). Functional impairment of the liver is monitored by measuring total bilirubin (TBil). However, DILI encompasses a wide variety of underlying pathologies that extend beyond hepatocellular injury and some of these manifestations cannot currently be monitored via standard clinical chemistry analyses.
Many of the biomarker efforts to date have focused on protein biomarkers; however, protein biomarkers have variable stability in biofluids and detection assays are not well standardized for many of those proposed. In addition, protein biomarkers are less conserved between species due to protein coding sequence differences, which in some cases leads to the need for different assays for different species. MicroRNAs (miRNAs) are small, non-coding RNA species that selectively bind to and alter messenger RNA (mRNA) expression (Bartel, 2004). The characteristics make miRNAs uniquely attractive as translational biomarkers because of high inter-species sequence conservation and improved stability in biofluids as compared with protein biomarkers (Weber et al., 2010). Assay sensitivity is enhanced with nucleic acid-based biomarkers as compared with proteins owing to advancements in amplification techniques that enable detection of very low quantities of miRNAs.
Discovery of miRNAs as biomarkers for drug-induced organ damage is gaining attention, especially where diagnostic specificity to cell type is desirable. Such investigations are typified by recent miRNA biomarker discoveries for renal injury in rat models, particularly where the miRNAs released into urine are associated with preferential damage to glomerular cells (Church et al., 2014; Pavkovic et al., 2015) or to tubular cells (Kanki et al., 2014; Nassirpour et al., 2014; Pavkovic et al., 2014). Similarly, miRNA discovery efforts for hepatocellular injury have identified miR-122 as a liver-specific miRNA biomarker of hepatocellular damage (Filipowicz and Grosshans, 2011). Release of this species into circulation following liver injury has been shown to be more sensitive and to have a larger dynamic range than ALT measurements in both animals and humans (Starkey Lewis et al., 2011; Wang et al., 2009). In at least one published case, measurement of miR-122 would have alerted clinicians to the presence of liver injury that was missed by assessment of circulatory ALT levels (Dear et al., 2014). However, a drawback of miR-122 is that elevations in blood are transient with a shorter clearance half-life as compared with ALT. Therefore, the timing of blood sampling can affect the interpretation of the underlying hepatic pathology, particularly when ALT remains elevated at time points when miR-122 levels have already returned to baseline (Harrill et al., 2012; Starkey Lewis et al., 2011). Consequently, the utility of miR-122 as a diagnostic test for liver injury may be limited, although there remains utility for measuring this marker to confirm a hepatic origin for aminotransferase elevations.
Recent microarray profiling studies in both rodents and humans have begun to identify additional miRNAs that are released into blood following various manifestations of DILI, (Krauskopf et al., 2015; Wang et al., 2009; Ward et al., 2014; Yamaura et al., 2012). Current clinical profiling studies have mainly focused on DILI resulting from acetaminophen exposure, which primarily affects centrilobular hepatocytes (Krauskopf et al., 2015; Ward et al., 2014). A recent miRNA profiling study in rodents utilized compounds that elicited either hepatocellular and/or biliary injury; however, this investigation focused on biomarkers released during acute liver injury only (Yamaura et al., 2012). There have been no studies to date investigating temporal release of miRNAs into circulation that are associated with hepatobiliary injury and subsequent hyperplasia and resolution anchored to coordinated histopathologic lesions. Such information may provide translational biomarkers with added utility above miR-122 to diagnose and monitor liver injury and to monitor for recovery of injury, which may aid in clinical treatment scheduling during drug development.
In order to investigate the timing of miRNA release into blood during hepatobiliary injury, alpha-naphthylisothiocyanate (ANIT) was utilized as a model hepatotoxic agent. ANIT toxicity has been well characterized in rodent models, consisting of initial injury to biliary epithelial cells (BECs) and secondary development of hepatocellular injury. Cellular injury due to ANIT is followed by a repair phase that entails cellular regeneration and compensatory biliary hyperplasia (Kossor et al., 1993). Because of this temporal continuum of liver pathology, sampling blood and hepatic tissue in a time course following administration of ANIT in rats enabled profiling of miRNA changes in plasma and subsequent characterization of miRNA and mRNA changes in liver during the acute injury and repair phases. FP004BA, a proprietary compound obtained from Bayer Pharma AG, has previously been demonstrated to elicit a similar pathological profile in male rats (Ellinger-Ziegelbauer et al., 2011). FP004BA was subsequently utilized to investigate whether the miRNA changes observed following ANIT administration could be generalizable across compounds that cause similar pathological profiles of hepatobiliary injury and compensatory biliary hyperplasia.
MATERIALS AND METHODS
Experimental Animals
Male Sprague Dawley rats (∼8 weeks in age) were purchased from Charles River and housed in polycarbonate cages on a 12 h light-dark cycle. Rats were provided pelleted NIH-07 diet ad libitum, with the exception of an ∼18 h fast immediately prior to euthanasia. Reverse osmosis water was available to rodents, ad libitum. All animal use was conducted under a protocol approved by The Hamner Institutes for Health Sciences Institutional Animal Care and Use Committee.
Chemical Exposure in Rats
Following arrival at the Hamner Institutes, rats were acclimated for ∼1 week prior to the initiation of experimentation. The experimental designs for rodent studies are summarized in Supplemental Table 1. The doses and time points utilized in this study were selected, in part, based on previously published investigations (Cullen et al., 2010; Ellinger-Ziegelbauer et al., 2011).
ANIT
On the morning of dosing, all rats were weighed and received a single intragastric (i.g.) administration of either 50 mg/kg ANIT (Sigma-Aldrich, St Louis, Missouri) dissolved in corn oil (N = 6/time point) or corn oil (N = 6/time point) in a volume of 10 ml/kg. Groups of corn oil and ANIT-treated rats were euthanized 6, 24, 48, 72, 120, and 168 h post-dosing. With the exception of animals euthanized 6 h following dosing, all animals were fasted overnight, for ∼18 h, on the night preceding necropsy. All animals received an intraperitoneal (i.p.) injection of 100 mg/kg of 5′-bromo-2′-deoxyuridine (BrdU; Sigma), ∼2 h prior to scheduled necropsy.
FP004BA
FP004BA was obtained under a material transfer agreement with Bayer Pharma AG (Berlin, Germany). Beginning on the first morning of dosing, all rats were weighed and received daily i.g. administration of either 100 mg/kg (+)-(1R)-1-[4-(4-fluorophenyl)-2,6-diisopropyl-5-propyl-pyridin-3-yl]ethanol (FP004BA) suspended in a 1% carboxymethylcellulose and 0.5% Tween 80 solution (CMC-Tween; N = 6/time point) or CMC-Tween vehicle (N = 6/time point) in a volume of 10 ml/kg. Animals received a daily dose of FP004BA or CMC-Tween for 1, 3, or 14 consecutive days and were necropsied 24 h after the final dose. Compound administration occurred at ∼0900 on each morning of dosing to avoid diurnal effects. All animals were fasted overnight, for ∼18 h, on the night preceding necropsy.
Rats were euthanized by CO2 inhalation. Animals were exsanguinated via cardiac puncture for collection of blood pipetted into separate tubes for isolation of serum and plasma. Livers and kidneys were excised, immersed in 10% neutral buffered formalin, and allowed to fix for up to 48 h. Following fixation, the tissue samples were transferred to 70% ethanol until time of processing.
Liver Histopathology
Formalin fixed left and median liver lobes tissues were paraffin-embedded and cut into 5 µm sections. Hematoxylin and eosin (H&E) stained liver sections were microscopically examined by a veterinary pathologist. Microscopic findings were graded on a scale of 0–4, where 0 = none, 1 = minimal, 2 = mild, 3 = moderate, and 4 = marked changes.
BrdU Labeling and Analysis
To assess cellular proliferation, paraffin-embedded liver tissue was utilized for BrdU immunolabeling. Fixed tissue was cut into 5 µm sections, deparaffinized, and permeabilized in 2 N hydrochloric acid. A boric acid-borate buffer solution (85 ml boric acid with 15 ml sodium biborate) was utilized for antigen retrieval. Blocking was performed with normal rabbit serum (Jackson Immunoresearch Laboratories, Inc, Westgrove, Pennsylvania) and an Avidin/Biotin Blocking kit (Vector Laboratories Inc, Burlingame, California). Labeling was conducted with primary rat anti-BrdU antibody (Accurate Chemical and Scientific Corporation, Westbury, New York), secondary biotinylated rabbit anti-rat IgG antibody (Vector Laboratories Inc), R.T.U Vectastain Elite ABC Reagent (Vector Laboratories Inc) and DAB chromagen. Slides were counterstained with Harris hematoxylin. Following dehydration, a representative photomicrograph of a bile duct and surrounding hepatocytes was taken from the left liver lobe of each animal at 200× magnification. ImageJ version 1.4 (Schneider et al., 2012) was utilized to count the total number of cells within the image. This number exceeded 1000 cells in all images. The number of BrdU positive cells was determined manually and the percentage of cells (hepatocytes and BECs) positive for BrdU was calculated. Significance was determined utilizing 2-way analysis of variance (ANOVA, for time and treatment) followed by a Bonferroni multiple test correction to assess differences in group means. BrdU staining in ANIT-treated rats was considered significant, compared with concurrent Vehicle-treated rats, if P < .05.
Serum Biomarker Assessment
Blood collected in 3.5 ml SST vacutainer tubes was allowed to coagulate for ∼60 min and then centrifuged at room temperature (RT) at 1500 rpm for 15 min. The resulting serum was utilized for analysis of liver clinical chemistry biomarkers via standard clinical chemistry. Measurements of ALT, AST, ALP, GGT, and TBil were made utilizing reagents purchased from Carolina Liquid Chemistries (Winston-Salem, North Carolina) on an Olympus AU600 (Olympus America, Center Valley, Pennsylvania) clinical chemistry analyzer. Total bile acids were measured at a contract research organization (Antech, Raleigh, North Carolina). When a value fell below a quantifiable concentration limit, the lower limit of quantification was utilized as the presumed value. Significance was calculated for all serum biomarkers at each time point utilizing 1-way ANOVA followed by 5% Benjamini-Hochberg false discovery rate (FDR) correction for multiple test correction. Changes in biomarker values were considered significantly altered in ANIT-treated rats, compared with concurrent vehicle-treated rats, if P < .05.
RNA Isolation and Profiling From Plasma
Blood collected in 4 ml EDTA-containing vacutainer tubes was centrifuged at 4°C at 1500 rpm for 15 min. Total RNA was extracted from 200 µl plasma using the mirRNeasy serum/plasma kit (Qiagen, Valencia, California) in accordance with the manufacturer’s protocol. A synthetic miRNA (30 pg) with sequence matching Arabidopsis thalania miR-159a (UUUGGAUUGAAGGGAGCUCUA; Integrated DNA Technologies, Coralville, Iowa), was added to each sample during the extraction procedure to normalize for RNA isolation following miRNA measurements. This spike-in was added to samples following 5-min incubation with QIAzol Lysis Reagent (Qiagen). RNA samples were stored at −80°C until use.
Following isolation, 3 µl of total RNA was reverse transcribed and preamplified utilizing Taqman reagents according to the manufacturer’s recommendations (Life Technologies, Foster City, California). MicroRNA concentrations were determined via quantitative real-time polymerase chain reaction (qRT-PCR) using TaqMan Rodent miRNA Sets A and B v. 3.0 Arrays (Life Technologies) following the manufacturer’s specifications. Quantitative PCR of these arrays was performed using an Applied Biosystems 7900HT Real-Time PCR System (Life Technologies).
RNA Isolation and Profiling in Liver Tissue
Between 100 and 500 mg of liver tissue was utilized for isolation of total RNA with the miRVana miRNA Isolation kit (Life Technologies) in accordance with the manufacturer’s specifications. Following isolation, RNA concentration was quantified utilizing a NanoDrop spectrophotometer (NanoDrop Technologies, Wilmington, Delaware). RNA samples were stored at −80°C until use.
Following isolation, 1 µg of total hepatic RNA was reverse transcribed utilizing Taqman reagents according to the manufacturer’s recommendations (Life Technologies). MicroRNA profiling was conducted by qRT-PCR using TaqMan Rodent miRNA Set A and B v. 3.0 Arrays (Life Technologies) following the manufacturer’s specifications. Analysis was performed using an Applied Biosystems ViiA 7 Real-Time PCR System (Life Technologies).
miRNA Profiling Data Analysis in Plasma and Liver
Sample cycle threshold (Ct) values for each miRNA probe were determined using the Applied Biosystems Expression Suite Software v1.0.1 (Life Technologies). A Ct cutoff of 32 was utilized and all Ct values >32 were set to 32. All miRNA species for which >50% of animals in the treated and control groups (across all time points) had a Ct of 32 or missing data were removed from the dataset.
For analysis of miRNA alterations in plasma, the Ct values generated by the spike in control, miR-159a, grouped by plate set (A or B), were utilized to normalize Ct values for RNA isolation efficiency, as previously described (Kroh et al., 2010). Normalized Ct values were imported into Partek Genomics Suite (Partek, Inc, St. Louis, Missouri) and were subjected to 2-way ANOVA and 5% Benjamini-Hochberg FDR correction to determine significantly altered miRNAs. Significance was considered P < .05 following multiple test correction. Fold changes for significantly altered miRNAs were determined by calculating 2−ΔCt where ΔCt was represented by calculating the difference between the average compound-treated normalized miRNA Ct value and the average vehicle-treated normalized miRNA Ct value.
For analysis of miRNA alterations in liver tissue, data were normalized to 2 invariant RNA probes selected on each plate based on the consideration of a minimal % coefficient of variance across all samples analyzed along with relatively high expression in liver tissue. The mean of the Cts of both probes was utilized to normalize all miRNAs on each plate. All plate A miRNA species were normalized to miR-194‐5p (%CV, mean: 0.8%, 25.3) and miR-24‐3p (%CV, mean: 0.8%, 23.1) and all plate B miRNA species were normalized to U87 (%CV, mean: 1.07%, 23.5) and miR-30e‐3p (%CV, mean: 0.85%, 26.0). Normalized Ct values were imported into Partek Genomics Suite and were subjected to 2-way ANOVA analysis and 5% Benjamini-Hochberg FDR correction to determine significantly altered miRNAs. Significance was considered P < .05 following multiple test correction. Fold changes for significantly altered miRNAs were determined by calculating 2−ΔCt where ΔCt represented (average compound-treated normalized miRNA Ct value − average vehicle-treated normalized miRNA Ct value).
mRNA Expression and Pathway Analysis in Liver Tissue
Total hepatic RNA was utilized for microarray analysis of gene expression. The following procedures were performed in accordance with the manufacturer’s protocol. Single-stranded cDNA was reverse transcribed utilizing 50 ng of RNA on the Ovation RNA Amplification System v2 (NuGEN, San Carlos, California). Following reverse transcription, 1.875 μg of cDNA was normalized to 150 ng/μl, then fragmented to <200 bp products labeled with biotin using the Encore Biotin Module (NuGEN). The fragmented and labeled product was prepared for hybridization using the GeneChip Hybridization Control kit and then hybridized to an HT RG-230 PM Array Plate for 17 h at 45°C (Affymetrix, Santa Clara, California). The array was washed, stained with streptavidin R-phyoerythrin conjugate (Life Technologies), and scanned using a GeneTitan Multi-Channel Instrument (Affymetrix). The array data are available for download at the NCBI’s Gene Expression Omnibus (GEO series accession GSE72387: http://www.ncbi.nlm.nih.gov/geo/query/acc.cgi?acc=GSE72387).
Array data were analyzed using Partek Genomics Suite. Significantly altered mRNA probes were identified utilizing a 2-way ANOVA analysis followed by 5% Benjamini-Hochberg FDR correction. Significance was considered P < .05 following multiple test correction. Pathway enrichment and genes altered by specific miRNA species were determined utilizing Ingenuity Pathway Analysis software (Ingenuity Systems: Application build 329271M; Content version 21901358).
Determination of Significantly Associated miRNA-mRNA Targets in Liver Tissue
MiRNA and mRNA species that were significantly altered in liver tissue at 24 and 120 h (identified as described above) were analyzed to determine significantly enriched miRNA-mRNA targets. Data were analyzed using the miRNA Target Filter in Partek Genomics Suite, using the TargetScan database (version 6.3). Significance was assessed as P < .05.
RESULTS
Histopathological and Traditional Hepatobiliary Injury Marker Changes Following a Single Administration of ANIT
A time course study was conducted in male Sprague-Dawley rats to identify time-dependent alterations in histopathology, immunohistochemistry, protein biomarkers, and miRNAs following a single ANIT exposure (50 mg/kg). No compound-related hepatic injury was observed in vehicle-treated animals at any time point. Degeneration of BECs and a low incidence/severity of hepatocellular necrosis were noted as early as 6 h post-dose (Table 1 and Supplementary Figure 1), followed by biliary/hepatocellular necrosis at 24–72 h; incidence as well as severity of necrosis of BECs and hepatocytes were greatest at 24 and 48 h, and were resolved at 120 and 168 h. Concurrent with microscopic injury observed at 6 h post-dose, serum TBil levels were significantly elevated (1.3-fold as compared with vehicle controls(x); Figure 1A) and total bile acids were significantly reduced (−2.1 ×; Figure 1B). TBil levels remained significantly elevated, with a biphasic pattern, throughout the remainder of the study (2.3×, 7.7×, 2.8×, 2.9×, and 1.6× at 24, 48, 72, 120, and 168 h, respectively). Total bile acids were significantly elevated at 24 and 48 h (42× and 16×, respectively) before returning to baseline levels by 72 h. Histopathological alterations observed at 24, 48, and 72 h were associated with increases in GGT (6.8×, 4.9×, and 4.6×, respectively; Figure 1C), ALP (1.3×, 2.5×, and 2.3×, respectively; Figure 1D), ALT (4.9×, 26.6×, and 12.2×, respectively; Figure 1E), and AST (4.6×, 18×, and 6.6×, respectively; Figure 1F). With the exception of TBil, these biomarkers had returned to baseline by 120 and/or 168 h. BEC hyperplasia was observed in ANIT-treated rats as early as at 48 h post-dose and persisted, with an increase in severity, up to 168 h.
TABLE 1.
Hepatic Histopathology in Rats Following a Single Oral ANIT Administration (50 mg/kg)
| Experimental Group (h) | BEC Degeneration | BEC Necrosis | Hepatocellular Necrosis | Peribiliary Acute Inflammation | BEC Hyperplasia |
|---|---|---|---|---|---|
| 6 | 5/6a | 0/6 | 2/6a | 1/6a | 0/6 |
| 24 | 1/6a | 6/6b | 6/6c | 6/6d | 0/6 |
| 48 | 6/6e | 6/6c | 4/6f | 6/6 g | 6/6c |
| 72 | 0/6 | 5/6 g | 4/6 g | 6/6c | 5/6d |
| 120 | 0/6 | 1/6 a | 0/6 | 2/6a | 6/6c |
| 168 | 3/6a | 0/6 | 0/6 | 1/6a | 5/6e |
BEC, biliary epithelial cell
aSeverity: slight
bSeverity: moderate
cSeverity mild or moderate
dmoderate or marked
eSeverity: mild
fSeverity: slight, mild, or moderate
gSeverity: slight or mild
FIG. 1.

Serum concentrations of TBil (A), total bile acids (B), GGT (C), ALP (D), ALT (E), and AST (F) were assessed in Vehicle- (black circle) and ANIT-treated (white square) rats. Bars represent the mean concentration ± SEM. Significance is *P < .05, **P < .01, and ***P < .001.
BrdU Incorporation Following a Single Administration of ANIT
Immunohistochemical staining of liver sections was utilized to assess the percentage of BrdU incorporation at the time of necropsy to determine the extent of cellular proliferation and hyperplasia (Supplementary Figure 2). Significant incorporation of BrdU was not observed in vehicle-treated animals but BrdU staining was significantly elevated in ANIT-treated animals between 48 and 120 h (P < .05). BrdU incorporation was observed in both BECs and hepatocytes during these time points.
mRNA and MiRNA Alterations Coincident With Hepatobiliary Injury and Biliary Hyperplasia
Hepatic mRNA transcript alterations that occurred concurrently with either hepatobiliary injury (24 h) or biliary hyperplasia (120 h) were then assessed. At 24 h, while active hepatobiliary injury was occurring in the absence of biliary hyperplasia, probes representing 551 unique mRNA transcripts were found to be significantly altered in the liver (P < .05 with 5% FDR correction; Supplementary Table 2). Not surprisingly, pathway analysis revealed enrichment in pathways involved in injury and injury response including NRF2-mediated oxidative stress response, LXR/RXR activation, and hepatic cholestasis (Table 2). At 120 h, when biliary hyperplasia was the predominant microscopic finding, fewer significant mRNA alterations were observed. At this time point, 89 transcripts were altered by treatment (P < .05 with 5% FDR correction; Supplementary Table 2) Enriched pathways included pathways involved in intracellular metabolism and repair, including oleate biosynthesis, γ-linolenate biosynthesis, and PXR/RXR activation.
TABLE 2.
Top Enriched Ingenuity Canonical Pathways in Hepatic Tissue at 24 and 120 h Following a Single Oral ANIT Administration (50 mg/kg)
| 24 h |
120 h |
||
|---|---|---|---|
| Pathway | −log(P) | Pathway | −log(P) |
| Superpathway of cholesterol biosynthesis | 7.73 | Oleate biosynthesis II (animals) | 3.28 |
| LPS/IL-1-mediated inhibition of RXR function | 6.44 | γ-linolenate biosynthesis II (animals) | 2.79 |
| NRF2-mediated oxidative stress response | 5.06 | PXR/RXR activation | 2.53 |
| Cholesterol biosynthesis | 4.82 | AMPK signaling | 2.10 |
| tRNA charging | 4.66 | Glycerol-3-phosphate shuttle | 1.99 |
| Tryptophan degradation III (Eukaryotic) | 4.66 | Xenobiotic metabolism signaling | 1.82 |
| LXR/RXR activation | 3.61 | Glycerol degradation I | 1.69 |
| Unfolded protein response | 3.61 | Glycogen biosynthesis II (from UDP-d-glucose) | 1.69 |
| Hepatic cholestasis | 3.54 | Nicotine degradation II | 1.64 |
| The visual cycle | 3.38 | CDK5 signaling | 1.40 |
The connection between histological evidence of hepatobiliary injury and hyperplasia and altered miRNA expression in the liver was then explored. To this end, the tissue RNA collected at 24 h (injury phase) and 120 h (biliary hyperplasia phase) were profiled utilizing Taqman Rodent miRNA Arrays sets A and B. ANIT treatment resulted in altered expression of 22 hepatic miRNA species, based on 2-way ANOVA analysis for treatment and time and a multiple test correction cutoff of P < .05 (Table 3). In general, the expression changes were of a low magnitude, with most representing <2×-fold changes, compared with concurrent control animals. When contrasts were interrogated to identify miRNAs specifically changed at each time point, there were no time-dependent differences in the magnitude of the majority of these 22 miRNAs identified as significantly affected by treatment (reflected in italics in Table 3). However, a single miRNA, miR-182‐5p, was significantly altered by ANIT treatment at both time points, with a time-dependent increase in liver from 24 h (mean fold change: 2.33×) to 120 h (mean fold change: 3.04×).
TABLE 3.
Hepatic MiRNA Alterations 24 and 120 h Following a Single Oral ANIT Administration (50 mg/kg)
| MiRNA | 24 h | 120 h |
|---|---|---|
| miR-130 a‐3p | 1.41 | 1.28 |
| miR-132‐3p | 1.46 | 2.67 |
| miR-146 b-5p | 2.04 | 1.92 |
| miR-16‐5p | 1.13 | 1.30 |
| miR-182‐5p | 2.33 | 3.04 |
| miR-191‐5p | 1.01 | 1.56 |
| miR-199 a‐3p | −1.01 | 1.98 |
| miR-200 c‐3p | 1.29 | 1.60 |
| miR-214‐3p | 1.14 | 1.77 |
| miR-218‐5p | 1.15 | 1.71 |
| miR-21 a‐5p | 1.41 | 1.97 |
| miR-223‐3p | 1.53 | 1.62 |
| miR-24‐2‐5p | 1.26 | 1.55 |
| miR-27 a‐3p | 1.22 | 1.32 |
| miR-301 b‐3p | 1.43 | 1.40 |
| miR-34 a‐5p | 1.33 | 1.74 |
| miR-429‐3p | 1.04 | 2.24 |
| miR-743 a‐3p | 1.55 | 3.16 |
| miR-872‐3p | 1.20 | 1.36 |
| miR-872‐5p | 1.27 | 1.38 |
| miR-881‐5p | −1.75 | −1.58 |
The fold changes of 22 miRNAs significantly altered by treatment, independent of time, in liver 24 and 120 h following a single dose of ANIT (50 mg/kg) are shown. Contrast was interrogated to determine significant miRNA alterations occurring at each time point. Bold text indicates a miRNA was significantly altered, at a given time point (P > .05). Italics text indicates that the miRNA fold change was not significant at a given time point.
Given the important role of miRNAs in regulation of gene expression, it was of interest to determine whether treatment-related miRNAs altered in liver tissue could explain the changes in transcript expression observed in this study. To this end, concordance between hepatic miRNA and mRNA alterations were assessed. The data were analyzed to assess whether the mRNAs significantly altered at either 24 or 120-h post-dose with ANIT exhibited enrichment for any of the 22 miRNAs found to be altered by ANIT. At 24 h, there was an enrichment of mRNAs regulated by miR-182‐5p (29 mRNA), miR-191 (2 mRNA), and miR-223 (16 mRNA) (P < .05). There was overlap of these master regulators at 120 h, with significant associations with miR-182‐5p (5 mRNA) and miR-223 (2 mRNA) (P < .05).
Identification of Temporally Altered MiRNAs in Plasma Following Administration of ANIT
In order to explore temporal miRNA alterations associated with hepatobiliary injury and hyperplasia, global miRNA profiling was conducted in plasma samples of all rats. Following dosing with ANIT, 21, 151, 96, 11, and 105 miRNA species were altered >2-fold at 6, 24, 48, 72, and 120 h, respectively, compared with concurrent vehicle-treated animals, with various degrees of overlap between time points (Supplementary Table 3, P < .05). No significant alterations were observed at 168 h. Interestingly, the directionality of miRNAs in circulation changed dramatically throughout the course of the study (ie, although a miRNA may have been significantly altered at 2 different time points, the direction of change was not necessarily the same). At 6 h, during early onset of biliary/hepatic lesions, almost all significantly altered miRNA species exhibited decreased abundance in plasma in ANIT-treated rats compared with vehicle controls. In contrast, at 24–72 h during hepatobiliary injury, all significantly altered miRNAs were elevated in plasma in ANIT-treated rats. Then, at 120 h, when biliary hyperplasia and cellular proliferation were predominant, all significant miRNA alterations were less abundant in plasma of ANIT-treated animals compared with vehicle-treated controls.
To further interrogate potential miRNA biomarker candidates of biliary injury and biliary hyperplasia, the 60 miRNAs that were significantly elevated in response to ANIT treatment, independent of time and directionality of change were visualized across all time points, ie, 6–168 h (P < .05, Figure 2 and Table 4A and B). Interestingly, well-established hepatic injury biomarker miR-122‐5p exhibited the highest magnitude of elevation in ANIT-treated rats at 48 h (198×), whereas miR-200b‐3p (34×), miR-429‐3p (31×), and miR-200a‐3p (29×) were elevated to a greater magnitude in plasma at 24-h post-dosing (Table 4A and B and Figure 2). miR-802‐5p was consistently among the top 5 elevated miRNAs in plasma from 24 to 72 h with peak increase of 172× at 48 h and nadir of 22× even at 72 h. In contrast, miR-122‐5p, also transiently elevated, was increased to a lesser extent (6.6×) at 72 h, suggesting that miR-802‐5p, along with miR-101b‐3p and miR-101a‐3p (increased ∼20× at 72 h), may have utility for detecting injury in the later stages.
FIG. 2.
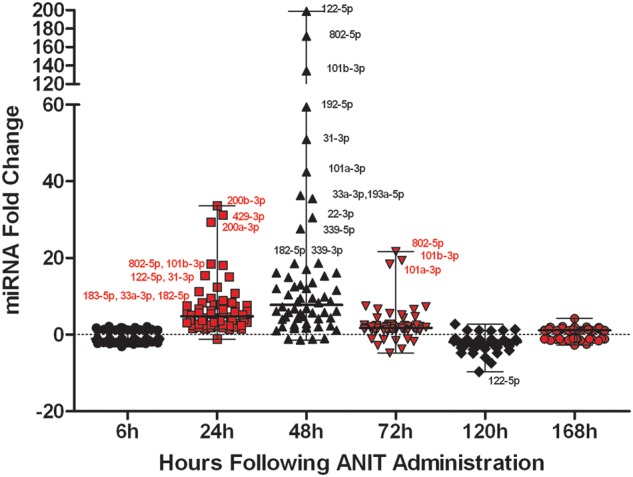
The mean fold change, compared with concurrent vehicle-treated rats, of all miRNAs found to be significantly altered by treatment following 2-way ANOVA and Benjamini-Hochberg FDR correction are shown at each time point following administration with ANIT to rats. Each symbol within a time point represents a unique miRNA species. Names are given for the miRNAs that are detailed in the ‘Discussion’ section. Bars represent the median and range of fold changes for the treatment significant miRNAs.
TABLE 4.
ANIT-Dependent Significantly Altered MiRNAs and Overlap With FP004BA-Dependent Significantly Altered MiRNAs
|
A. | |||||||||
|---|---|---|---|---|---|---|---|---|---|
| MiRNA |
ANIT Study |
FP004BA Study |
|||||||
| 6 h | 24 h | 48 h | 72 h | 120 h | 168 h | 1 d | 3 d | 14 d | |
| miR-101 a‐3p | −1.42 | 9.47 | 42.41 | 18.37 | −1.36 | −1.13 | 4.38 | 45.71 | 1.51 |
| miR-101 b‐3p | 1.78 | 18.10 | 134.21 | 19.38 | −1.89 | −1.46 | 6.52 | 89.32 | 1.18 |
| miR-122‐5p | −1.12 | 15.42 | 198.57 | 6.59 | −9.66 | −2.44 | 14.49 | 237.65 | 2.21 |
| miR-182‐5p | −2.04 | 10.78 | 18.58 | 7.30 | −2.15 | 1.36 | 1.81 | 12.79 | 8.88 |
| miR-183‐3p | −1.36 | 7.84 | 12.01 | 2.10 | −1.80 | 1.48 | 1.45 | 5.54 | 2.65 |
| miR-183‐5p | −2.27 | 11.23 | 9.45 | 2.33 | −1.68 | 1.28 | 2.48 | 8.73 | 4.40 |
| miR-192‐5p | −1.41 | 8.29 | 59.43 | 7.50 | −1.57 | 1.80 | 3.71 | 34.65 | 1.33 |
| miR-193 a‐5p | 2.20 | 8.28 | 35.45 | 5.54 | −2.93 | −1.13 | 2.73 | 25.59 | 1.33 |
| miR-193 b‐3p | −3.13 | 1.53 | 5.69 | 2.36 | −1.50 | 1.69 | 1.16 | 3.10 | −1.06 |
| miR-194‐5p | 1.24 | 6.70 | 12.98 | 1.60 | −2.71 | −1.25 | 2.95 | 20.30 | 1.23 |
| miR-19 b‐3p | −2.07 | 2.24 | 5.47 | 1.54 | −1.20 | 1.04 | 1.25 | 3.76 | −1.55 |
| miR-200 a‐3p | −1.34 | 29.32 | 4.31 | 2.21 | −3.43 | 1.00 | 6.19 | 6.09 | 1.48 |
| miR-200 b‐3p | 1.09 | 33.62 | 4.66 | 2.71 | −1.70 | 1.38 | 3.17 | 8.25 | 1.94 |
| miR-200 c‐3p | −2.29 | 7.68 | 2.27 | −3.70 | −2.81 | 1.17 | 3.72 | 2.12 | −1.39 |
| miR-203‐3p | −1.79 | 1.84 | 8.37 | 1.19 | −1.79 | 1.87 | −1.39 | 4.24 | −1.95 |
| miR-212‐3p | 1.14 | 8.86 | 2.82 | 1.30 | −1.83 | 1.64 | 3.49 | 3.10 | 1.71 |
| miR-2183 | 1.37 | 2.46 | 4.26 | 2.40 | −1.85 | 1.06 | 1.19 | 3.99 | 1.01 |
| miR-22‐3p | 1.40 | 6.25 | 30.57 | 4.41 | −4.80 | 1.28 | 3.53 | 18.23 | −1.02 |
| miR-22‐5p | 1.66 | 7.57 | 16.12 | 1.81 | −4.78 | −1.41 | 2.41 | 18.80 | 1.56 |
| miR-26 b‐3p | 1.57 | 6.13 | 12.03 | −1.25 | −4.12 | 1.49 | 1.85 | 9.45 | −1.91 |
| miR-30 a‐3p | 1.21 | 3.84 | 10.39 | 1.50 | −2.99 | 1.10 | 2.15 | 5.97 | −1.24 |
| miR-30 d‐5p | −1.54 | 3.02 | 9.87 | 1.41 | −2.76 | −1.08 | 1.80 | 4.24 | −1.56 |
| miR-30 e‐3p | 1.41 | 3.69 | 9.46 | 1.32 | −3.13 | 1.09 | 2.06 | 5.10 | −1.21 |
| miR-31‐3p | 1.25 | 15.01 | 50.96 | 5.21 | −2.46 | 1.07 | 3.99 | 46.89 | 4.12 |
| miR-339‐3p | −2.46 | 4.64 | 18.66 | 4.41 | −1.60 | 1.33 | 1.93 | 7.69 | −1.47 |
| miR-339‐5p | −1.91 | 5.90 | 27.58 | 2.17 | −2.95 | −2.68 | 1.75 | 5.24 | 1.23 |
| miR-33 a‐3p | 1.87 | 12.39 | 36.30 | 2.23 | −4.88 | 1.39 | 3.64 | 26.20 | −1.45 |
| miR-345‐3p | −1.48 | 4.32 | 14.99 | 2.54 | −3.68 | −1.24 | 2.01 | 23.48 | 1.27 |
| miR-34 a‐5p | 1.87 | 1.49 | 4.14 | 1.37 | −1.17 | 2.14 | 1.40 | 3.57 | −1.14 |
| miR-365‐3p | −1.51 | 4.36 | 16.16 | 1.79 | −2.67 | −1.71 | 1.09 | 5.98 | 1.23 |
| miR-378 a‐5p | 1.48 | 4.01 | 5.78 | 1.28 | −2.65 | −1.08 | 1.32 | 5.82 | −1.28 |
| miR-423‐3p | −1.52 | 2.20 | 4.79 | 1.65 | −2.07 | 1.07 | 1.25 | 3.75 | −1.84 |
| miR-425‐3p | −1.23 | 2.47 | 6.74 | 1.63 | −1.20 | 1.80 | 1.63 | 4.61 | −1.47 |
| miR-429‐3p | −1.89 | 31.22 | 5.80 | 1.93 | −1.62 | −1.02 | 3.28 | 7.42 | 2.23 |
| miR-466 k | −2.36 | 3.76 | 12.53 | 1.70 | 1.13 | 1.96 | 1.78 | 10.55 | 1.13 |
| miR-467 b‐3p | 1.08 | 5.63 | 1.55 | 2.09 | −1.56 | −1.12 | 1.23 | 58.69 | 1.21 |
| miR-467 d‐3p | −1.05 | 5.86 | 6.77 | 2.44 | 1.36 | 2.02 | 1.19 | 5.74 | 1.13 |
| miR-467f | 1.23 | 5.36 | 3.97 | 1.92 | 1.01 | −1.03 | 1.34 | 13.04 | 1.41 |
| miR-671‐3p | 1.08 | 2.19 | 15.34 | 4.76 | −2.70 | −1.09 | 1.24 | 4.17 | 1.37 |
| miR-674‐3p | 1.38 | 3.58 | 8.61 | 1.93 | −3.31 | 1.07 | 1.71 | 5.80 | −1.23 |
| miR-712‐5p | 1.70 | 2.35 | 1.03 | 1.18 | −1.25 | 1.49 | 1.45 | 2.27 | 1.05 |
| miR-744‐3p | 1.34 | 3.65 | 11.59 | 1.55 | −3.88 | 1.46 | 2.50 | 7.48 | −1.01 |
| miR-744‐5p | −1.40 | 3.19 | 13.60 | 6.68 | −1.52 | 1.12 | 1.61 | 8.89 | 1.66 |
| miR-7 a-1‐3p | −1.10 | 3.15 | 8.59 | 1.72 | −1.71 | 1.38 | 1.91 | 5.37 | −1.87 |
| miR-802‐5p | −1.06 | 18.40 | 171.67 | 21.64 | −2.32 | 1.20 | 15.50 | 200.30 | 8.03 |
| miR-872‐3p | −1.07 | 3.07 | 6.07 | 1.26 | −2.62 | 1.29 | 1.74 | 3.54 | −1.52 |
| B. | |||||||||
| miR-138-3p | −1.13 | 2.27 | 1.94 | 1.54 | 1.17 | 1.88 | |||
| miR-140-5p | −2.10 | 1.47 | 1.14 | −1.56 | −2.81 | −1.51 | |||
| miR-146b-5p | −2.01 | 5.15 | 2.01 | 1.30 | −1.34 | 1.36 | |||
| miR-1894-3p | −1.11 | 7.42 | 1.91 | 1.08 | −1.18 | 1.66 | |||
| miR-1949 | 1.39 | 6.58 | −1.15 | 2.21 | 2.75 | 4.23 | |||
| miR-204-5p | −1.29 | 1.29 | −1.34 | −4.72 | −7.39 | −1.13 | |||
| miR-205-5p | −2.14 | −1.14 | −1.01 | −1.72 | −2.03 | −1.16 | |||
| miR-223-3p | −1.06 | 1.97 | 1.66 | 1.19 | 1.14 | 1.79 | |||
| miR-27a-5p | 2.14 | 5.41 | 2.59 | −1.16 | −1.70 | 1.04 | |||
| miR-324-3p | −1.04 | 2.79 | 6.11 | 1.61 | −2.33 | 1.24 | |||
| miR-350 | −1.29 | 2.34 | 7.21 | 1.35 | −2.71 | 1.92 | |||
| miR-425-5p | −1.06 | 5.00 | 17.06 | 2.68 | −1.71 | 1.01 | |||
| miR-450a-5p | −1.07 | 1.85 | −1.14 | −2.77 | −5.96 | −1.60 | |||
| miR-690 | 1.47 | 7.55 | 2.03 | −1.07 | −1.04 | 1.96 | |||
The fold changes of 46 miRNAs significantly altered in plasma following either a single dose of ANIT (50 mg/kg) or 1, 3, or 14 daily doses of FP004BA (100 mg/kg/day), compared with concurrent Vehicle controls (A) are shown. An additional 14 miRNAs, which did not overlap with FP004BA, were significantly altered by ANIT treatment, independent of time (B). Bold text indicates a miRNA was also significantly altered, at a given time point, following contrast interrogation (P < .05). Italics text indicates that the miRNA fold change was not significant at a given time point.
Biliary Injury, Biliary Hyperplasia, and MiRNA Changes Following Daily Administrations of FP004BA
In order to assess whether miRNA changes observed with ANIT could be generalized to another compound with similar microscopic findings in the liver, rats were treated with FP004BA, a proprietary compound synthesized by Bayer Pharma AG, which was shown previously to cause biliary and hepatocellular injury and biliary hyperplasia (Ellinger-Ziegelbauer et al., 2011). Male Sprague-Dawley rats were administered daily oral doses of 100 mg/kg FP004BA or vehicle for 1, 3, or 14 consecutive days and necropsied as described in Supplementary Table 1.
Single-dose administration of FP004BA resulted in biliary and hepatocellular necrosis while oval cell/bile duct hyperplasia (and increased severity of biliary/hepatocellular necrosis) was noted after 3 daily doses. Fibrosis and bile duct hyperplasia were predominant findings after 14 daily doses, without any evidence of biliary cell necrosis and lower incidence and severity of hepatocellular necrosis (Table 5 and Supplementary Figure 3). There were no significant alterations in traditional liver biomarkers after a single-dose (1 d), however, increases in TBil (4.8×; Figure 3A), total bile acids (6.1×; Figure 3B), ALP (1.4×; Figure 3C), GGT (10.4×; Figure 3D), ALT (14.3×; Figure 3E), and AST (8.7×; Figure 3F) were observed after 3 doses (3 d). With the exception of GGT, traditional biomarker levels trended toward normal levels after 14 doses (14 d), although TBil, ALT, and AST still displayed mild (<2×), but significant elevations in compound-treated rats. Interestingly, GGT was progressively elevated through 14 doses of FP004BA (13×).
TABLE 5.
Hepatic Histopathology in Rats Administered Daily Oral Doses of FP004BA
| Histopathological Observation |
FP004BA Doses |
||
|---|---|---|---|
| 1 | 3 | 14 | |
| BEC necrosis | 6/6a | 6/6a | 0/6 |
| Hepatocellular necrosis | 3/6b | 6/6b | 2/6c |
| Peribiliary acute inflammation | 6/6b | 6/6a | 4/6c |
| BEC hyperplasia | 0/6 | 6/6c | 6/6a |
| Fibrosis | 0/6 | 0/6 | 6/6a |
BEC, biliary epithelial cell.
aSeverity mild or moderate.
bSeverity: slight or mild.
cSeverity: slight.
FIG. 3.

Serum concentrations of TBil (A), total bile acids (B), ALP (C), GGT (D), ALT (E), and AST (F) were assessed in rats treated with vehicle- (black circle) or FP004BA (white square) for 1, 3, or 14 days. Bars represent the mean concentration ± SEM. Significance is *P < .05, **P < .01, and ***P < .001.
Of the 60 miRNAs found to be altered by treatment in the ANIT-administered rats, 46 miRNAs were also significantly altered by FP004BA (Table 3). Visual analysis of the fold changes (compared with concurrent controls) of these 46 overlapping species in FP004BA-treated rats demonstrates that several of the same miRNAs are found at relatively high levels in the plasma following injury induced by either compound (Figure 4). Similar to ANIT, when liver enzymes peaked following FP004BA treatment (observed after 3 doses) miR-101b, miR-122‐5p, and miR-802‐5p demonstrated the greatest magnitudes of elevation (89.3×, 237.7×, and 200.3×, respectively). Interestingly, after 14 doses, levels of miR-182‐5p, 182‐3p, and 183‐5p remained elevated, despite a return of miR-122 levels back to baseline (Table 4A and B). At this time point, hepatocellular necrosis remained observable in 2 of 6 animals treated with FP004BA (Table 5). In the ANIT study, miR-182‐5p was also elevated prior to injury resolution (72 h, 7.3×).
FIG. 4.
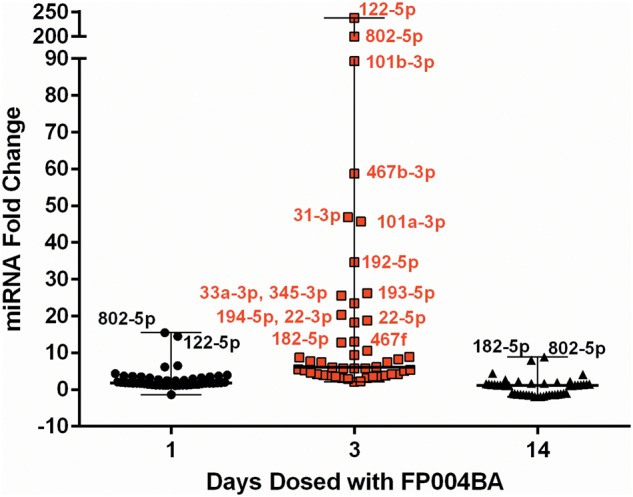
Plasma miRNA changes, resulting from FP004BA treatment, were evaluated in rats administered FP004BA and statistical significance was evaluated utilizing a 2-way ANOVA analysis and FDR correction. Forty-six species overlapped with miRNAs altered in response to ANIT. The mean fold changes of the 46 significant miRNAs, compared with concurrent vehicle-treated controls, are shown for all dosing regimens. Each symbol within a group represents a unique miRNA species. Names are given for the miRNAs highlighted in the ‘Discussion’ section. Bars represent the median and range of fold changes for the treatment-significant miRNAs.
The relative levels with respect to vehicle controls of the 8 miRNA species that were elevated during the early and peak injury phases (as defined by the largest concentrations of ALT in the blood) between the 2 studies are shown in Figure 5 for ease of comparison. These include miR-101a‐3p, miR-101b‐3p, miR-122‐5p, miR-192‐5p, miR-200a‐3p, miR-200b‐3p, miR-30d‐5p, and miR-802‐5p. Relative elevations in miRNAs in the blood are comparable during the early injury phases (6 h ANIT, 24 h FP004BA) and the peak injury phases (48 h ANIT, 72 h FP004BA).
FIG. 5.

The mean fold changes are shown for miRNA species that were significantly elevated and in common during peak injury phases in chemically treated animals with respect to controls. Early injury is denoted as the first time point in each study with histologic evidence of cellular injury (6 h for ANIT, 1 d for FP004BA). Peak injury is designated as the time points with the highest magnitude of elevation of ALT, AST, T bili, and ALP (48 h for ANIT, 3 d for FP400BA).
DISCUSSION
This study represents one of the first to systematically determine temporal miRNA alterations in plasma and hepatic tissue as well as associated mRNA changes during drug-induced hepatobiliary injury and hyperplasia, although mRNA transcript changes alone have been previously reported (Cullen et al., 2010). During the course of this study, additional hepatobiliary injury biomarker candidates to miR-122‐5p were identified, although future studies utilizing compounds that cause only one type of liver injury (ie, hepatocellular injury, biliary injury, or biliary hyperplasia) are necessary to qualify the sensitivity and specificity of these candidates. The current studies indicate that, despite a high abundance in blood during times of peak liver injury, miR-122‐5p levels return to baseline levels despite ongoing hepatobiliary injury, as evidenced by histopathology and standard clinical chemistry markers (eg, at 72 h in the ANIT study and at 14 days in the FP004BA study). The data therefore suggest that while miR-122 may have utility for differential diagnosis of liver injury owing to its reported liver specificity, a lack of miR-122 elevation in the blood may not necessarily indicate a lack of ongoing liver injury.
In our study, miR-802‐5p exhibited the largest elevation during hepatobiliary injury, and this species remained elevated in the ANIT study at 72 h, when miR-122‐5p levels were not significantly different from controls. Thus, miR-802‐5p may offer some advantages for detection of liver injury in its later stages prior to recovery. As is the case with miR-122‐5p, miR-802‐5p is enriched in liver tissue, at least in the rat (Linsen et al., 2010). Although a concurrent change in tissue expression of these species was not observed, this could indicate that the mature miRNAs were being leaked from cells, as a result of injury, without altering the production of these miRNAs by the liver. In addition, there was a trend for an increase in miR-802‐5p (8×; P = .06) following 14 daily administrations of FP004BA, when there was slight hepatocellular injury, while increases in traditional injury markers were <2×.
In addition, miR-101a‐3p and miR-101b‐3p were elevated in blood during hepatobiliary injury in both studies (24–72 h in the ANIT study, 1 d and 3 d in the FP004BA study). Unlike miR-122‐5p, expression of miR-101a and -101b is not specific to liver as these species have been reported to be expressed in the mammary gland (Tanaka et al., 2009) and in cardiac tissue (Zhao et al., 2015). However, elevation of these 2 species in blood in concert with established hepatocellular biomarkers may have the potential to distinguish liver injury that also involves BECs from liver injury only affecting hepatocytes and/or all non-BEC cells of the liver. Additional experiments to assess specificity are needed to clarify this hypothesis.
By 24 h following administration of ANIT, significant hepatic injury was observed, and this injury was characterized by BEC and hepatocellular damage, although biliary injury was more severe. Transcriptional changes in liver at this time point were consistent with hepatic injury and subsequent damage responses and included enrichment of the cholestatic injury pathway. Concurrent with these intracellular responses at 24 h were significant increases of miR-200a‐3p (29×) and miR-200b‐3p (34×) in plasma of ANIT-treated rats. These species are co-transcribed from a common locus and elevated levels of these species in circulation are associated with biliary atresia in humans (Xiao et al., 2014; Zahm et al., 2012). These 2 miRNAs were also significantly elevated following a single-dose of FP004BA, when incidence of BEC necrosis was greater compared with hepatocellular necrosis. Interestingly, members of the miR-200 family peaked at 24 h and were not among the most altered miRNA species at 48 h, as noted with the putative hepatocellular injury miRNAs; peak release of miR-200 family coincided with peak biliary damage and increase in traditional biliary injury markers (GGT and bile acids) at 24 h following ANIT administration. This family was also increased during mild BEC necrosis, following 1 dose of FP004BA, at a time point when traditional biomarkers of liver injury were not elevated. These findings implicate the miR-200 family as a potential class of sensitive and specific miRNAs associated with biliary damage.
The final 2 miRNAs with elevations in common between the 2 studies were miR-192‐5p and miR-30d‐5p. miR-192‐5p and a related family member of miR-30d‐5p, miR-30b‐5p, have been suggested as potential serum biomarkers of chronic hepatitis B in the context of normal ALT levels in patients (Tan et al., 2015). Together along with additional markers, it was noted that circulating levels had high diagnostic value in affected patients. In addition, miR-192‐5p has been shown in controlled clinical trials to be elevated in patients with suspected liver injury due to simvastatin use (Pek et al., Forthcoming). The miR-30 family has been shown previously to be involved in cellular differentiation within the liver (Hand et al., 2009). However, a drawback of these 2 markers may be a lack of specificity for liver injury—both miR-192‐5p and miR-30d‐5p have been shown to be increased in the blood of patients diagnosed with hypertrophic cardiomyopathy (Fang et al., 2015).
Curiously, in the ANIT study, at time points when biliary hyperplasia was the predominant histopathological lesion observed concurrently with resolution of most traditional biomarkers, all significant miRNA alterations were decreased with respect to controls (Supplementary Table 2). This finding may suggest a switch from substantial release of miRNA species into circulation during injury to a preferential retention of miRNAs during hepatic regeneration and biliary hyperplasia. Multiple other scenarios may potentially explain the significantly reduced levels of plasma miRNAs observed during hepatic regeneration/biliary hyperplasia. Given the cellular damage and substantial miRNA leakage occurring during active injury, reduced levels may reflect a latency period required for resynthesis/release of baseline levels of these species from hepatic cells or alternatively reduced expression at this time point. Another possibility is that uptake of these species by neighboring or supporting cell types is enhanced at this time point, given the presence of miRNAs in extracellular vesicles and the role of these transporters in cell-to-cell communication. For instance, recent evidence demonstrates that exosomes derived from alcohol-treated hepatocytes could transfer miR-122 to monocytes, sensitizing them to inflammatory response (Momen-Heravi et al., 2015).
Given the paucity of miRNA changes observed in liver, it is difficult to characterize the contribution of the hypotheses described above to the miRNA attenuation observed at 120 h following ANIT dosing; however, given that most species were either unaltered or augmented in hepatic tissue, attenuated plasma levels resulting from reduced hepatic expression seems less likely. Utilizing whole liver extracts may have hindered the ability to sensitively detect subtle miRNA expression differences occurring in specific subsets of cells. In the future, conducting a similar analysis in laser capture microdissected samples from specific cell types (ie, BECs or hepatocytes) may enhance the ability to observe these alterations. We did observe overlap of 6 miRNA species altered both in the plasma and tissue, as a result of ANIT treatment. At 120 h, 5 out of these 6 species were attenuated in plasma while being concurrently elevated in tissue. This finding may suggest that these 5 species (miR-182‐5p, miR-34a‐5p, miR-429‐3p, mir-872‐3p, and miR-146‐5p) are selectively retained at this point and may be important to the regeneration/biliary hyperplasia process. It is not surprising that there were few miRNA expression changes in the liver tissue—previous reports have shown a lack of upregulation of miR-122 in the context of liver injury that results in high concentrations of miR-122 in the blood (Wang et al., 2009).
In particular, miR-182‐5p is an interesting biomarker candidate because it was the only miRNA identified that was significantly altered in both the tissue and plasma at 24 and 120 h following compound dosing, suggesting an important contribution of this miRNA to injury and/or regeneration in this model. The finding that observed transcriptional changes at both time points are enriched for regulation by miR-182‐5p further supports this hypothesis. More importantly, miR-182‐5p remained elevated at 14 d in the FP004BA study, suggesting utility as a biomarker in the later stages of liver injury and early phases of regeneration. Given the observations that this miRNA is also elevated in models of hepatocellular injury (Yamaura et al., 2012) and BrdU labeling in this study revealed proliferation of both hepatocytes and BECs, it is difficult to ascertain whether miR-182‐5p contributes specifically to biliary injury and hyperplasia or hepatocellular injury or both. Analysis of miR-182‐5p alterations in liver tissue and plasma following administration of compounds that specifically cause only one type of these injuries may potentially provide insight into which processes miR-182‐5p contributes.
In conclusion, we have identified several candidate miRNA species that may be the basis for future studies focused on distinguishing markers of hepatobiliary injury and hyperplasia. The data suggest that measurement of a panel of miRNA markers in concert (including miR-101a‐3p, miR-101b‐3p, miR-122‐5p, miR192‐5p, miR-200a‐3p, miR-200b‐3p, miR-30d‐5p, miR-802‐5p, and miR-182‐5p) may provide important information regarding the stage of liver injury (early, peak, or resolution of injury). Future studies are necessary to validate the markers for specificity to liver tissue and sensitivity compared with traditional parameters; however, these data represent an important first step toward characterization of the temporal release of miRNAs from the beginning of hepatobiliary injury to injury resolution and progressive biliary hyperplasia.
Supplementary Material
ACKNOWLEDGMENTS
We would like to acknowledge and thank the following individuals: Merrie Mosedale and Scott Eaddy for technical assistance with the animal studies, Monica Singer for technical assistance with miRNA profiling in liver tissue, and Anton Bittner for technical assistance with transcriptomics.
FUNDING
The project was solely funded by Janssen Pharmaceutical Research & Development, L.L.C. A.H.H. was supported by The Burroughs Wellcome Fund Innovation in Regulatory Science Award. R.J.C. was supported by the Eunice Kennedy Shriver National Institute Of Child Health & Human Development (NICHD) and the National Institute Of General Medical Sciences (NIGMS) of the National Institutes of Health under award number 5 T32 GM086330‐04. The content is solely the responsibility of the authors and does not necessarily represent the official views of the National Institutes of Health.
SUPPLEMENTARY DATA
Supplementary data are available online at http://toxsci.oxfordjournals.org/.
REFERENCES
- Bartel D. P. (2004). MicroRNAs: genomics, biogenesis, mechanism, and function. Cell 116, 281–297. [DOI] [PubMed] [Google Scholar]
- Church R. J., McDuffie J. E., Sonee M., Otieno M., Ma J. Y., Liu X., Watkins P. B., Harrill A. H. (2014). MicroRNA-34c‐3p is an early predictive biomarker for doxorubicin-induced glomerular injury progression in male Sprague-Dawley rats. Toxicol. Res. 3, 384–394. [Google Scholar]
- Cullen J. M., Falls J. G., Brown H. R., Yoon L. W., Cariello N. F., Faiola B., Kimbrough C. L., Jordan H. L., Miller R. T. (2010). Time course gene expression using laser capture microscopy-extracted bile ducts, but not hepatic parenchyma, reveals acute alpha-naphthylisothiocyanate toxicity. Toxicol. Pathol. 38, 715–729. [DOI] [PubMed] [Google Scholar]
- Dear J. W., Antoine D. J., Starkey-Lewis P., Goldring C. E., Park B. K. (2014). Early detection of paracetamol toxicity using circulating liver microRNA and markers of cell necrosis. Br. J. Clin. Pharmacol. 77, 904–905. [DOI] [PMC free article] [PubMed] [Google Scholar]
- Ellinger-Ziegelbauer H., Adler M., Amberg A., Brandenburg A., Callanan J. J., Connor S., Fountoulakis M., Gmuender H., Gruhler A., Hewitt P., et al. (2011). The enhanced value of combining conventional and “omics” analyses in early assessment of drug-induced hepatobiliary injury. Toxicol. Appl. Pharmacol. 252, 97–111. [DOI] [PubMed] [Google Scholar]
- Fang L., Ellims A. H., Moore X. L., White D. A., Taylor A. J., Chin-Dusting J., Dart A. M. (2015). Circulating microRNAs as biomarkers for diffuse myocardial fibrosis in patients with hypertrophic cardiomyopathy. J. Transl. Med. 13, 314. [DOI] [PMC free article] [PubMed] [Google Scholar]
- Filipowicz W., Grosshans H. (2011). The liver-specific microRNA miR-122: biology and therapeutic potential. Prog. Drug Res. 67, 221–238. [PubMed] [Google Scholar]
- Hand N. J., Master Z. R., Eauclaire S. F., Weinblatt D. E., Matthews R. P., Friedman J. R. (2009). The microRNA-30 family is required for vertebrate hepatobiliary development. Gastroenterology 136, 1081–1090. [DOI] [PMC free article] [PubMed] [Google Scholar]
- Harrill A. H., Roach J., Fier I., Eaddy J. S., Kurtz C. L., Antoine D. J., Spencer D. M., Kishimoto T. K., Pisetsky D. S., Park B. K., et al. (2012). The effects of heparins on the liver: application of mechanistic serum biomarkers in a randomized study in healthy volunteers. Clin. Pharmacol. Therap. 92, 214–220. [DOI] [PMC free article] [PubMed] [Google Scholar]
- Kanki M., Moriguchi A., Sasaki D., Mitori H., Yamada A., Unami A., Miyamae Y. (2014). Identification of urinary miRNA biomarkers for detecting cisplatin-induced proximal tubular injury in rats. Toxicology 324, 158–168. [DOI] [PubMed] [Google Scholar]
- Kossor D. C., Meunier P. C., Handler J. A., Sozio R. S., Goldstein R. S. (1993). Temporal relationship of changes in hepatobiliary function and morphology in rats following alpha-naphthylisothiocyanate (ANIT) administration. Toxicol. Appl. Pharmacol. 119, 108–114. [DOI] [PubMed] [Google Scholar]
- Krauskopf J., Caiment F., Claessen S. M., Johnson K. J., Warner R. L., Schomaker S. J., Burt D. A., Aubrecht J., Kleinjans J. C. (2015). Application of high-throughput sequencing to circulating microRNAs reveals novel biomarkers for drug-induced liver injury. Toxicol. Sci. 143, 268–276. [DOI] [PubMed] [Google Scholar]
- Kroh E. M., Parkin R. K., Mitchell P. S., Tewari M. (2010). Analysis of circulating microRNA biomarkers in plasma and serum using quantitative reverse transcription-PCR (qRT-PCR). Methods 50, 298–301. [DOI] [PMC free article] [PubMed] [Google Scholar]
- Linsen S. E., de Wit E., de Bruijn E., Cuppen E. (2010). Small RNA expression and strain specificity in the rat. BMC Genomics 11, 249. [DOI] [PMC free article] [PubMed] [Google Scholar]
- Momen-Heravi F., Bala S., Kodys K., Szabo G. (2015). Exosomes derived from alcohol-treated hepatocytes horizontally transfer liver specific miRNA-122 and sensitize monocytes to LPS. Sci. Rep. 5, 9991. [DOI] [PMC free article] [PubMed] [Google Scholar]
- Nassirpour R., Mathur S., Gosink M. M., Li Y., Shoieb A. M., Wood J., O’Neil S. P., Homer B. L., Whiteley L. O. (2014). Identification of tubular injury microRNA biomarkers in urine: comparison of next-generation sequencing and qPCR-based profiling platforms. BMC Genomics 15, 485. [DOI] [PMC free article] [PubMed] [Google Scholar]
- Pavkovic M., Riefke B., Ellinger-Ziegelbauer H. (2014). Urinary microRNA profiling for identification of biomarkers after cisplatin-induced kidney injury. Toxicology 324, 147–157. [DOI] [PubMed] [Google Scholar]
- Pavkovic M., Riefke B., Frisk A. L., Groticke I., Ellinger-Ziegelbauer H. (2015). Glomerulonephritis-induced changes in urinary and kidney microRNA profiles in rats. Toxicol. Sci. 145, 348–359. [DOI] [PubMed] [Google Scholar]
- Pek S. L., Tavintharan S., Woon K., Lin L., Ong C. N., Lim S. C., Sum C. F. (2015). MicroRNAs as biomarkers of hepatotoxicity in a randomized placebo-controlled study of simvastatin and ubiquinol supplementation. Exp. Biol. Med. (Maywood). (Forthcoming). http://www.ncbi.nlm.nih.gov/pubmed/26429200. Accessed December 12, 2015. [DOI] [PMC free article] [PubMed] [Google Scholar]
- Schneider C. A., Rasband W. S., Eliceiri K. W. (2012). NIH Image to ImageJ: 25 years of image analysis. Nat. Methods 9, 671–675. [DOI] [PMC free article] [PubMed] [Google Scholar]
- Starkey Lewis P. J., Dear J., Platt V., Simpson K. J., Craig D. G., Antoine D. J., French N. S., Dhaun N., Webb D. J., Costello E. M., et al. (2011). Circulating microRNAs as potential markers of human drug-induced liver injury. Hepatology 54, 1767–1776. [DOI] [PubMed] [Google Scholar]
- Stevens J. L., Baker T. K. (2009). The future of drug safety testing: expanding the view and narrowing the focus. Drug Disc. Today 14, 162–167. [DOI] [PubMed] [Google Scholar]
- Tan Y., Ge G., Pan T., Wen D., Gan J. (2015). Serum MiRNA panel as potential biomarkers for chronic hepatitis B with persistently normal alanine aminotransferase. Clin. Chim. Acta 451, 232–239. [DOI] [PubMed] [Google Scholar]
- Tanaka T., Haneda S., Imakawa K., Sakai S., Nagaoka K. (2009). A microRNA, miR-101a, controls mammary gland development by regulating cyclooxygenase-2 expression. Differentiation 77, 181–187. [DOI] [PubMed] [Google Scholar]
- Wang K., Zhang S., Marzolf B., Troisch P., Brightman A., Hu Z., Hood L. E., Galas D.J. (2009). Circulating microRNAs, potential biomarkers for drug-induced liver injury. Proc. Natl Acad. Sci. U. S. A. 106, 4402–4407. [DOI] [PMC free article] [PubMed] [Google Scholar]
- Ward J., Kanchagar C., Veksler-Lublinsky I., Lee R. C., McGill M. R., Jaeschke H., Curry S. C., Ambros V. R. (2014). Circulating microRNA profiles in human patients with acetaminophen hepatotoxicity or ischemic hepatitis. Proc. Natl Acad. Sci. U. S. A. 111, 12169–12174. [DOI] [PMC free article] [PubMed] [Google Scholar]
- Weber J. A., Baxter D. H., Zhang S., Huang D. Y., Huang K. H., Lee M. J., Galas D. J., Wang K. (2010). The microRNA spectrum in 12 body fluids. Clin. Chem. 56, 1733–1741. [DOI] [PMC free article] [PubMed] [Google Scholar]
- Xiao Y., Wang J., Chen Y., Zhou K., Wen J., Wang Y., Zhou Y., Pan W., Cai W. (2014). Up-regulation of miR-200b in biliary atresia patients accelerates proliferation and migration of hepatic stallate cells by activating PI3K/Akt signaling. Cell. Signal. 26, 925–932. [DOI] [PubMed] [Google Scholar]
- Yamaura Y., Nakajima M., Takagi S., Fukami T., Tsuneyama K., Yokoi T. (2012). Plasma microRNA profiles in rat models of hepatocellular injury, cholestasis, and steatosis. PLoS One 7, e30250. [DOI] [PMC free article] [PubMed] [Google Scholar]
- Zahm A. M., Hand N. J., Boateng L. A., Friedman J. R. (2012). Circulating microRNA is a biomarker of biliary atresia. J. Pediatr. Gastroenterol. Nutr. 55, 366–369. [DOI] [PMC free article] [PubMed] [Google Scholar]
- Zhao X., Wang K., Liao Y., Zeng Q., Li Y., Hu F., Liu Y., Meng K., Qian C., Zhang Q., et al. (2015). MicroRNA-101a inhibits cardiac fibrosis induced by hypoxia via targeting TGFbetaRI on cardiac fibroblasts. Cell. Physiol. Biochem. 35, 213–226. [DOI] [PubMed] [Google Scholar]
Associated Data
This section collects any data citations, data availability statements, or supplementary materials included in this article.