


Abstract
Libraries of well-characterised components regulating gene expression levels are essential to many synthetic biology applications. While widely available for the Gram-negative model bacterium Escherichia coli, such libraries are lacking for the Gram-positive model Bacillus subtilis, a key organism for basic research and biotechnological applications. Here, we engineered a genetic toolbox comprising libraries of promoters, Ribosome Binding Sites (RBS), and protein degradation tags to precisely tune gene expression in B. subtilis. We first designed a modular Expression Operating Unit (EOU) facilitating parts assembly and modifications and providing a standard genetic context for gene circuits implementation. We then selected native, constitutive promoters of B. subtilis and efficient RBS sequences from which we engineered three promoters and three RBS sequence libraries exhibiting ∼14 000-fold dynamic range in gene expression levels. We also designed a collection of SsrA proteolysis tags of variable strength. Finally, by using fluorescence fluctuation methods coupled with two-photon microscopy, we quantified the absolute concentration of GFP in a subset of strains from the library. Our complete promoters and RBS sequences library comprising over 135 constructs enables tuning of GFP concentration over five orders of magnitude, from 0.05 to 700 μM. This toolbox of regulatory components will support many research and engineering applications in B. subtilis.
INTRODUCTION
Synthetic biology aims at the rational engineering of novel biological functions and systems (1). By facilitating the engineering of living organisms, synthetic biology promise to enable the development of many new applications for health, manufacturing, or the environment. For example, in the past decade researchers have achieved complete synthesis of many compounds of interest in microorganisms, including several pharmaceuticals (2–4). Synthetic gene circuits enabling cells to perform tuneable oscillations (5), data storage (6–9), Boolean logic (10,11) and pattern formation (12) have also been engineered. Many genetic circuits have been developed in mammalian cells for diagnosis, disease classification and treatment (13–15). More recently, bacteria have been re-programmed to record inputs within the mammalian gut (16), detect metastases in vivo (17), or diagnose diabetes in human clinical samples (18).
These achievements rely on gene circuits of increasing size and complexity, and biological engineers had to finely adjust the expression level of many different genes at a time. For example, yeast-based synthesis of tebaine and hydrocone required the concerted production of up to 23 different enzymes (4). Refactoring heterologous nitrogen-fixation cluster or injectisome into Escherichia coli necessitated the coordinated expression of respectively 20 and 27 genes within a single bacterial strain (19,20). In this context, the availability of multiple regulatory components enabling fine-tuning of gene expression has become of utmost importance. In response to these needs, several libraries of components have been produced to regulate gene expression at several levels (mainly transcription and translation) for many organisms of interest including E. coli, Saccharomyces cerevisiae, and mammalian cells (21–24).
Many synthetic biology research and applications have been developed in bacteria using the Gram-negative model, E. coli, because of its ease of use and great numbers of regulatory components available. On the opposite, and despite overwhelming potential interests, the use of the bacterial Gram-positive model, Bacillus subtilis, has so far been limited.
Bacillus subtilis is a soil bacterium from the Firmicute phylum, which has been a long-time model organism (25). Complete genome sequence, along with transcriptome and proteome wide responses to various environmental conditions have been determined (26,27). Because it presents simple differentiation pathways, B. subtilis has been a model system for studying cell-fate decisions during development (28,29). For example, the role of stochastic fluctuation in gene expression during differentiation was recently probed in B. subtilis (30). Much of our understanding of bacterial chromosomal replication also comes from studies performed in this organism (31).
In addition to its role in basic research, B. subtilis is a biotechnology workhorse, being routinely used for the production of enzymes, antibiotics, but also for bioremediation (32–33). Indeed, from an engineering perspective, B. subtilis presents many advantages like natural competency, easy chromosomal integration, and an endogenous secretion pathway widely used in industrial protein production. The sporulation capacity of this bacterium facilitates storage conditions and spores can also be used as a convenient format for the surface display of many biomolecules (34). Finally, B. subtilis is non-pathogenic, has been classified by the U.S. Food and Drug Administration as a ‘Generally Regarded As Safe’ and was granted Qualified Presumption of Safety status by the European Food Safety Authority.
One reason for the modest usage of B. subtilis in synthetic biology is the lack of well-characterised, publicly available collections of regulatory elements to precisely tune gene expression levels in this organism. Recently, a collection of standardised components containing three constitutive promoters, two inducible promoters, five integration vectors, and few epitope tags has been produced (35). However, and despite its usefulness, the tunability range and the part diversity of this toolbox are still limited as compared with tools currently available for E. coli.
Here we engineered a toolbox of promoters, RBSs, and proteolysis tags to control expression of a gene of interest at the levels of transcription, translation and protein degradation in B. subtilis over many orders of magnitude (Figure 1A). We also standardised our measurement processes and characterised their robustness between two different laboratories using a newly defined reference construct. Finally, by using fluorescence fluctuation methods coupled with two-photon microscopy, we measured in living cells the absolute concentration of GFP produced by different members of our library. From this work we deliver a full part library enabling the tuning of GFP concentration from nanomolar to millimolar concentrations (15 to 270 000 GFP molecules/ cell, respectively). This extensive parts library enabling precise tuning of gene expression will be useful for the broad research and engineering community working with B. subtilis.
Figure 1.

Design of a toolbox to tune genetic expression in Bacillus subtilis. (A) We engineered libraries of regulatory components with different strengths and sequences to tune genetic expression of a gene of interest (GOI): constitutive promoters to tune transcriptional efficiency, RBSs to tune translational efficiency and degradation tags to tune proteolysis rate of the protein of interest. (B) Architecture of our standardised and modular Expression Operating Unit (EOU). The EOU is composed of the standard regulatory elements (promoter, RBS, GOI, degradation tag), a standardised sequence of 8 nucleotides at the TSS position, a bidirectional terminator and a double terminator to insulate the cassette from genetic context. Spacers (SpX) of 40 bp designed to facilitate one-step isothermal assembly as well as several restriction sites enable simple construction and switching of parts. The EOU is integrated in the B. subtilis genome by double-crossover at the amyE locus (alpha-amylase gene). The EOU is coupled with a cassette coding for the spectinomycin adenyltransferase (spc) to allow antibiotic selection of the integrants.
MATERIALS AND METHODS
B. subtilis transformation and chromosomal integration
Bacillus subtilis strains derived from BSB168, a trp+ derivative of B. subtilis 168 (26,27). B. subtilis strains were grown on either LB media, M9 minimal media supplemented with glucose and malate (0.5% glucose and 0.3% malate) (M9-MG) or CHG medium supplemented with glucose (0.5%) (www.basysbio.eu) (CHG). Complete protocols and media composition for competent cells preparation and chromosomal integration (adapted from (36)) can be found in supplementary materials.
Briefly, synthetic constructs were integrated using pDG1730 integration vector into the amyE locus of B. subtilis genome by double-crossover integration. Positive selection of integration was performed with spectinomycin at 100 μg ml−1 and negative selection of single crossover integration events with erythromycin at 0.5 μg ml−1. Colony PCR for verifying part integrations were realised using Kapa 2G Robust PCR kit (Clinisciences, buffer B). The PCR products were then sequenced.
Molecular biology
We used pDG1730 (Genbank U46199,(37)) that we obtained from the Bacillus Genetic Stock Center (http://www.bgsc.org) as our backbone plasmid for B. subtilis integration into the amyE locus. All plasmids used in this study were derived from this vector and fragments assembled using one-step isothermal assembly (38) or restriction enzymes following standard molecular biology procedures. Restriction enzymes were purchased from New England BioLabs (NEB, Ipswich, MA, USA). PCR were performed using Q5 PCR master mix (NEB), primers and Gblocks were purchased from IDT (Louvain, Belgium; Carlsbad, USA). Plasmid extraction and DNA purification were performed using kits from Biosentec (Toulouse, France). Sequencing was realized by GATC Biotech (Cologne, Germany). All primers sequences and details on molecular biology protocols are available in supplementary materials.
Construction of randomised libraries and integration in B. subtilis
The various promoters, RBS sequences, or degradation tags libraries were generated by amplifying the GFP gene using primers containing the regulatory region of interest degenerated at strategic positions. This PCR products library was then digested by specific restriction enzymes and cloned into our standard EOU accordingly digested.
PCR amplification and cloning
For the initial Pveg libraries (Supplementary Figure S2A, no standard TSS element), Pveg was randomised following three different strategies: randomisation of −10 and −35 boxes, randomisation of −35 box, or randomisation of the −10 box. For the Pveg libraries (with standard TSS element), only the −10 box was randomized at three positions. Vectors and amplified fragments were digested by AgeI and SphI and ligated. PserA and PymdA were randomized following two strategies (randomisation of −10 box or randomisation of the region flanked by the −35 and −10 boxes). Vectors and amplified fragments were digested by BamHI and SphI and ligated. RBS and degradation tag libraries were generated following a similar procedure. Vectors and amplified fragments were digested by NheI and SphI.
Ligation and transformation into E. coli
Vectors and fragments were ligated using T4 ligase (NEB) at 16°C overnight. DNA was transformed in E. coli using electro-competent cells and plated in large selective agar plates (∼ 4 000 colonies per library). After overnight growth, all clones were scrapped from agar plates and grown at 30°C on 5 ml of LB during 2 h. 1 ml of culture was used for DNA extraction. Target sequence randomisation was verified by Sanger sequencing.
Batch integration into B. subtilis
For batch integration of libraries in B. subtilis, the integration protocol was performed using 10 μg of variant DNA in 10 mL of B. subtilis competent cells. At the end of integration protocol, two aliquots of 500 μl of cell cultures were plated on spectinomycin or erythromycin agar plates for quantification of integration efficiency (∼100 double-crossover events for 500 μl of competent cells, hence 2 000 clones per libraries using batch integration). The remaining cells were centrifuged at 1 600 g for 10 min, the supernatant was removed, cells were re-suspended in 10 ml of spectinomycin LB and grown 16 h at 30°C to avoid elimination of slowly-growing cells (39), before being either sorted by FACS or conserved in glycerol stocks.
Fluorescence activated cell sorting of libraries
For each library, glycerol stocks of B. subtilis variants were inoculated in 5 ml LB and grown 16 h at 30°C. The next day, cells were diluted and grown on M9-MG. Then, cells from the libraries were sorted using a S3 Cell Sorter (Biorad). The expression level range was divided in seven different regions, or bins, in which cells were sorted according to their GFP expression level. 10 000 bacteria were sorted into each bin and were plated on selective agar plates. For each promoter library, four variants per bin were selected for further characterisation, for a total of 28 variants per library. For each RBS library, 20 variants per bin were selected for a total of 140 variants characterised. All variants were entirely sequence verified. We excluded clones containing unexpected mutations (e.g. within the GFP sequence or the RBS for promoter libraries) and chose the variants presenting the lowest dispersion around the median value of the fluorescence intensities, and the lowest variability in gene expression between experiments performed on different days.
B. subtilis cell culture for parts characterisation
For measurements performed on exponential phase, 96 deep well plates filled with 1 ml of LB per well were inoculated with clones from fresh streaked plates. Plates were grown 16 h at 37°C. Cultures were diluted 40 times on 200 μl of LB in 96-well plates and grown 2 h. Then, cultures were diluted 40 times on 200 μl of M9-MG and grown at 37°C until OD reached ∼0.3–0.4 (∼3 h). Cultures were diluted 40 times on 200 μl of M9-MG and cells were immediately analysed on the flow-cytometer. For measurements performed on stationary phase, 96 deep wells plate filled with 1 ml of LB per wells were inoculated with clones from fresh streaked plates. Plates were grown 16 h at 37°C. Cultures were diluted 40 times on M9-MG and measure on flow-cytometer within the hour.
Flow-cytometer measurements and analysis
Quantification of expression levels of all strains were performed using Attune NxT flow-cytometer (Thermofisher) equipped with an autosampler. Experiments were performed on 96 wells plates with three replicates per plates. In each plate, the reference constructs and the negative control strain (integration of pDG1730 without EOU) were present. For a given part, each measurement procedure was performed in triplicates on three different days.
For flow cytometry measurements, 10 000 bacteria events were analysed. A gate was previously designed based on forward and side scatter graphs to remove debris or spores from the analysis. GFP fluorescence intensity was measured using excitation by a 488 nm laser and a 510/10 nm filter (BL1). mKate2 excitation was performed by a 561 nm laser and filter 615/25 nm (YL2). Voltages used were FFS: 440, SSC: 340, BL1: 490, YL2: 620.
Data were analysed using the Attune NxT software. Flow-Jo (Tristar) was used for data representation. Statistical values for each channels of the sample were calculated and exported. For each independent experiment, the median fluorescence intensity of the bacterial population for each replicate was extracted. Then, the mean fluorescence intensity was calculated from the three replicates. The mean values and standard deviation from three independent experiments were then calculated. Relative expression units were calculated for each independent experiment by dividing the mean fluorescence intensities values measured from the synthetic constructs by the mean fluorescence intensity measured from the reference construct. All raw data files are available in supplementary materials.
Plate reader experiments and analysis
Quantification of expression levels of promoters was performed using a BioTek Cytation 3 in Montpellier (France) and a BioTek Synergy II in Jouy-en-Josas (France). Experiments were performed using 96-well plates with three replicates per plate, and in each plate was always cultured the reference construct and the negative control strain. Three independent experiments were performed. To begin, 96 deep-well plate filled with 1 ml of LB per wells were inoculated with clones from fresh streaked plates. Cells were grown for 16 h at 37°C. Cultures were then diluted 400 times on 200 μl of LB in 96-well plates and grown until OD reached ∼0.3–0.4. At this point, cultures were diluted 400 times on 200 μl of CHG and grown at 37°C until OD reached 0.3–0.4. Cultures were diluted 400 times on 200 μl of CHG and grown for 16 h on plate reader with measure of green fluorescence intensity (ex. 485/20 nm, em. 528/20 nm) and absorbance (at 600 nm) every 10 min. Absorbance at 900 nm and 977 nm (Abs900, Abs977) were read once at the beginning of each experiment in order to correct the OD600 to an optical path length of 1 cm using the following equation: (Abs977 – Abs900)/0.18 (40). Fluorescein was present on the microtiterplate at two different concentrations (1 and 10 nM) in duplicates. Each culture was performed in triplicates. Polynomial and exponential functions were used to fit the experimental datasets of GFP and biomass, respectively (26), and to deduce the rates of biomass and GFP productions along the growth. GFP concentration was estimated as GFP per OD600, ( ), at each time point. In steady-state growth (μ = constant),
  is constant. GFP concentration (also referred to as activity) was expressed in Relative Expression Units (REU) using our reference construct. Data were analysed using custom Matlab scripts.
2-photon fluorescence microscopy experiments and number and brightness (N&B) analysis
Cells were cultivated in 24-well microplates in 1.5 ml M9-MG and maintained in exponential phase by dilution for at least 16 h to avoid the presence of spore. Aliquots of cell cultures were removed to perform simultaneously microscopy and flow-cytometry measurements. For microscopy experiments, 1 ml of culture at OD600 ∼0.2–0.5 was centrifuged at 1 600 g for 2 min, the supernatant was removed, and the cell pellet was re-suspended in M9-MG medium to a final OD600 of ∼25. A 2.5 μl aliquot was placed on a 2% agarose–M9 pad and cells were imaged using an Axiovert 200M inverted microscope (Zeiss, Germany) equipped with an ISS laser scanning module and an ISS Alba (ISS, Champaign, IL, USA) with two-channel APD detection (see (41) for details). Each experimental day, the laser was re-aligned and the 2-photon excitation volume was calibrated using a standard fluorescein solution. We used a laser power of 6 mW for all experiments, and an excitation wavelength of 930 nm for GFP. We measured our excitation volume to be of 0.07 fl, about a seventh of the bacterial cell volume. For each strain, four different fields of view (FOV) were imaged (256 × 256 pixels, 30 μm × 30 μm), each containing about 200–300 individual cells. For each FOV, a series of 50 raster-scanned images were recorded using a 40 μs laser dwell time per pixel. The negative control (NC) strain (expressing no GFP) was cultivated and imaged under identical conditions to determine the autofluorescence background level for each experimental day.
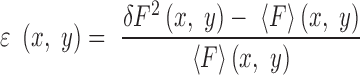
A summary of the procedure used for number and brightness (N&B) analysis derived from (42) is given below and detailed explanation of the method adapted for bacterial cells can be found in (41). Individual cells in each FOV were contoured automatically with manual correction using the Patrack software (43). For each FOV, fluorescence fluctuations (δF) from the average intensity over 50 scans (<F>) were first calculated at each pixel, providing pixel-based maps of the true (shot noise corrected) molecular brightness of the diffusing fluorescent particles, ϵ:
 |
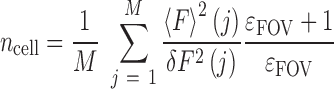
For each FOV, the average molecular brightness ϵFOV was determined using only the M pixels encompassed within all the cells of the FOV, and the number of fluorescent particles detected in the excitation volume within each cell was calculated:
 |
The molecular brightness of GFP (ϵGFP) was estimated for each experimental day by averaging ϵFOV measured for strains expressing moderate amount of GFP (i.e. 40< <ncell> <400). For each strain including the background strain, the average number of GFP equivalent molecules detected in the intracellular excitation volume was calculated using the daily ϵGFP value:
 |
The average intracellular concentration of GFP molecules <NGFP> corrected for the auto-fluorescence background was obtained by subtracting to <N> the average number of GFP equivalent molecules calculated for the NC strain (<Nnc>) and dividing by the excitation volume inside cell (volex = 0.07 fL, (41)) and the Avogadro number (NA) :
 |
The average number of GFP molecules per cell can be estimated by multiplying <NGFP> by NA and the average cell volume. Under our experimental conditions, we estimated the average cell volume to be a 0.5 fl ± 0.2, which was calculated from several images obtained for different strains and experimental days.
For the seven constructs measured using 2p sN&B methods, we obtained a linear correlation between concentration of GFP and fluorescence intensity measured using flow-cytometer in arbitrary unit. We assumed that the correlation is linear in the full expression range. As one REU corresponded approximately to 7.21 × 10⁴ AU (fluorescence Arbitrary Unit) and intracellular GFP concentration is equal to 0 for the background construct, we obtained a correlation between intracellular GFP concentration and relative promoter unit corrected by the background of 1 (REU – REUNC) = 144 ± 24% [GFP] (μM). To determine the correlation error, a correlation was determined individually for each seven values, and the 24% error corresponded to the highest error between the various correlations.
RESULTS
Design of a standard and modular Expression Operating Unit (EOU) for Bacillus subtilis
Our first goal was to design a genetic architecture supporting rapid, simple, and reliable parts assembly or exchange. An additional specification was to provide a standard genetic context for gene circuits characterisation. We thus designed a standardised and modular Expression Operating Unit (EOU, (22)) for controlling gene expression (Figure 1B). Since chromosomal integration is the general gene expression strategy used in B. subtilis, we placed our EOU into the pDG1730 vector (37), which is used for targeted chromosomal integration at the amyE locus. The basic EOU contains a gene of interest (GOI), which can be flanked by various regulatory components: a promoter, a ribosome binding site, and possibly a degradation tag. We also designed an Expression Operating Unit architecture for expression of two genes and for inducible gene expression (Supplementary Figure S1). We placed transcriptional terminators at both extremities of the EOU to stop transcription and to insulate the constructions from transcription incoming from neighbouring regions.
We also tried to avoid context effects due to the Transcription Start Site (TSS) region. In fact, at some promoters, the RNA polymerase can initiates transcription at two or three alternative neighbouring bases, +1, +2 or +3 (as illustrated in E. coli (44) and in B. subtilis by (45)). The probability to start transcription at +1, +2 or +3 most likely depends on the nature of the nucleotides present at these positions and on the intracellular level of the cognate NTPs (45,46). Unexpected context effect affecting transcription efficiency could therefore arise if we used various RBSs with different nucleotides compositions. Different 5′-untranslated regions could also affect gene expression levels by changing mRNA decay kinetics. We thus decided to standardise the (TSS) region of our constructs. We defined a standard TSS element (GGAGAAAA) corresponding to the first 8 nucleotides of the TSS of the PfbaA gene (encoding the fructose-bisphosphate aldolase), and placed it between the promoter and the RBS.
We incorporated 40 bp spacers at several positions to facilitate assembly and switch of parts using one-step isothermal Gibson assembly (38). In addition, we placed various cutting sites for different restriction enzymes so that parts can also be exchanged by restriction/ligation reactions. To quantify gene expression, we used a Green Fluorescent Protein (GFP) as a reporter. Based on previous work in B. subtilis (47), we selected the superfolder GFP (sfGFP(sp), simply named GFP from here and below), which is very efficiently expressed in B. subtilis.
Definition of a reference construct
The use of reference objects facilitates measurements reproducibility and design, and has a long-standing history of success in various engineering fields. In synthetic biology, a reference construct (using promoter BBa_J23101 coupled with GFP) has been used in E. coli as an in vivo standard facilitating comparison of in vivo promoter activity measurements (48). Expression of parts activity in Relative Expression Units (REU) using this reference construct allows reduction of data variation due to difference in day-to-day and lab-to-lab test conditions and set-ups. Previously, a reference construct had been proposed as well for B. subtilis (35). However, we found that the activity of this construct was too low to serve as a reliable reference for characterizing expression levels over a wide dynamic range (i.e. a small experimental variation from the reference construct greatly affects the calculated REU of all characterised constructs). We therefore designed a new reference construct for B. subtilis.
To this aim, we prepared a first library of randomised promoters based on the promoter Pveg, well-known to be constitutive (35,49, Supplementary Figure S2). From this library spanning 3 orders of magnitude in GFP expression levels, we selected a reference promoter (PREF) exhibiting an intermediate expression level. The full reference construct is composed of the PREF promoter sequence, a strong RBS sequence (named RBS R0) typically used with the B. subtilis IPTG inducible promoter Phyperspank and the GFP coding sequence. This reference construct was used in all subsequent experiments to express gene expression as Relative Expression Units (REU) instead of arbitrary fluorescence intensity units.
Choice and characterisation of ten B. subtilis constitutive promoters
We aimed at designing synthetic libraries of constitutive promoters spanning a wide dynamic range of transcriptional efficiencies in B. subtilis. Such constitutive promoter libraries are essential tools for precise engineering of genetic circuits. For example, in metabolic engineering, the expression level of the different enzymes of the pathway has to be precisely tuned (50). In order to identify a first set of natural constitutive promoters from the B. subtilis genome, we used data recently produced by the BaSysBio consortium (27). This consortium mapped the transcriptional architecture, metabolic and networks behaviour of B. subtilis at a large scale and over 100 different conditions.
We searched the mRNA expression database (http://genome.jouy.inra.fr/cgi-bin/seb/index.py) for genes which transcript levels were relatively constant over the full range of experimental conditions. We chose ten genes with promoter regions known or predicted to be dependent on the housekeeping sigma factor σA (Figure 2A). Two of these promoter regions, Pveg and PlepA, had already been isolated and characterised in B. subtilis (35,49). All the other promoter sequences were arbitrarily defined as the 50 first nucleotides upstream of the putative transcriptional start according to the alignment with the consensus sequence of σA recognition elements. Of note, when we added our standard TSS element to Pveg and to the reference promoter we observed a marked reduction in GFP expression (Supplementary Figure S3), confirming the influence of this region on transcriptional efficiency (44–46).
Figure 2.

Engineering constitutive promoter libraries to tune transcription level in B. subtilis. (A) B. subtilis constitutive promoters were selected from the BaSysBio database based on a regular transcription profile under 104 different conditions. Two sketches of potential transcriptional profiles are depicted, in which the y-axis correspond to the mRNA levels and the x-axis correspond to different conditions. Upper panel: a constitutive gene active in most of the conditions, and thus displaying a desirable profile for constitutive promoter library design. Lower panel: a gene showing significant variation in expression over the different conditions and therefore not a suitable candidate. Based on this framework, 10 constitutive promoters were selected and characterised using our standardised cassette, using R0 as RBS and a superfolder GFP as a GOI. The cassette was integrated into the amyE locus of the B. subtilis genome. Expression levels were measured by flow-cytometry in exponential phase (see methods). Expression levels are expressed in Relative Expression Unit (REU) and error-bars represent the standard deviation over 3 independent experiments. Promoter sequences are represented with their TSS sequences highlighted in blue and their −10 or −35 box aligned and highlighted in red for experimentally validated sequences and in green for putative sequences. Full library measurements data are available in supplementary data files 1 and 2. (B) Workflow to engineer promoter libraries. (i) Randomisation of promoters by PCR using randomised oligonucleotides: two different designs are depicted; design 1: randomisation of three nucleotides in the −10 region; design 2: randomisation of six nucleotides between -35 and -10 regions. (ii) Cloning of the randomised fragments in a shuttle vector. (iii) After transformation in E. coli, extraction of plasmid DNA from the pool of transformed E. coli. (iv) Batch integration in B. subtilis of the extracted plasmid DNA by double-crossover at the amyE locus. (v) Sorting of the library based on fluorescence intensity into seven different bins to obtain various pools of variants within the same range of expression level. (vi) Plating of sorted cells onto selective agar to isolate individual variants. (vii) Characterisation of four variants per gates: flow cytometer measurements and sequencing of colony PCR products from the integrated constructs. (C) Three curated promoter libraries from three different parent sequences were obtained by following the process describe above. Expression levels are in relative expression units (REUs) and obtained by flow-cytometry measurements performed in exponential phase. Error bars: ±SD over three independent experiments. See methods and supplementary material for more details. Full library measurements are presented in Supplementary Figure S3 and supplementary data files 1 and 3.
We introduced synthetic DNA fragments comprising the selected promoter regions in our standard EOU upstream of the standard TSS element, a strong RBS (R0), and the GFP coding sequence. The constructs were then integrated at the amyE chromosomal locus and GFP expression levels were measured by flow-cytometry in exponentially growing cells (Figure 2A). We observed high-level GFP production from the 10 selected promoters, demonstrating that the standard EOU we designed is a suitable reporter system for evaluating the relative transcriptional efficiency of promoter sequences integrated in the B. subtilis chromosome. The promoters activity went from 10- to 600-fold over the auto-fluorescence background level measured in the negative control (NC) strain. In all, the ten promoters spanned a 60-fold range in expression levels.
Construction and characterisation of promoter libraries
Recently constructed libraries of parts for E. coli or S. cerevisiae allow tuning of gene expression over a 10 000-fold range (21–23). In addition, if many parts are to be used in combination to engineer more complex gene circuits or pathways, different part sequences are required to avoid recombination due to high sequence similarity (51).
In order to increase the sequence diversity and expression dynamic range of our promoter parts, we randomized three different ‘parent’ promoter sequences. From our set of 10 constitutive promoters, we chose the three strongest: Pveg, PserA and PymdA. All three promoters have a strong consensus signature for the B. subtilis household sigma factor σA (TTGACA(-35)-N14-tgnTATAAT(−10)) and we expected that randomisation would more likely result in a loss rather than in a gain of function.
We first randomized the Pveg promoter, targeting simultaneously or independently nucleotides within the −35 and −10 boxes (Supplementary Figure S2A). Randomization of 3 nucleotides in the −10 box gave satisfactory results and was thus applied to the PserA and PymdA promoters. For these two promoters, we also tested a second randomization strategy, targeting six nucleotides (−21 to −16) in the spacer region between the −35 and −10 boxes (Figure 2B, Supplementary Figure S2B).
We cloned the randomized promoter sequences libraries into our standard gene EOU, using RBS R0 and GFP as reporter, amplified them in E. coli and integrated them within the B. subtilis genome. We then used Fluorescent Activated Cell Sorting (FACS) to isolate subpopulation of cells exhibiting specific transcriptional activity by sorting variants into seven different bins of varying GFP fluorescence intensity (Figure 2B). Then, for each bin, we characterised four variants using flow-cytometry (see materials and method for details). After screening, characterisation, and curation, we ended up with a set of 10–13 promoter variants for each library (excluding the wild-type sequence), chosen to span the highest magnitude in expression level (Figure 2C and Supplementary Figure S4).
For the first promoter library based on Pveg, randomization of the −10 box was sufficient to obtain a library covering a wide range of transcriptional activities (∼100 fold range, Figure 2C, left panel). However, for PymdA and PserA libraries, randomization of the −10 box produced mostly promoter variants displaying no or very weak activity, and only a very few efficient promoters were identified (Supplementary Figure S2). In contrast, randomization of the spacer region between the −35 and −10 boxes generated mostly strong to medium promoters. Interestingly, some members of both the PserA and PymdA libraries were more efficient than their parental promoter. By combining variants produced using both randomization strategies (see Supplementary Figure S4 for details), we obtained promoter libraries spanning a 900-fold range in REU (Figure 2C, middle and right panels).
Construction and characterisation of RBS libraries
Tuning gene expression at the level of translation can be essential depending on the gene circuits. For example, if a well-characterised inducible promoter is used, the simplest strategy to tune its expression dynamic range is to use a different ribosome-binding site (18,52). To tune translation efficiency, we first selected a set of 8 ribosome-binding sites derived from RBSs found in highly and constitutively expressed genes. The chosen RBS sequences comprise 20–24 bp and all of them but one (R4) contain the consensus (GGAGG) Shine-Dalgarno (SD) sequence for most bacterial species, including B. subtilis (53) albeit flanked by sequences of various compositions and lengths (Figure 3A). RBS sequence R0, which we used for screening our promoter libraries, is an optimized sequence typically used with the B. subtilis IPTG inducible promoter Phyperspank. RBS sequences R3 and R5 to R7 are synthetic sequences derived from the RBS sequence of the strongly expressed glycolytic fbaA gene (52). R1 and R4 are the natural sequence of the putative RBS sequence from the B. subtilis tufA (R1) and gltX (R4) genes, encoding respectively the elongation factor TU and the glutamyl-tRNA synthetase. R2 is a synthetic RBS sequence designed to maximize binding of the ribosome by pairing with up to 15 nucleotides at the 3′ end of the B. subtilis 16S rRNA sequence (54). We characterised the activity of these 8 RBS sequences in the context of our standard EOU integrated at the amyE locus, using Pveg as promoter and GFP as reporter (Figure 3B).
Figure 3.

RBS libraries to tune translation level in B. subtilis. (A) A set of nine RBSs was selected. Their sequences are represented with their Shine Dalgarno sequences in blue and the start codon of the GOI in green. (B) RBSs were characterised using the standardised cassette, using Pveg as a promoter and the superfolder GFP as a GOI. The cassette was integrated into the amyE locus of the B. subtilis genome. To engineer RBS libraries, we randomised six nucleotides inside and around the Shine-Dalgarno of the RBS parent sequences. (C) Expression levels from strains containing the eight RBSs driving GFP expression in exponential phase measured by flow-cytometry. Error bars: ±SD over 3 independent experiments. (D–F) Three RBS sequence libraries from 3 different parent sequences: R0, R1 and R2 (variants are engineered using the workflow described in Figure 2B). Flow-cytometry data are from 3 independent experiments performed in triplicates. Error bars: ±SD over three independent experiments. Full library measurements are presented in Supplementary Figure S4 and supplementary data files 1 and 4.
We measured GFP production in B. subtilis cells in exponential phase and we observed high expression levels with all 8 RBS, from about 50-fold up to 600-fold above the background level (Figure 3C). Interestingly, the synthetic RBS R2 supposed to maximize ribosome binding is not the most efficient sequence, in agreement with a previous report (55). In order to tune translation efficiency over a large dynamic range, we engineered three libraries of RBS parts, starting with the three strongest ribosome binding sites, R0, R1 and R2 as parent sequences. We then performed PCR using degenerated oligonucleotides to randomize six nucleotides upstream the start codon and comprising the Shine-Dalgarno sequence (XGGAGG or GGAGGX), a well-known method to tune translation efficiency (11) (Figure 3B). When screening each of our three RBS mutant libraries, we found that most of the B. subtilis transformants displayed fluorescence intensity close to background level, indicating that most of the mutations led to not or poorly active RBS sequences (Supplementary Figure S5A). Nevertheless, by re-applying the same sorting strategy as for promoters while characterising more variants per bin (28 for RBSs versus 4 for promoter libraries), we obtained three libraries with different sequences each composed of 10–11 RBSs with translational activities spanning ∼800 fold range (in REU) (Figure 3D–F, Supplementary Figure S5B).
Because gene expression efficiencies are known to be affected by interactions between the 5′UTR and the gene of interest (GOI), we measured the activity of our initial set of eight RBSs coupled to the coding sequences of two different fluorescent proteins (Figure S6A): GFP and the red fluorescent protein mKate2 ((56), named RFP from here on). Both proteins present 45.9% identity within their first 100 nucleotides. By plotting REU values for RBS coupled to GFP or RFP we obtained a linear correlation fit with a coefficient of determination of ∼0.87 (Supplementary Figure S6B). However, two RBS sequences (R4 and R7) stood apart from the linear correlation curve: R7 appeared more efficient for RFP than for GFP expression whereas R4 was functional with GFP but not with RFP.
We tried to alleviate this putative context effect by using a bicistronic design (BCD), a system described in E. coli containing two concatenated SD sequences that reduces the influence of the GOI sequences on translation initiation efficiency (57). We designed BCDs containing R4 and R7 and coupled them with GFP or RFP expression units. We then measured GFP and RFP expression from these BCDs and their monocistronic counterparts (Supplementary Figure S6C and S6D). For R7-BCD, we observed an increase in GFP expression level compared to monocistronic R7, while RFP expression levels remained similar. For R4-BCD, GFP expression levels were reduced compared to monocistronic R4, whereas RFP expression was greatly improved by using the BCD. These results suggest that BCDs can also be used in B. subtilis to mitigate context effects arising from 5′UTR-GOI interactions. However, it is hard from this small number of data points to conclude on a general applicability of BCDs in B. subtilis, and deeper investigations are needed.
Engineering libraries of SsrA proteolysis tags for B. subtilis
While some genetic circuits only require controlling gene expression levels at the transcriptional or translational levels, others need an additional layer of control at the post-translational level. In particular, tuning of protein degradation rate is essential to the dynamic behaviour of some synthetic gene circuits like oscillators or rewritable data storage circuits using recombinases (5,9,58). In E. coli, active proteolysis can be triggered by using the SsrA system, in which a small 14 amino-acids peptide added to the C-terminus of a protein acts as a molecular barcode through which polypeptides are targeted for proteolysis by cellular proteases from the AAA+ family like ClpXP (Figure 4A). Modifications of the three last residues of the SsrA peptide were shown to alter the affinity of the peptide for the protease, enabling researchers to tune protein degradation rates in E. coli (59) and in B. subtilis (60,61).
Figure 4.

Tuning proteolysis using SsrA degradation tags. (A) Principle of SsrA degradation tag: a peptide tag of 14 amino-acids fused the C-terminus of the protein of interest triggers active degradation of the protein by the ClpX protease. Degradation efficiency can be regulated by varying the three C-terminal amino-acids. LAA is the wt sequence and induces strong proteolysis. (B and C) Library of degradation tags were engineered based on our standardized cassette composed of Pveg as promoter, R0 as ribosome binding site and GFP as GOI and following the workflow detailed previously (Figure 2B). The three C-terminal amino-acids of the SsrA tag were randomised (XXX, where X is any of the 12 possible amino-acids of the library). Expression levels of the variants corresponding to three flow-cytometer experiments performed in triplicates in exponential phase (B) or on stationary phase (C) Error bars: ±SD over three independent experiments. Full library measurements data are available in supplementary data files 1 and 5.
In order to engineer an SsrA-tag library for B. subtilis, we fused various SsrA-derived peptides to the C-terminus of GFP placed under the control of the Pveg promoter and R0 RBS. We first used known functional variants of the SsrA tags LAA (wt), ASV, AAV as a C-terminal wild-type tripeptide and the non-functional SsrA-LDD tag as a negative controls (62). In addition, we engineered a SsrA-tag library by randomizing the three last amino-acids of the tag using a reduced 12 amino-acids alphabet (NDT codons: Phe, Leu, Ile, Val, Tyr, His, Asn, Asp, Cys, Arg, Ser, Gly), therefore reducing the library size with no stop codons while conserving an equal representation of each type of amino-acids (9,63). We then integrated the different SsrA-tagged GFP variants into the B. subtilis chromosome and measured their expression level by flow cytometry. Since all the SsrA-tagged GFP variants are expressed from the same promoter and RBS, we assumed that the observed differences in fluorescence intensity would be mainly due to differences in protein degradation rates.
It was previously shown in E. coli that the degradation rate of SsrA-tagged proteins is higher in stationary than in exponential phase, probably due to an increase in protease concentration (64). We supposed that a similar phenomenon could occur in B. subtilis. We thus characterised cell cultures of our SsrA-tag library in exponential and stationary phases. As expected, the strain expressing GFP fused to the non-functional LDD tag (GFP-LDD) had a fluorescence intensity similar to that of strain expressing untagged GFP. Of note, for both untagged GFP and GFP-LDD, the expression level increased about 2-fold in stationary phase, probably because of protein accumulation in the absence of dilution of the cellular content in non-growing cells. In contrast, for most of SsrA-tag variants, an important decrease in GFP abundance was observed, particularly in stationary phase (Figure 4). In comparison to untagged GFP, strains containing LAA, AAV and LVA tags showed about a 2-fold decrease in fluorescence intensity in exponential phase (Figure 4B), and about a 50- to 200-fold decrease in stationary phase (Figure 4C), with cells exhibiting low fluorescence intensity.
Therefore, a higher rate of proteolysis of SsrA-tagged proteins in stationary phase also occurs in B. subtilis. Assuming that protease concentration is the same in all the B. subtilis strains of our SsrA-tag library, our results show that it is possible to tune the protein degradation rate over at least 2 orders of magnitude depending on the C-terminal SsrA-tag tripeptide sequence.
Given the difference in activity between exponential and stationary phases observed using the degradation tags, we wondered if such variation in expression levels came from an unknown regulation of our promoters. We thus measured expression efficiency for all engineered and characterised constructs (promoter and RBS sets and libraries) in stationary phase. Rank orders of RBSs and promoters in relative expression units were conserved between exponential and stationary phase (Supplementary Figure S7). For promoters as well as for RBS sequences, we observed an average increase in REU between exponential and stationary phase of ∼1.5-fold with a standard deviation of 0.7. Some constructions show a stronger increase in GFP levels (e.g. promoter PY12, PS19, PfolEA, RBSs R3, R6, R7). This small global increase could here again be due to the diminution of cell-division related dilution of the cellular content in stationary phase. In conclusion, promoter and RBS libraries can be used to tune gene expression in B. subtilis in both exponential and stationary phase, with comparable REU values, and importantly with a conserved rank order.
Assessment of measurements robustness via data comparison between two laboratories
To test the reliability and reproducibility of our measurements processes, we decided to characterise a promoter set in two different laboratories. This comparison method has already proved to be useful in past characterisation work (48). For this reliability experiments, we worked with Casein–Hydrolase media supplemented with glucose (CHG) for two reasons. First, as CHG is richer than M9 minimal media, we supposed it would facilitate lab-to-lab calibration as cells would grow better and faster. Second, we wanted to measure our parts activity in another media.
For this test, we focused on the basic 10 original promoters (Figure 2A, and Supplementary Figure S8). After validating a common experimental protocol, we performed experiments separately using the same strains. We performed data analysis using the same methodology (see materials and methods) and obtained similar results in both laboratories, with comparable REU values and a conserved rank order between promoters. While using a limited number of constructs, these data demonstrate that our library behaviour is relatively reliable when measured by different users in different laboratories.
Interestingly, we compared these results performed in CHG media with our previous data performed in M9 minimal media (Supplementary Figure S9), and found a slight variation at the level of REU perhaps reflecting a different metabolic state of the cells (52,65). This difference could also be due to the fact that measurements were performed using different detection methods (bulk measurement on plate-reader for CHG experiments versus single-cell measurement on a flow-cytometer for M9 experiments). Nevertheless, the rank order of the promoters was well conserved, suggesting that the library can be expected to perform similarly in different growth conditions.
Live-cell measurement of the absolute GFP concentration produced by standard parts
Characterisation of our constructs by fluorescence intensity measurements using a flow-cytometer and our reference construct provides convenient calibration and quantification REU. However, for synthetic system design or model prediction, absolute quantification of the number and/or concentration of proteins produced can be desirable (42). For this purpose, we turned to a two-photon (2p) fluorescence fluctuation microscopy method, namely 2p scanning number and brightness (2psN&B) analysis (42). This method was recently adapted for the direct and absolute measurement of fluorescent proteins concentration in individual, live bacterial cells (41). Compared to other microscopy or flow-cytometry methods, the combination of two-photon microscopy and fast raster scan imaging greatly reduces photo-bleaching and background fluorescence, allowing for the precise determination of intracellular concentration of GFP even at very low expression levels (66) (Figure 5A).
Figure 5.

Measurement of part activities at the single molecule level. (A) Principle of 2-photon scanning number and brightness (2psN&B) analysis. 2psN&B allows the direct counting of fluorescent molecules diffusing in and out the very small excitation volume generated by 2-photon fluorescence microscopy (see materials and method for details). Bacterial cells expressing GFP and immobilised on an agarose pad are imaged by recording multiple scans (50 scans, 40 μs/pixel). From the mean and variance of the fluorescence signal, the average number of GFP molecules per bacteria and the brightness of the fluorescent protein are calculated. <FGFP>: background-corrected mean fluorescence intensity inside cells (A.U.); <NGFP>: mean number of GFP molecules; ϵGFP: average molecular brightness of GFP. (B) Number of GFP equivalent molecules per excitation volume (volex) produced by different standard parts from the toolbox. Seven constructions spanning the operational range of fluorescence fluctuation measurements were chosen from RBS and promoter libraries. Following the analysis procedure described in materials and methods, the average number of GFP equivalent molecules (<N>) detected per volex inside the bacterial cells (0.07 fl, about 15% of the cell volume), was calculated for each strain, not corrected for the auto-fluorescence background level measured in the negative control (NC) strain. Data and error bars correspond to the mean and SD of <N> values obtained from three independent experiments. For the R1–18 construct, GFP expression is clearly detected above background, with an average number of GFP molecules (<NGFP> = <N> – <NNC>) of 2.4 per volex., corresponding to a total of about 16 GFP molecules per cell. (C) Fluorescence intensity measurements from the same strains as in (B) were performed simultaneously on a flow-cytometer. Note that for the R1–18 construct, GFP expression cannot be detected above background by flow cytometry. (D) Linear correlation between the GFP concentration values in μM calculated from 2p sN&B experiments (see materials and methods) and the fluorescence intensity values in arbitrary unit obtained from simultaneous flow-cytometer experiments. Error bars: ±SD over three independent experiments. (E) Estimated GFP concentration in μM for all RBS and promoter variants calculated from the following correlation formula obtained from (D): 1 (REU – REUNC) = 144 [GFP] (μM). The error on the estimated GFP concentration was estimated to be ∼24%.
For absolute quantification purposes by 2psN&B, the use of monomeric fluorescent proteins is mandatory. If, as often observed, the fluorescent protein reporter tends to aggregate at increasing concentration, its molecular brightness will increase and the molecule numbers will be inaccurately calculated. We thus confirmed that the sfGFP(sp) reporter we used, already described as a monomer (67), remains monomeric in the concentration range of applicability of the 2psN&B method. To do so, we used a transcriptional fusion with the LacI-derived promoter Phyperspank and induced increasing expression of sfGFP(sp) with 0, 5, 10, 20 μM IPTG (Supplementary Figures S1 and S10). We then imaged exponentially growing cells as series of 50 raster-scans and performed N&B analysis (41,42). Although the background-corrected fluorescence intensity values increased over 7 fold, the molecular brightness of the fluorescent particles conserved similar values, averaging at about 0.065 ± 0.04 (counts per molecule per 40 μs dwell time) for induction between 0 to 10 μM of IPTG. This result indicates that the sfGFP(sp) does not self-associates upon increasing intracellular concentration and is therefore a suitable probe for performing 2psN&B experiments. A slightly lower brightness value (0.055) was calculated at 20 μM IPTG, obviously not because of protein aggregation (that would result in an increase of the molecular brightness) but rather because of the high expression level that generates reduced fluctuations of the fluorescent signal, and therefore less accurate determination of the molecular brightness value.
Fluorescence measurement by 2psN&B is a very much time-consuming method and its range of applicability is restricted to low expressed proteins. The 2psN&B method was thus not well suited for the characterisation of our full library of constructs, and we used it with the aim of calibrating expression levels measured by flow cytometry for part expressing low levels of fluorescent proteins. We first selected a set of seven constructs (three from our promoter libraries and four from our RBS libraries) with fluorescence intensities falling into the detection range of 2psN&B. We then measured the fluorescence intensity of single cells containing these different constructs by both 2p fluorescence fluctuations scanning microscopy (Figure 5B) and flow cytometry (Figure 5C). In case of the R1–18 and R2–15 constructs, GFP fluorescence intensity was close to the detection limit of the flow cytometer instrument whereas by 2psN&B it was clearly detected above the auto-fluorescence background level measured in the negative control (NC) strain. Regardless, for all constructs the mean fluorescence intensities measured by the two methods are in very good agreement, providing a linear correlation function relating flow-cytometer fluorescence intensities to the absolute concentration of GFP determined by 2psN&B analysis (Figure 5D). Assuming that this linear relationship remains valid at higher fluorescence intensities, we converted flow cytometry data expressed in relative expression units (REU) in intracellular protein concentration, with one REU (corrected for background auto-fluorescence) corresponding approximately to 144 μM of GFP (±24%). As shown in Figure 5E, our complete promoter and RBS library comprising over 135 constructs enable the expression of GFP to be tuned over five orders of magnitude, between concentration ranging from 0.05 to 900 μM, corresponding to an average number of GFP molecules per cell varying from 15 to 270 000.
DISCUSSION
In this work, we provide a well-characterised toolbox to tune gene expression in B. subtilis at the level of transcription, translation or proteolysis. We designed a modular and standardised EOU architecture flanked by strong transcriptional terminators to insulate the EOU from the genetic context. Our EOU provides a standard environment for the precise characterisation and comparison of novel biological parts in B. subtilis. Using our design, parts can be easily added, deleted, or swapped using restriction enzymes or isothermal Gibson assembly (38), facilitating future reuses and improvements of our libraries. In a future upgrade, our EOU architecture could also be redesigned to support multi-part assembly using Type II restriction enzymes (e.g. Golden gate assembly, (68)).
In order to accelerate the screen for variants exhibiting different properties, we applied a FACS based high-throughput methodology already used in E. coli (39). This approach greatly accelerated the design/build/test cycle, and allowed us to rapidly generate three sequence-divergent families of promoters and RBSs. Nucleotide sequence diversity can also possibly be obtained for degradation tags by changing the codon usage of the SsrA peptide. Such sequence variety within our libraries will enable the simultaneous use of multiple components while avoiding recombination problems due to sequence similarities (51,69). The method we describe here can be readily re-applied, if needed, to generate other families of parts with divergent sequences. Parts with similar activities but different sequences could also be used in combination for the expression of multiple genes.
From our various randomization design strategies, we observed that B. subtilis is much more stringent than E. coli in terms of promoters sequences. While the −35 and −10 boxes of E. coli promoters can be directly randomized to obtain a library spanning many orders of magnitude, B. subtilis promoters are much subject to have their activity completely abolished by random mutations within these regions. This could be explained by the fact that B. subtilis possesses much more different sigma factors, each specific to a growth condition or differentiation stage while E. coli has a reduced set of sigma factors (70). On the opposite, mutation within the region between the -35 and -10 boxes are much more tolerated.
Within our promoter libraries, we were able to identify sequences with an improved transcriptional activity and traced back this effect to the reconstitution of a consensus binding sequence for sigma factor SigA (see supplementary data file 1). Of note, we did not observe any effect of our parts on cell growth, even for parts presenting a strong protein expression (Supplementary Figure S11). Interestingly, we also identified variants with an improved activity by generating library of variants in which we randomised the region between the −35 and the −10 boxes. However, the rationale for this increase in transcriptional activities is obscure, but could involve higher-level regulatory effects like DNA looping (71). It would therefore be compelling to expand our approach by combining high-throughput DNA synthesis, FACS and next-generation sequencing (72) to systematically determine the promoter sequence features influencing transcriptional activity in B. subtilis.
Regarding context effects, we tested on a small number of sequences the sensitivity of our RBSs activities to two different genes with different sequences, sfGFP and mKate2, and found that two RBSs (4 and 7) had dramatically different activities when used with a different reporter. By incorporating a bicistronic design (57), we were able to partially restore these RBSs function. Our results suggest that context effect can be managed in B. subtilis in a similar manner than in E. coli. These effects, as well as strategies to mitigate them, need now to be extensively studied. Meanwhile, we provide large enough libraries of parts to quickly circumvent this difficulty.
Interestingly, we observed that the TSS element could also strongly influence the transcriptional activity of the Pveg promoter (Supplementary Figure S3). More characterisation is now required to understand the effects of TSS sequences on gene expression, but libraries of TSS sequences could potentially be engineered to provide an additional layer of control of gene expression. From our data, we anticipate that using different TSS sequences could increase the maximal gene expression levels obtained in our libraries. Future work should also be directed to the engineering of well-characterised inducible promoters with various activities and responding to different signals. Finally, the engineering of different integration vectors allowing for simultaneous insertion of multiple gene circuits within the B. subtilis chromosome is of utmost utility and should be quickly addressed by the Bacillus community.
A significant contribution of our work to the field of biological metrology is the use of fluorescence fluctuation methods to precisely characterise parts activities at the single-molecule level. We were able to identify promoter/RBS combinations producing a concentration as low as 50nM of GFP (∼15 GFP molecules/cell) in exponential phase. By extrapolating our single molecule data over the whole range of our libraries, we estimate that we can tune GFP concentration from nanomolar to millimolar range. Single-molecule measurements are the next frontier in standard parts characterisation, and have recently been explored at the mRNA level for a reference promoter in E. coli (69). The systematic development of such approaches promises to improve significantly the precision at which synthetic gene circuits can be tuned, while providing new synthetic tools for researchers investigating the mechanisms regulating gene expression. Engineers will still have to address the challenge of managing noise and stochastic effects in gene expression arising from very low number of molecules.
In conclusion, the libraries of regulatory components presented here are a first step toward a more precise and predictable control of gene expression and dynamics in B. subtilis. This toolbox will support many research and engineering applications in the Gram-positive model bacterium, for example for tuning the relative expression levels of various enzymatic members within a synthetic metabolic pathway. All parts and uses demonstrated or disclosed herein have been contributed to the public domain via the BioBrick public agreement (https://biobricks.org/bpa).
Supplementary Material
Acknowledgments
We thank Emmanuel Margeat, Luca Ciandrini, Joachim Rambeau, Guillaume Cambray, and members of the Bonnet and Jules lab for fruitful discussions. We acknowledge France-BioImaging infrastructure supported by the French National Research Agency (ANR-10-INSB-04-01, « Investments for the future ») and the GIS « IBiSA : Infrastructures en Biologie Sante et Agronomie ». All sequences and raw data are available in supplementary materials and supplementary data files. All libraries have been deposited and are available at the Bacillus Genetic Stock Center (http://www.bgsc.org/)
SUPPLEMENTARY DATA
Supplementary Data are available at NAR Online.
FUNDING
French Institut National de la Santé et de la Recherche Médicale (INSERM); Centre National pour la Recherche Scientifique (CNRS); Institut National de la Recherche Agronomique (INRA). S.G. is a recipient of a PhD Fellowship from the French Ministry of Research. INSERM Avenir program, Bettencourt-Schueller Foundation; ERC starting Grant (to J.B.). Funding for open access charge: INSERM (Atip-Avenir program) (to J.B.).
Conflict of interest statement. None declared.
REFERENCES
- 1.Endy D. Foundations for engineering biology. Nature. 2005;438:449–453. doi: 10.1038/nature04342. [DOI] [PubMed] [Google Scholar]
- 2.Ro D., Paradise E.M., Ouellet M., Fisher K.J., Newman K.L., Ndungu J.M., Ho K.A., Eachus R.A., Ham T.S., Kirby J., et al. Production of the antimalarial drug precursor artemisinic acid in engineered yeast. Nature. 2006;440:940–943. doi: 10.1038/nature04640. [DOI] [PubMed] [Google Scholar]
- 3.Ajikumar P.K., Xiao W.-H., Tyo K.E.J., Wang Y., Simeon F., Leonard E., Mucha O., Phon T.H., Pfeifer B., Stephanopoulos G. Isoprenoid pathway optimization for Taxol precursor overproduction in Escherichia coli. Science. 2010;330:70–74. doi: 10.1126/science.1191652. [DOI] [PMC free article] [PubMed] [Google Scholar]
- 4.Galanie S., Thodey K., Trenchard I.J., Filsinger Interrante M., Smolke C.D. Complete biosynthesis of opioids in yeast. Science. 2015;349:1095–1100. doi: 10.1126/science.aac9373. [DOI] [PMC free article] [PubMed] [Google Scholar]
- 5.Stricker J., Cookson S., Bennett M.R., Mather W.H., Tsimring L.S., Hasty J. A fast, robust and tunable synthetic gene oscillator. Nature. 2008;456:516–519. doi: 10.1038/nature07389. [DOI] [PMC free article] [PubMed] [Google Scholar]
- 6.Toman Z., Dambly-Chaudiere C., Tenenbaum L., Radman M. A system for detection of genetic and epigenetic alterations in Escherichia coli induced by DNA-damaging agents. J. Mol. Biol. 1985;186:97–105. doi: 10.1016/0022-2836(85)90260-8. [DOI] [PubMed] [Google Scholar]
- 7.Gardner T.S., Cantor C.R., Collins J.J. Construction of a genetic toggle switch in Escherichia coli. Nature. 2000;403:339–342. doi: 10.1038/35002131. [DOI] [PubMed] [Google Scholar]
- 8.Ajo-franklin C.M., Drubin D.A., Eskin J.A., Gee E.P.S., Landgraf D., Phillips I., Silver P.A. Rational design of memory in eukaryotic cells service Rational design of memory in eukaryotic cells. Genes Dev. 2007;21:2271–2276. doi: 10.1101/gad.1586107. [DOI] [PMC free article] [PubMed] [Google Scholar]
- 9.Bonnet J., Subsoontorn P., Endy D. Rewritable digital data storage in live cells via engineered control of recombination directionality. Proc. Natl. Acad. Sci. U.S.A. 2012;109:8884–8889. doi: 10.1073/pnas.1202344109. [DOI] [PMC free article] [PubMed] [Google Scholar]
- 10.Bonnet J., Yin P., Ortiz M.E., Subsoontorn P., Endy D. Amplifying genetic logic gates. Science. 2013;340:599–603. doi: 10.1126/science.1232758. [DOI] [PubMed] [Google Scholar]
- 11.Brophy J.A.N., Voigt C.A. Principles of genetic circuit design. Nat. Methods. 2014;11:508–520. doi: 10.1038/nmeth.2926. [DOI] [PMC free article] [PubMed] [Google Scholar]
- 12.Basu S., Gerchman Y., Collins C.H., Arnold F.H., Weiss R. A synthetic multicellular system for programmed pattern formation. Nature. 2005;434:1130–1134. doi: 10.1038/nature03461. [DOI] [PubMed] [Google Scholar]
- 13.Weber W., Fussenegger M. Emerging biomedical applications of synthetic biology. Nat. Rev. Genet. 2012;13:21–35. doi: 10.1038/nrg3094. [DOI] [PMC free article] [PubMed] [Google Scholar]
- 14.Xie Z., Wroblewska L., Prochazka L., Weiss R., Benenson Y. Multi-input RNAi-based logic circuit for identification of specifc cancer cells. Science. 2011;333:1307–1312. doi: 10.1126/science.1205527. [DOI] [PubMed] [Google Scholar]
- 15.Roybal K.T., Rupp L.J., Morsut L., Walker W.J., McNally K.A., Park J.S., Lim W.A. Precision tumor recognition by T cells with combinatorial antigen-sensing circuits. Cell. 2016;164:770–779. doi: 10.1016/j.cell.2016.01.011. [DOI] [PMC free article] [PubMed] [Google Scholar]
- 16.Kotula J.W., Kerns S.J., Shaket L.A., Siraj L., Collins J.J., Way J.C., Silver P.A. Programmable bacteria detect and record an environmental signal in the mammalian gut. Proc. Natl. Acad. Sci. U.S.A. 2014;111:4838–4843. doi: 10.1073/pnas.1321321111. [DOI] [PMC free article] [PubMed] [Google Scholar]
- 17.Danino T., Prindle A., Kwong G.A., Skalak M., Li H., Allen K., Hasty J., Bhatia S.N. Programmable probiotics for detection of cancer in urine. Sci. Transl. Med. 2015;7:289ra84. doi: 10.1126/scitranslmed.aaa3519. [DOI] [PMC free article] [PubMed] [Google Scholar]
- 18.Courbet A., Endy D., Renard E., Molina F., Bonnet J. Detection of pathological biomarkers in human clinical samples via amplifying genetic switches and logic gates. Sci. Transl. Med. 2015;7:289ra83. doi: 10.1126/scitranslmed.aaa3601. [DOI] [PubMed] [Google Scholar]
- 19.Temme K., Zhao D., Voigt C.A. Refactoring the nitrogen fixation gene cluster from Klebsiella oxytoca. Proc. Natl. Acad. Sci. U.S.A. 2012;109:7085–7090. doi: 10.1073/pnas.1120788109. [DOI] [PMC free article] [PubMed] [Google Scholar]
- 20.Ruano-Gallego D., Alvarez B., Fernandez L.A. Engineering the Controlled Assembly of Filamentous Injectisomes in E. coli K-12 for Protein Translocation into Mammalian Cells. ACS Synth. Biol. 2015;4:1030–1041. doi: 10.1021/acssynbio.5b00080. [DOI] [PMC free article] [PubMed] [Google Scholar]
- 21.Nielsen A.A., Segall-Shapiro T.H., Voigt C.A. Advances in genetic circuit design: novel biochemistries, deep part mining, and precision gene expression. Curr. Opin. Chem. Biol. 2013;17:878–892. doi: 10.1016/j.cbpa.2013.10.003. [DOI] [PubMed] [Google Scholar]
- 22.Mutalik V.K., Guimaraes J.C., Cambray G., Mai Q.A., Christoffersen M.J., Martin L., Yu A., Lam C., Rodriguez C., Bennett G., et al. Quantitative estimation of activity and quality for collections of functional genetic elements. Nat.Methods. 2013;10:347–353. doi: 10.1038/nmeth.2403. [DOI] [PubMed] [Google Scholar]
- 23.Lee M.E., DeLoache W.C., Cervantes B., Dueber J.E. A Highly Characterized Yeast Toolkit for Modular, Multipart Assembly. ACS Synth. Biol. 2015;4:975–986. doi: 10.1021/sb500366v. [DOI] [PubMed] [Google Scholar]
- 24.Ede C., Chen X., Lin M.Y., Chen Y.Y. Quantitative Analyses of Core Promoters Enable Precise Engineering of Regulated Gene Expression in Mammalian Cells. ACS Synth Biol. 2016 doi: 10.1021/acssynbio.5b00266. doi:10.1021/acssynbio.5b00266. [DOI] [PMC free article] [PubMed] [Google Scholar]
- 25.Earl A.M., Losick R., Kolter R. Ecology and genomics of Bacillus subtilis. Trends Microbiol. 2008;16:269–275. doi: 10.1016/j.tim.2008.03.004. [DOI] [PMC free article] [PubMed] [Google Scholar]
- 26.Buescher J.M., Liebermeister W., Jules M., Uhr M., Muntel J., Botella E., Hessling B., Kleijn R.J., Le Chat L., Lecointe F., et al. Global network reorganization during dynamic adaptations of Bacillus subtilis metabolism. Science. 2012;335:1099–1103. doi: 10.1126/science.1206871. [DOI] [PubMed] [Google Scholar]
- 27.Nicolas P., Mader U., Dervyn E., Rochat T., Leduc A., Pigeonneau N., Bidnenko E., Marchadier E., Hoebeke M., Aymerich S., et al. Condition-dependent transcriptome reveals high-level regulatory architecture in Bacillus subtilis. Science. 2012;335:1103–1106. doi: 10.1126/science.1206848. [DOI] [PubMed] [Google Scholar]
- 28.Losick R., Desplan C. Stochasticity and cell fate. Science. 2008;320:65–68. doi: 10.1126/science.1147888. [DOI] [PMC free article] [PubMed] [Google Scholar]
- 29.Schultz D., Wolynes P.G., Ben E. Deciding fate in adverse times: sporulation and competence in Bacillus subtilis. Proc. Natl. Acad. Sci. U.S.A. 2009;106:21027–21034. doi: 10.1073/pnas.0912185106. [DOI] [PMC free article] [PubMed] [Google Scholar]
- 30.Süel G.M., Kulkarni R.P., Dworkin J., Garcia-Ojalvo J., Elowitz M.B. Tunability and noise dependence in differentiation dynamics. Science. 2007;315:1716–1719. doi: 10.1126/science.1137455. [DOI] [PubMed] [Google Scholar]
- 31.Marbouty M., Le Gall A., Cattoni D.I., Cournac A., Koh A., Fiche J.-B., Mozziconacci J., Murray H., Koszul R., Nollmann M. Condensin- and Replication-Mediated Bacterial Chromosome Folding and Origin Condensation Revealed by Hi-C and Super-resolution Imaging. Mol. Cell. 2015;59:588–602. doi: 10.1016/j.molcel.2015.07.020. [DOI] [PubMed] [Google Scholar]
- 32.Van Dijl J.M., Hecker M. Bacillus subtilis: from soil bacterium to super-secreting cell factory. Microb. Cell Fact. 2013;12:3. doi: 10.1186/1475-2859-12-3. [DOI] [PMC free article] [PubMed] [Google Scholar]
- 33.Das K., Mukherjee A.K. Crude petroleum-oil biodegradation efficiency of Bacillus subtilis and Pseudomonas aeruginosa strains isolated from a petroleum-oil contaminated soil from North-East India. Bioresour. Technol. 2007;98:1339–1345. doi: 10.1016/j.biortech.2006.05.032. [DOI] [PubMed] [Google Scholar]
- 34.Iwanicki A., Piątek I., Stasiłojć M., Grela A., Lęga T., Obuchowski M., Hinc K. A system of vectors for Bacillus subtilis spore surface display. Microb. Cell Fact. 2014;13:30. doi: 10.1186/1475-2859-13-30. [DOI] [PMC free article] [PubMed] [Google Scholar]
- 35.Radeck J., Kraft K., Bartels J., Cikovic T., Dürr F., Emenegger J., Kelterborn S., Sauer C., Fritz G., Gebhard S., et al. The Bacillus BioBrick Box: generation and evaluation of essential genetic building blocks for standardized work with Bacillus subtilis. J. Biol. Eng. 2013;7:29. doi: 10.1186/1754-1611-7-29. [DOI] [PMC free article] [PubMed] [Google Scholar]
- 36.Vojcic L., Despotovic D., Martinez R., Maurer K.H., Schwaneberg U. An efficient transformation method for bacillus subtilis DB104. Appl. Microbiol. Biotechnol. 2012;94:487–493. doi: 10.1007/s00253-012-3987-2. [DOI] [PubMed] [Google Scholar]
- 37.Guérout-Fleury A.-M., Frandsen N., Stragier P. Plasmids for ectopic integration in Bacillus subtilis. Gene. 1996;180:57–61. doi: 10.1016/s0378-1119(96)00404-0. [DOI] [PubMed] [Google Scholar]
- 38.Gibson D.G., Young L., Chuang R.-Y., Venter J.C., Hutchison C.A., Smith H.O. Enzymatic assembly of DNA molecules up to several hundred kilobases. Nat. Methods. 2009;6:343–345. doi: 10.1038/nmeth.1318. [DOI] [PubMed] [Google Scholar]
- 39.Kosuri S., Goodman D.B., Cambray G., Mutalik V.K., Gao Y., Arkin A.P., Endy D., Church G.M. Composability of regulatory sequences controlling transcription and translation in Escherichia coli. Proc. Natl. Acad. Sci. U.S.A. 2013;110:14024–14029. doi: 10.1073/pnas.1301301110. [DOI] [PMC free article] [PubMed] [Google Scholar]
- 40.Botella E., Fogg M., Jules M., Piersma S., Doherty G., Hansen A., Denham E.L., Le Chat L., Veiga P., Bailey K., et al. pBaSysBioII: an integrative plasmid generating gfp transcriptional fusions for high-throughput analysis of gene expression in Bacillus subtilis. Microbiology. 2010;156:1600–1608. doi: 10.1099/mic.0.035758-0. [DOI] [PubMed] [Google Scholar]
- 41.Ferguson M.L., Le Coq D., Jules M., Aymerich S., Declerck N., Royer C.A. Absolute quantification of gene expression in individual bacterial cells using two-photon fluctuation microscopy. Anal. Biochem. 2011;419:250–259. doi: 10.1016/j.ab.2011.08.017. [DOI] [PubMed] [Google Scholar]
- 42.Digman M.A., Caiolfa V.R., Zamai M., Gratton E. The phasor approach to fluorescence lifetime imaging analysis. Biophys. J. 2008;94:L14–L16. doi: 10.1529/biophysj.107.120154. [DOI] [PMC free article] [PubMed] [Google Scholar]
- 43.Dosset P., Rassam P., Fernandez L., Espenel C., Rubinstein E., Margeat E., Milhiet P.E. Automatic detection of diffusion modes within biological membranes using back-propagation neural network. BMC Bioinformatics. 2016;17:197. doi: 10.1186/s12859-016-1064-z. [DOI] [PMC free article] [PubMed] [Google Scholar]
- 44.Cho B.-K., Zengler K., Qiu Y., Park Y.S., Knight E.M., Barrett C.L., Gao Y., Palsson B.Ø. Elucidation of the transcription unit architecture of the Escherichia coli K-12 MG1655 genome. Nat. Biotechnol. 2009;27:1043–1049. doi: 10.1038/nbt.1582. [DOI] [PMC free article] [PubMed] [Google Scholar]
- 45.Krasny L., Tiserova H., Jonak J., Rejman D., Sanderova H. The identity of the transcription +1 position is crucial for changes in gene expression in response to amino acid starvation in Bacillus subtilis. Mol. Microbiol. 2008;69:42–54. doi: 10.1111/j.1365-2958.2008.06256.x. [DOI] [PubMed] [Google Scholar]
- 46.Sojka L., Kouba T., Barvik I., Sanderova H., Maderova Z., Jonak J., Krasny L. Rapid changes in gene expression: DNA determinants of promoter regulation by the concentration of the transcription initiating NTP in Bacillus subtilis. Nucleic Acids Res. 2011;39:4598–4611. doi: 10.1093/nar/gkr032. [DOI] [PMC free article] [PubMed] [Google Scholar]
- 47.Overkamp W., Beilharz K., Detert Oude Weme R., Solopova A., Karsens H., Kovacs A.T., Kok J., Kuipers O.P., Veening J.-W. Benchmarking various green fluorescent protein variants in Bacillus subtilis, Streptococcus pneumoniae, and Lactococcus lactis for live cell imaging. Appl. Environ. Microbiol. 2013;79:6481–6490. doi: 10.1128/AEM.02033-13. [DOI] [PMC free article] [PubMed] [Google Scholar]
- 48.Kelly J.R., Rubin A.J., Davis J.H., Ajo-Franklin C.M., Cumbers J., Czar M.J., de Mora K., Glieberman A.L., Monie D.D., Endy D. Measuring the activity of BioBrick promoters using an in vivo reference standard. J. Biol. Eng. 2009;3:4. doi: 10.1186/1754-1611-3-4. [DOI] [PMC free article] [PubMed] [Google Scholar]
- 49.Lam K.H.E., Chow K.C., Wong W.K.R. Construction of an efficient Bacillus subtilis system for extracellular production of heterologous proteins. J. Biotechnol. 1998;63:167–177. doi: 10.1016/s0168-1656(98)00041-8. [DOI] [PubMed] [Google Scholar]
- 50.Keasling J.D. Synthetic biology and the development of tools for metabolic engineering. Metab. Eng. 2012;14:189–195. doi: 10.1016/j.ymben.2012.01.004. [DOI] [PubMed] [Google Scholar]
- 51.Canton B., Labno A., Endy D. Refinement and standardization of synthetic biological parts and devices. 2008;26:787–793. doi: 10.1038/nbt1413. [DOI] [PubMed] [Google Scholar]
- 52.Borkowski O., Goelzer A., Schaffer M., Calabre M., Mäder U., Aymerich S., Jules M., Fromion V. Translation elicits a growth rate‐dependent, genome‐wide, differential protein production in Bacillus subtilis. Mol. Syst. Biol. 2016;12:870. doi: 10.15252/msb.20156608. [DOI] [PMC free article] [PubMed] [Google Scholar]
- 53.Nakagawa S., Niimura Y., Miura K., Gojobori T. Dynamic evolution of translation initiation mechanisms in prokaryotes. Proc. Natl. Acad. Sci. U.S.A. 2010;107:6382–6387. doi: 10.1073/pnas.1002036107. [DOI] [PMC free article] [PubMed] [Google Scholar]
- 54.Doi R.H. Genetic Engineering in Bacillus subtilis. Biotechnol. Genet. Eng. Rev. 1984;2:121–155. doi: 10.1080/02648725.1984.10647797. [DOI] [PubMed] [Google Scholar]
- 55.Vellanoweth R.L., Rabinowitz J.C. The influence of ribosome-binding-site elements on translational efficiency in Baciiius subtiiis and Escherichia coii in vivo. Mol. Microbiol. 1992;6:1105–1114. doi: 10.1111/j.1365-2958.1992.tb01548.x. [DOI] [PubMed] [Google Scholar]
- 56.Shcherbo D., Murphy C.S., Ermakova G. V, Solovieva E. a, Chepurnykh T. V, Shcheglov A.S., Verkhusha V. V, Pletnev V.Z., Hazelwood K.L., Roche P.M., et al. Far-red fluorescent tags for protein imaging in living tissues. Biochem. J. 2009;418:567–574. doi: 10.1042/BJ20081949. [DOI] [PMC free article] [PubMed] [Google Scholar]
- 57.Mutalik V.K., Guimaraes J.C., Cambray G., Lam C., Christoffersen M.J., Mai Q.-A., Tran A.B., Paull M., Keasling J.D., Arkin A.P., et al. Precise and reliable gene expression via standard transcription and translation initiation elements. Nat. Methods. 2013;10:354–360. doi: 10.1038/nmeth.2404. [DOI] [PubMed] [Google Scholar]
- 58.Elowitz M.B., Leibler S. A synthetic oscillatory network of transcriptional regulators. Nature. 2000;403:335–338. doi: 10.1038/35002125. [DOI] [PubMed] [Google Scholar]
- 59.Andersen J.B., Sternberg C., Poulsen L.K., Bjørn S.P., Givskov M., Molin S. New unstable variants of green fluorescent protein for studies of transient gene expression in bacteria. Appl. Environ. Microbiol. 1998;64:2240–2246. doi: 10.1128/aem.64.6.2240-2246.1998. [DOI] [PMC free article] [PubMed] [Google Scholar]
- 60.Wiegert T., Schumann W. SsrA-mediated tagging in Bacillus subtilis SsrA-mediated tagging in Bacillus subtilis. J. Bacteriol. 2001;183:3885–3889. doi: 10.1128/JB.183.13.3885-3889.2001. [DOI] [PMC free article] [PubMed] [Google Scholar]
- 61.Griffith K.L., Grossman A.D. Inducible protein degradation in Bacillus subtilis using heterologous peptide tags and adaptor proteins to target substrates to the protease ClpXP. Mol. Microbiol. 2008;70:1012–1025. doi: 10.1111/j.1365-2958.2008.06467.x. [DOI] [PMC free article] [PubMed] [Google Scholar]
- 62.McGinness K.E., Baker T.A., Sauer R.T. Engineering controllable protein degradation. Mol. Cell. 2006;22:701–707. doi: 10.1016/j.molcel.2006.04.027. [DOI] [PubMed] [Google Scholar]
- 63.Reetz M.T., Wu S. Greatly reduced amino acid alphabets in directed evolution: making the right choice for saturation mutagenesis at homologous enzyme positions. Chem. Commun. (Camb). 2008 doi: 10.1039/b813388c. doi:10.1039/b813388c. [DOI] [PubMed] [Google Scholar]
- 64.Farrell C.M., Grossman A.D., Sauer R.T. Cytoplasmic degradation of ssrA-tagged proteins. Mol. Microbiol. 2005;57:1750–1761. doi: 10.1111/j.1365-2958.2005.04798.x. [DOI] [PubMed] [Google Scholar]
- 65.Klumpp S., Hwa T. Growth-rate-dependent partitioning of RNA polymerases in bacteria. Proc. Natl. Acad. Sci. U.S.A. 2008;105:20245–20250. doi: 10.1073/pnas.0804953105. [DOI] [PMC free article] [PubMed] [Google Scholar]
- 66.Ferguson M.L., Le Coq D., Jules M., Aymerich S., Radulescu O., Declerck N., Royer C.A. Reconciling molecular regulatory mechanisms with noise patterns of bacterial metabolic promoters in induced and repressed states. Proc. Natl. Acad. Sci. U.S.A. 2012;109:155–160. doi: 10.1073/pnas.1110541108. [DOI] [PMC free article] [PubMed] [Google Scholar]
- 67.Pédelacq J.-D., Cabantous S., Tran T., Terwilliger T.C., Waldo G.S. Engineering and characterization of a superfolder green fluorescent protein. Nat. Biotechnol. 2006;24:79–88. doi: 10.1038/nbt1172. [DOI] [PubMed] [Google Scholar]
- 68.Engler C., Kandzia R., Marillonnet S. A one pot, one step, precision cloning method with high throughput capability. PLoS One. 2008;3:e3647. doi: 10.1371/journal.pone.0003647. [DOI] [PMC free article] [PubMed] [Google Scholar]
- 69.Nielsen A.A.K., Der B.S., Shin J., Vaidyanathan P., Paralanov V., Strychalski E.A., Ross D., Densmore D., Voigt C.A. Genetic circuit design automation. Science. 2016;352:aac7341. doi: 10.1126/science.aac7341. [DOI] [PubMed] [Google Scholar]
- 70.Artsimovitch I., Svetlov V., Anthony L., Burgess R.R. RNA polymerases from Bacillus subtilis and Escherichia coli differ in recognition of regulatory signals in vitro. 2000;182:6027–6035. doi: 10.1128/jb.182.21.6027-6035.2000. [DOI] [PMC free article] [PubMed] [Google Scholar]
- 71.Cournac A., Plumbridge J. DNA looping in prokaryotes: experimental and theoretical approaches. J. Bacteriol. 2013;195:1109–1119. doi: 10.1128/JB.02038-12. [DOI] [PMC free article] [PubMed] [Google Scholar]
- 72.Sharon E., Kalma Y., Sharp A., Raveh-Sadka T., Levo M., Zeevi D., Keren L., Yakhini Z., Weinberger A., Segal E. Inferring gene regulatory logic from high-throughput measurements of thousands of systematically designed promoters. Nat. Biotechnol. 2012;30:521–530. doi: 10.1038/nbt.2205. [DOI] [PMC free article] [PubMed] [Google Scholar]
Associated Data
This section collects any data citations, data availability statements, or supplementary materials included in this article.