

Abstract
Key points
STE20 (Sterile 20)/SPS‐1 related proline/alanine‐rich kinase (SPAK) and oxidative stress‐response kinase‐1 (OSR1) phosphorylate and activate the renal Na+–K+–2Cl− cotransporter 2 (NKCC2) and Na+Cl− cotransporter (NCC).
Mouse models suggest that OSR1 mainly activates NKCC2‐mediated sodium transport along the thick ascending limb, while SPAK mainly activates NCC along the distal convoluted tubule, but the kinases may compensate for each other. We hypothesized that disruption of both kinases would lead to polyuria and severe salt‐wasting, and generated SPAK/OSR1 double knockout mice to test this.
Despite a lack of SPAK and OSR1, phosphorylated NKCC2 abundance was still high, suggesting the existence of an alternative activating kinase.
Compensatory changes in SPAK/OSR1‐independent phosphorylation sites on both NKCC2 and NCC and changes in sodium transport along the collecting duct were also observed.
Potassium restriction revealed that SPAK and OSR1 play essential roles in the emerging model that NCC activation is central to sensing changes in plasma [K+].
Abstract
STE20 (Sterile 20)/SPS‐1 related proline/alanine‐rich kinase (SPAK) and oxidative stress‐response kinase‐1 (OSR1) activate the renal cation cotransporters Na+–K+–2Cl− cotransporter (NKCC2) and Na+–Cl− cotransporter (NCC) via phosphorylation. Knockout mouse models suggest that OSR1 mainly activates NKCC2, while SPAK mainly activates NCC, with possible cross‐compensation. We tested the hypothesis that disrupting both kinases causes severe polyuria and salt‐wasting by generating SPAK/OSR1 double knockout (DKO) mice. DKO mice displayed lower systolic blood pressure compared with SPAK knockout (SPAK‐KO) mice, but displayed no severe phenotype even after dietary salt restriction. Phosphorylation of NKCC2 at SPAK/OSR1‐dependent sites was lower than in SPAK‐KO mice, but still significantly greater than in wild type mice. In the renal medulla, there was significant phosphorylation of NKCC2 at SPAK/OSR1‐dependent sites despite a complete absence of SPAK and OSR1, suggesting the existence of an alternative activating kinase. The distal convoluted tubule has been proposed to sense plasma [K+], with NCC activation serving as the primary effector pathway that modulates K+ secretion, by metering sodium delivery to the collecting duct. Abundance of phosphorylated NCC (pNCC) is dramatically lower in SPAK‐KO mice than in wild type mice, and the additional disruption of OSR1 further reduced pNCC. SPAK‐KO and kidney‐specific OSR1 single knockout mice maintained plasma [K+] following dietary potassium restriction, but DKO mice developed severe hypokalaemia. Unlike mice lacking SPAK or OSR1 alone, DKO mice displayed an inability to phosphorylate NCC under these conditions. These data suggest that SPAK and OSR1 are essential components of the effector pathway that maintains plasma [K+].
Key points
STE20 (Sterile 20)/SPS‐1 related proline/alanine‐rich kinase (SPAK) and oxidative stress‐response kinase‐1 (OSR1) phosphorylate and activate the renal Na+–K+–2Cl− cotransporter 2 (NKCC2) and Na+Cl− cotransporter (NCC).
Mouse models suggest that OSR1 mainly activates NKCC2‐mediated sodium transport along the thick ascending limb, while SPAK mainly activates NCC along the distal convoluted tubule, but the kinases may compensate for each other. We hypothesized that disruption of both kinases would lead to polyuria and severe salt‐wasting, and generated SPAK/OSR1 double knockout mice to test this.
Despite a lack of SPAK and OSR1, phosphorylated NKCC2 abundance was still high, suggesting the existence of an alternative activating kinase.
Compensatory changes in SPAK/OSR1‐independent phosphorylation sites on both NKCC2 and NCC and changes in sodium transport along the collecting duct were also observed.
Potassium restriction revealed that SPAK and OSR1 play essential roles in the emerging model that NCC activation is central to sensing changes in plasma [K+].
Abbreviations
- 5′RACE PCR
5′ rapid amplification of cDNA ends PCR
- ACN
acetonitrile
- AMPK
5′ adenosine monophosphate‐activated protein kinase
- BUN
blood urea nitrogen
- Cab39
calcium‐binding protein 39
- CLC‐K2
kidney‐specific member of the CLC chloride channel family
- Cre
Cre recombinase
- DCT
distal convoluted tubule
- DKO
SPAK/OSR1 double knockout
- DNPEP
aspartyl aminopeptidase
- ENaC
epithelial sodium channel
- FA
formic acid
- FL‐OSR1
full‐length OSR1
- KCC4
K+–Cl− cotransporter 4
- KS‐OSR1‐KO
kidney‐specific OSR1 knockout
- Ksp‐cadherin
kidney‐specific cadherin
- LC‐MS/MS
liquid chromatography‐tandem mass spectrometry
- MAL/VIP17
myelin and lymphocyte‐associated protein/vesicle integral protein of 17 kDa
- MO25‐alpha
mouse protein‐25 alpha
- NCC
Na+–Cl− cotransporter
- NDCBE
sodium‐driven chloride/bicarbonate exchanger
- NKCC2
Na+–K+–2Cl− cotransporter 2
- OSR1
oxidative stress‐response kinase‐1 (OSR1)
- p‐AMPK
phosphorylated AMPK
- PKA
protein kinase A/cAMP‐dependent protein kinase
- pNCC
phosphorylated NCC
- pNKCC2
phosphorylated NKCC2
- PRA
plasma renin activity
- ROMK
renal outer medullary potassium channel
- SBP
systolic blood pressure
- SORLA
sorting protein‐related receptor with A‐type repeats
- S‐OSR1
short‐OSR1
- SPAK
STE20 (Sterile 20)/SPS‐1 related proline/alanine‐rich kinase
- SPAK‐KO
SPAK knockout
- TAL
thick ascending limb
- TFA
trifluoroacetic acid
- tNCC
total NCC
- tNKCC2
total NKCC2
- WNK
with‐no‐lysine [K] kinase
Introduction
The Na+–K+–2Cl− cotransporter 2 (NKCC2), expressed along the apical membrane of the thick ascending limb (TAL), and the Na+–Cl− cotransporter (NCC), expressed along the distal convoluted tube (DCT), play important roles in ion homeostasis and blood pressure regulation by the kidney. Mutations in these cotransporters lead to the human disorders Bartter syndrome (NKCC2) and Gitelman syndrome (NCC), characterized by salt‐wasting, hypokalaemia, hypomagnesaemia, and normal to low blood pressure (Seyberth & Schlingmann, 2011). Both cotransporters are activated by phosphorylation at multiple sites along their amino‐terminal intracellular tails by STE20 (Sterile 20)/SPS‐1 related proline/alanine‐rich kinase (SPAK) and oxidative stress‐response kinase‐1 (OSR1) (Richardson et al. 2008, 2011), which are themselves activated via phosphorylation by the with‐no‐lysine [K] (WNK) kinases at T243 (SPAK) and T185 (OSR1) within the T loop, and at S383 (SPAK) and S325 (OSR1) within the S‐motif (Vitari et al. 2005). SPAK knockout (SPAK‐KO) (Yang et al. 2010; McCormick et al. 2011; Grimm et al. 2012), kidney‐specific OSR1 knockout (KS‐OSR1‐KO) (Lin et al. 2011), and knock‐in mice with mutations in SPAK at either threonine 243 (SPAK‐T243A) (Rafiqi et al. 2010) or leucine 502 (Zhang et al. 2015) have been generated to determine the functions of these kinases in vivo. SPAK‐KO mice display a Gitelman‐like phenotype with reduced blood pressure, hypokalaemia, hypocalciuria and hypomagnesaemia (Yang et al. 2010; McCormick et al. 2011; Grimm et al. 2012). SPAK/OSR1‐dependent phosphorylation of NCC (pNCC) is reduced, but NKCC2 phosphorylation at SPAK/OSR1‐dependent sites (pNKCC2) is increased, possibly due to ablation of inhibitory SPAK isoforms along the DCT (McCormick et al. 2011; Grimm et al. 2012). KS‐OSR1‐KO mice display a Bartter‐like phenotype with hypokalaemia, hypercalciuria and normomagnesaemia; blood pressure is normal unless salt‐restricted (Lin et al. 2011). Abundance of pNKCC2 is reduced, but that of pNCC is increased. Together, these studies suggest that although SPAK and OSR1 are both expressed along the TAL and DCT, they differentially mediate cotransporter activation, with SPAK being the major activator of NCC, and OSR1 the main activator of NKCC2 (McCormick et al. 2011; Grimm et al. 2012; Saritas et al. 2013). This does not preclude a role for SPAK along the TAL, or for OSR1 along the DCT, as shown by more recent studies with SPAK‐KO and KS‐OSR1‐KO mice (Terker et al. 2015). Furthermore, knock‐in mice expressing SPAK‐T243A, which may exert a dominant‐negative effect on OSR1, display reduced abundance of both pNKCC2 and pNCC (Rafiqi et al. 2010; Zhang et al. 2015). NCC and NKCC2 are also phosphorylated at sites distinct from the SPAK/OSR1 sites including S124 (Feric et al. 2011; Rosenbaek et al. 2012) and S811 (Feric et al. 2011) for NCC, and S126 for NKCC2 (Fraser et al. 2007; Richardson et al. 2011). The kinases responsible for phosphorylation at these SPAK/OSR1‐independent sites have not been clearly identified, and their physiological importance is unknown.
As SPAK‐KO and KS‐OSR1‐KO mice display fairly mild phenotypes, we hypothesized that SPAK and OSR1 compensate for each other, and disruption of both would lead to severe salt‐wasting and polyuria due to reduced activity of both NKCC2 and NCC. We therefore generated mice with constitutive disruption of SPAK and inducible disruption of OSR1 along the renal epithelium (because global OSR1 knockout is embryonic lethal; Lin et al. 2011). We found that contrary to our prediction, SPAK and OSR1 double knockout (DKO) mice do not display the severe phenotype predicted. Our data suggest that while important for determining NKCC2 activity and hence salt transport along the TAL, SPAK and OSR1 are not essential. Rather, they are essential for activation of NCC along the DCT, and are critical components of the emerging model in which the central role of the DCT is to maintain plasma [K+].
Methods
Ethical approval
All studies using mice were approved by the OHSU Animal Care and Usage Committee (Protocol IS3286) and followed the guidelines of the National Institutes of Health Guide for the Care and Use of Laboratory Animals. The investigators understand the ethical principles under which the journal operates and that their work complies with the journal's animal ethics checklist. Following blood collection via cardiac puncture under deep isoflurane anaesthesia (5% in O2 to induce, 1.5–2% to maintain, confirmed by unresponsiveness to paw pinching), mice were killed by cervical dislocation for tissue collection. For tissue collection not involving blood collection, animals were killed with carbon dioxide narcosis followed by cervical dislocation. Carbon dioxide was administered by inhalation and delivered at a flow rate of 20% chamber volume displacement per minute, using a flow meter to control delivery. For survival radiotelemetry surgeries, isoflurane anaesthesia was used; analgesia was performed as described below. At the end of the experiment animals were killed by decapitation, following removal of the radiotelemetry implant under isoflurane anaesthesia. Perfusion fixation was performed under deep anaesthesia with (ketamine/xylazine/acepromazine, 50/5/0.5 mg kg−1) and is a terminal procedure (death arises due to exansguination). Studies using Xenopus laevis oocytes were approved in accordance with the NORMA Oficial Mexicana NOM‐062‐ZOO‐1999 by the Universidad Nacional Autónoma de México (Protocol NMM‐767‐1218). Oocytes were harvested surgically from adult female X. laevis under 0.2% tricaine anaesthesia. Frogs were killed by immersion for 2 h in a 5 g l–1 buffered solution of tricaine, followed by surgical removal of the heart.
Animals
All mice were bred in‐house and males aged 3–5 months were used (except for Fig 3 D and E). SPAK/OSR1 double knockout mice were generated using the Pax8‐rtTA/LC1 system, which may also induce gene deletion in liver and thyroid gland (Traykova‐Brauch et al. 2008). To generate DKO mice, OSR1fl/fl mice were bred with SPAK knockout (SPAK‐KO) mice until homozygous OSR1fl/fl/SPAK‐KO mice were obtained, which were then bred with Pax8‐rtTA/LC1‐expressing mice. The resulting offspring were interbred to finally obtain OSR1fl/fl/SPAK‐KO/Pax8‐rtTA/LC1 mice. To induce Cre‐mediated recombination of the floxed OSR1 allele, OSR1fl/fl/SPAK‐KO/Pax8‐rtTA/LC1 mice were treated with 2 mg ml−1 doxycycline hyclate in 5% sucrose drinking water for 3 weeks. Genetically identical SPAK‐KO mice for comparisons were OSR1fl/fl/SPAK‐KO/Pax8‐rtTA/LC1 mice provided with sucrose water (no doxycycline) for 3 weeks. After doxycycline treatment, mice were returned to regular drinking water for at least 2 weeks before experiments were performed. Kidney‐specific knockout mice were generated by breeding OSR1fl/fl mice with Pax8‐rtTA/LC1‐expressing mice, and then interbreeding OSR1wt/fl mice to establish an OSR1fl/fl/Pax8‐rtTA/LC1 line. The following numbers of mice were used: radiotelemetry, 5 SPAK‐KO and 4 DKO; normal diet electrolytes and Western blots, 11 SPAK‐KO and 14 DKO; metabolic cage study including low sodium diet electrolytes and Western blots, 7 SPAK‐KO and 10 DKO; low potassium diet electrolytes and Western blots, 9 SPAK‐KO, 9 DKO, 10 control and 10 KS‐OSR1‐KO; perfusion fixation, 3 SPAK‐KO and 3 DKO; NCC response to potassium restriction, 8 SPAK‐KO and 8 DKO; phosphoproteomics, 2 SPAK‐KO and 2 DKO.
Figure 3. Effects of combined disruption of SPAK/OSR1 on abundances of total NKCC2 and NCC, and their SPAK/OSR1‐dependent phosphorylation .
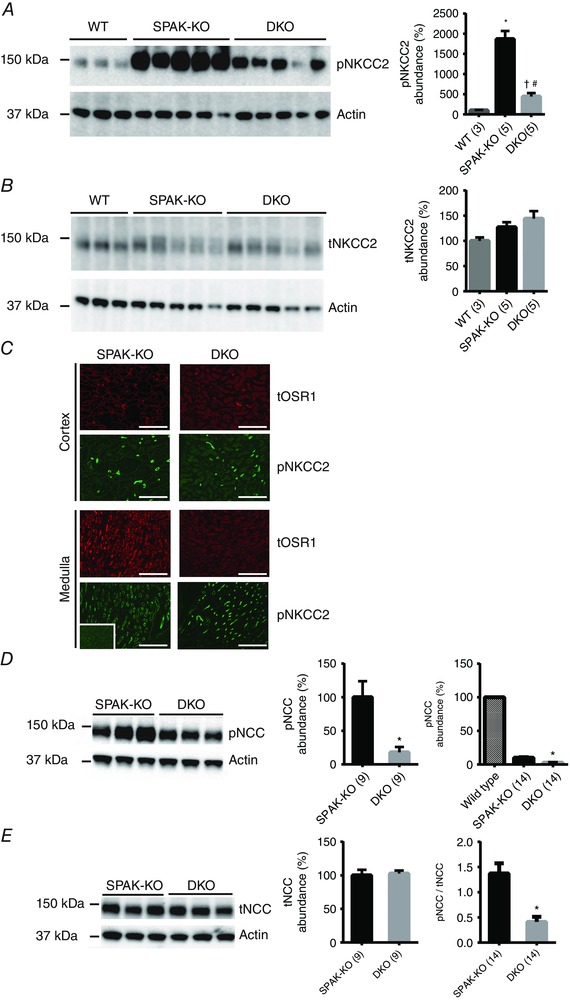
A, Western blot analysis showed that abundance of NKCC2 phosphorylated at the SPAK/OSR1‐dependent sites threonine 96 and threonine 101 (pNKCC2) was greater in SPAK knockout (SPAK‐KO) mice than in WT mice, or in SPAK/OSR1 double knockout (DKO) mice. Quantification (right) showed that pNKCC2 abundance was significantly greater in SPAK‐KO than in WT mice, * P = 0.0006; while pNKCC2 abundance was reduced in DKO mice compared with SPAK‐KO mice, # P = 0.0002; it was also still greater than in WT mice, † P = 0.025, one‐way ANOVA, multiplicity adjusted P values. B, abundance of total NKCC2 (tNKCC2) did not differ between SPAK‐KO and DKO mice. C, immunofluorescence of kidney sections revealed residual expression of total OSR1 (tOSR1) in the renal cortex, but a complete absence in the medulla. Despite complete ablation of tOSR1 in the medulla in DKO mice, there was significant expression of pNKCC2. Inset in bottom left shows an absence of pNKCC2 in the papilla, which together with no detection of pNKCC2 at the basolateral membrane in the inner medulla confirms that the pNKCC2 antibody does not detect pNKCC1. Scale bars = 400 μm. Adjustments were made to brightness and contrast to make images clearer, and were applied to the entire image. D, representative blot showed that the abundance of NCC phosphorylated at the SPAK/OSR1‐dependent site threonine 53 (pNCC) was lower in DKO than in SPAK‐KO mice; * P = 0.005, unpaired t‐test. Note that pNCC is reduced by 90% in SPAK‐KO compared with WT mice (McCormick et al. 2011), and DKO is thus almost absent compared with WT, as shown for illustrative purposes to the right (the low signal in DKO precluded analysis as long exposure to detect the difference between SPAK‐KO and DKO resulted in oversaturation of WT signal); * P = 0.001, one‐way ANOVA, multiplicity adjusted P value. E, abundance of total NCC (tNCC) did not differ between SPAK‐KO and DKO mice. Right, pNCC/tNCC ratio determined from using values in D and E, and shows that the reduction in pNCC is an effect on phosphorylation rather than on total expression; data from two SPAK‐KO and three DKO females are included; * P = 0.0002, unpaired t‐test. For quantification in A, B, D and E, densitometry values were normalized to actin and are means ± SEM; values in parentheses represent n.
PCR genotyping
Genomic DNA extracts were prepared from tail snips by heating overnight at 55°C in 300 μl digestion solution containing 5 mm EDTA, 200 mm NaCl, 100 mm Tris (pH 8.0), 0.2% SDS and 0.4 mg ml−1 proteinase K, followed by ethanol precipitation. The following primers were used: Pax8F 5′‐CCATGTCTAGACTGGACAAGA‐3′; Pax8R 5′‐CAGAAAGTCTTGCCATGACT‐3′; CREF 5′‐TTTCCCGCAGAACCTGAACCTGAAGAT‐3′; CRER 5′‐TCACCGGCATCAACGTTTTCTT‐3′; SPAKF 5′‐TTCTTAGCCACAGGGGGTGATG‐3′; SPAKR 5′‐GAGTCATAGAAGAGCAGAATAGCAG‐3′; OSR1floxF 5′‐AGCTCAGGCTCCCTCCACGGAG‐3′; OSR1floxR 5′‐AAGACACATTGATACTCTGTTT‐3′.
Antibodies
The following antibodies were employed and are specific to the following proteins, with dilutions in parentheses: total NCC (1:6000) (Bostanjoglo et al. 1998), pT53‐NCC (1:2000) (McCormick et al. 2011), pT96/T101 NKCC2 (1:1500) (McCormick et al. 2011), N‐terminal WNK4 (1:1000) (Yang et al. 2007), ENaC‐Alpha (1:1000) (Sorensen et al. 2013), NKCC2 (1:1500) (Schmitt et al. 2003) and NDCBE (1:250) (Leviel et al. 2010). Commercial antibodies were used against β‐actin (1:5000) (ab8227, Abcam, Cambridge, MA, USA), ENaC‐Beta (1:1000) (SPC‐404D, StressMarq, Victoria, BC, Canada), ENaC‐Gamma (1:1000) (SPC‐405D, StressMarq), pT197‐PKA catalytic subunit (1:2500) (ab75991, Abcam), pT172‐AMPK (1:1000) (2531S, Cell Signaling, Danvers, MA, USA), MO25‐alpha (1:1000) (2716, Cell Signaling). The antibody against the C‐terminus of SPAK (1:5000) was generated in our lab using a construct gifted by Eric Delpire. Several antibodies were generously provided as gifts: pS126‐NKCC2 (1:1000, Mark Knepper), OSR1 (1:5000, Eric Delpire), Pendrin (1:1000, Susan Wall) and pS124‐NCC and pS89‐NCC (see Acknowledgements).
Kidney Western blot
Kidneys were snap frozen in liquid nitrogen and stored at −80°C until homogenization. They were homogenized using a Potter homogenizer in 1 ml cold homogenization buffer containing lysis buffer containing 300 mm sucrose, 50 mm Tris‐HCl, pH 7.4, 1 mm EDTA, 1 mm EGTA, 1 mm NaVO4, 50 mm NaF, 1 mm ditiothreitol, 1 mm phenylmethane sulfonyl fluoride, 1 mg ml−1 aprotinin and 4 mg ml−1 leupeptin using a 10 ml Potter‐Elvehjem homogenizer. Homogenate was centrifuged at 6000 g for 15 min at 4°C and supernatant was transferred to a new tube and stored at −80°C. Then, 20 μg protein was separated on either a 4–12% Bis‐tris or 3–8% Tris‐acetate gel (Invitrogen, Carlsbad, CA, USA) and transferred overnight to a polyvinylidene fluoride membrane, which was blocked with 5% non‐fat milk in PBS‐Tween, followed by incubation with primary antibody (see above) for either 1 h at room temperature or overnight at 4°C. Membranes were washed, incubated with an HRP‐coupled secondary antibody (1:5000, Invitrogen), washed again, and finally incubated with Western Lightning ECL (Perkin Elmer, Waltham, MA, USA). ECL signal was detected with a Syngene Pxi4 imager, and densitometry was performed with ImageJ (http://rsbweb.nih.gov/ij/); all data were normalized to actin.
Immunofluoresence
Immunofluorescence for total OSR1 and pT96/T101 NKCC2 was performed on frozen sections as previously described (McCormick et al. 2011; Saritas et al. 2013). Briefly, animals were perfusion fixed with 4% paraformaldehyde while under deep anaesthesia (ketamine/xylazine/acepromazine, 50/5/0.5 mg kg−1). After cryoprotection in 800 mosmol sucrose and freezing in OCT, 5 μm sections were cut. Sections were incubated overnight at 4°C with either 1:400 anti‐total OSR1 or 1:1000 anti‐pT96/T101 NKCC2 antibody, followed by incubation with 1:750 anti‐rabbit Cy3‐ or FITC‐conjugated secondary antibody for 1 h at room temperature. Images were captured with an EVOS FL Auto imaging system (Thermo Fisher, Waltham, MA, USA).
Cloning of short‐OSR1 (S‐OSR1)
5′ Rapid amplification of cDNA ends PCR (5′RACE PCR) was performed on total mouse kidney RNA as described previously for cloning of SPAK isoforms (McCormick et al. 2011), using a primer to exon 11 of mouse OSR1: 5′TATGGAGACGGCCACTGGAGCCG. To confirm the presence of the novel short form of OSR1 in kidney, but not in brain, RT‐PCR was performed using a forward primer to the novel exon 4A (4AF, 5′GTCTCCCTGCATGGCTCATTAGGGG), and reverse primers to exon 5/6 (5/6R, 5′CGCCGAAATCTGCAATCTGCACAG, predicted size of product 115 bp) and exon 8 (8R, 5′GAAGGAGGATCATTCTGGAGCGTCAGC, predicted size of product 353 bp). PCR using a forward primer to exon 4 (4F, 5′GGAGTTCTGGACGAGCCAACCATTG) with the reverse exon 8 primer (predicted size of product 393 bp) was used as a positive control.
Blood pressure measurement
Blood pressure was measured in male mice only by radiotelemetry using PA‐C10 transmitters (Data Sciences Inc., St. Paul. MN, USA) implanted in the left carotid artery, with the transmitter inserted into a pocket in the body cavity, as previously described (McCormick et al. 2014). Mice were anaesthetized using isoflurane (5% in O2 to induce, 1.5–2% to maintain). Following surgery, mice received 0.1 mg kg−1 buprenorphine i.p. twice daily for 3 days as analgesia. Animals were monitored for alertness, activity and loss of weight, and given at least 7 days to recover from surgery before measurements were recorded for 10 s every 10 min. Twenty‐four hour averages were used to calculate mean systolic blood pressure (SBP).
Dietary manipulation
For radiotelemetry, 0.49% NaCl diet (Harlan Laboratories, Indianapolis, IN, USA; TD.96208) was used with approximate content: 0.2% Na+, 0.36% Cl− and 0.8% K+. For metabolic cage studies, Na+ deficient diet (TestDiet, AIN‐93G Rodent Diet) was used to make a gel diet (5 g diet, 8 ml water and 0.02 g agar), with approximate content: 0.03% Na+ and 0.36% K+. For normal diet, the gel diet was supplemented with NaCl to a final level of 0.49%. Gel diet was replenished daily, and water was provided ad libitum. For dietary K+ restriction, a potassium‐deficient diet (Harlan Laboratories, TD.88239) was used with approximate content: 15–30 p.p.m. K+, 0.3% Na+ and 0.45% Cl−. Dietary potassium restriction was performed for 7 days.
Metabolic cage studies
Animals were acclimated to metabolic cages (Hatteras Instruments, Cary, NC, USA) for 2 days prior to urine collection. Animals were fed a normal gel diet as described above, and urine was collected under water‐saturated light mineral oil. Urine Na+ and K+ contents were determined by flame photometry. Urinary calcium was measured by the o‐Cresolphthalein Complexone method (Pointe Scientific, Canton, MI, USA) on samples diluted 1:2.
Blood analysis
Blood was collected via cardiac puncture under isoflurane anaesthesia and transferred into heparinized tubes; 80 μl was loaded into a Chem8+ cartridge for electrolyte measurement in an i‐STAT analyser (Abbot Point of Care Inc., Princeton, NJ, USA). The remainder was centrifuged at 2000 g for 5 min at room temperature, and plasma was removed and stored at −20°C. Plasma aldosterone was measured by ELISA (IBL‐America, Minneapolis, MN, USA). Plasma renin activity (PRA), a surrogate for plasma angiotensin II levels, was determined as previously described, by incubating 2 μl of plasma with angiotensinogen, and then measuring angiotensin I generated by ELISA (Phoenix Pharmaceuticals, Burlingame, CA, USA) (McCormick et al. 2011).
Amiloride response test
Animals were first injected intraperitoneally with vehicle (0.09% saline), then placed in metabolic cages for 6 h for urine collection. The next day, the same animals were injected with 40 μg 25 g−1 body weight amiloride hydrochloride in vehicle, followed by a 6 h urine collection. Urine sodium was determined by flame photometry.
Quantitative phosphoproteomics
Medulla‐enriched kidney samples were prepared by crudely dissecting cortex and medulla from left and right kidneys. Both samples from the same mouse were combined and homogenized in 400 μl lysis buffer, as described above for Western blotting. Protein was extracted from clarified lysates using methanol/chloroform precipitation as described by Wessel & Flugge (1984), washed with methanol and vacuum dried. Then, 2–4 mg of protein was solubilized in a solution containing 2.5% ALS‐110 (Protea, Crewe, UK), 50 mm Tris‐HCl, pH 8.5, 5 mm EDTA and 50 mm dithiothrietol. Samples were subjected to sonication on a pedestal sonicator (55 A, 30 s on, 30 s off, 4 min total) and then diluted to 0.83% ALS‐110 in 100 mm Tris‐HCl, pH 8.5. Cysteines were then reduced by incubation at 55°C for 35 min and alkylated with iodoacetamide at room temperature for 30 min in the dark. After quenching with excess dithiothrietol, samples were digested with LysC (Wako, Richmond, VA, USA) at a 1:100 enzyme to protein mass ratio for 4 h at 37°C. The solution was then further diluted to 0.05% ALS‐110 in ∼100 mm Tris‐HCl, pH 8.5, and ∼5 mm CaCl2 and digested with trypsin (Promega, Madison, WI, USA) at a 1:50 enzyme to protein mass ratio for 16 h at 37°C. ALS‐110 was cleaved by adding 20% trifluoroacetic acid (TFA) (pH <3 .0) and incubated at room temperature for 15 min. Samples were desalted with SepPak Classic SPE cartridges (Waters, Milford, MA, USA) according to the manufacturer's instructions and lyophilized. Lyophilized samples were resuspended in 100 μl 50% acetonitrile (ACN) 0.1% TFA. Protein concentration was measured via A 280 absorbance readings on a Nanodrop 2000 (Thermo, Waltham, MA, USA). One milligram of peptides for each sample was labelled with dimethyl in triethylammonium bicarbonate buffer with NaCH3CN and either light (CH2O) or heavy (CD2O) label (Boersema et al. 2009). Samples generated from two different SPAK/OSR1 DKO kidneys were labelled with light (CH2O) dimethyl reagents and two samples from separate SPAK‐KO kidneys were labelled with heavy (CD2O) reagents and then combined in 1:1 ratios to generate two different samples for biological replicate proteome comparisons. Mixed samples were then desalted with SepPak Classic SPE cartridges and lyophilized. Peptides were resuspended in 133 μl 50% ACN 0.1% TFA and quantified by A 280. Then, 850–950 μg of dried, labelled peptide samples was enriched for phosphopeptides using Titansphere TiO2 (GL Sciences, Tokyo, Japan) as previously described (Kettenbach & Gerber, 2011). Briefly, dried peptides were combined with TiO2 in a 1:4 peptide/TiO2 mass ratio in 50% ACN 2 m lactic acid and peptides were eluted sequentially with 0.2 m sodium phosphate, pH 7.8, twice with 5% NH4OH, and once with 5% pyrrolidine. Eluates were combined and quenched with 70% formic acid (FA). C18 Microspin Columns (The Nest Group, Southborough, MA, USA) were then used to desalt samples prior to LC‐MS/MS analysis. One hundred micrograms of dried unenriched dimethyl‐labelled peptides was resuspended in 85% ACN 0.1% FA. The sample was loaded onto a PolyWAX LP column (150×1 .0 mm, 5 mg particle diameter, 300 Å pore, PolyLC, Columbia, MD, USA) using 50 μl min–1 (split flow) on an Agilent 1100 series HPLC device. A non‐linear gradient was used to separate peptides, adapted from Hao et al. (2013). A 70 min method with a gradient from 85% ACN 0.1% FA to 30% ACN 0.1% FA was used with 35 fractions collected as follows: 30 s fractions from 2 to 12 min, 1 min fractions from 12 to 17 min, and then further increased time intervals for each subsequent fraction. Samples were dried under vacuum and reconstituted for LC‐MS/MS analysis. ERLIC fractions were analysed by LC‐MS/MS using a nanoAcquity UPLC device (Waters) and an LTQ Orbitrap Velos mass spectrometer (Thermo). Using a vented split configuration with a 150 μm × 30 mm trap column packed with 3 μm diameter ReproSil‐Pur 120Å C18‐AQ resin (Dr. Maisch, Ammerbuch, Germany) and a 75 μm × 20 cm PicoFrit analytical column (New Objective, Woburn, MA, USA) packed with 1.9 μm ReproSil‐Pur 120Å C18‐AQ resin (Dr. Maisch), peptides were separated on a 90 min non‐linear gradient from 2% ACN 0.1% FA to 95% ACN 0.1% FA (MS: 30,000 resolution, 298–1750 m z−1 scan range; dd‐MS2: top10 method, 7500 resolution, 1.0 m z−1 isolation window, 35 NCE). Unfractionated unenriched samples (2 μg peptides) and TiO2‐enriched samples were analysed using an EASY‐nLC 1000 UPLC device (Thermo) and a Q Exactive Plus (Thermo) with a 75 μm × 50 cm PicoFrit column packed with 1.9 μm ReproSil‐Pur 120Å C18‐AQ resin in a one‐column arrangement. Peptides were separated on the column using a 290 min non‐linear gradient from 1% mobile phase B to 99% mobile phase B (mobile phase A: 1% ACN 0.1% FA in water, mobile phase B: 80% ACN 0.1% FA in water); MS: 70,000 resolution, 3e6 AGC target, 300–1700 m z−1 scan range; dd‐MS2: top10 method, 17,500 resolution, 1e6 AGC target, 10 loop count, 1.6 m z−1 isolation window, 27 NCE). MaxQuant v.1.5.1.2 (Cox & Mann, 2008) was used to search MS data with carbamidomethyl (C) as a fixed modification and acetyl (N‐terminal), deamidation (NQ), oxidation (M) and phospho (STY) as variable modifications, ≤ 3 missed cleavages, ≥ 5 amino acid length and 1% false discovery rate. MaxQuant search results were further processed in Perseus v.1.5.0.31.
22Na+ uptake assays
Functional expression of wild type and mutant NCC was assessed in the heterologous expression system of Xenopus laevis oocytes. Usage of X. laevis was approved by the Universidad Nacional Autónoma de México Animal Care and Usage Committee. Oocytes were extracted from female Xenopus frogs (three in total were used) and processed as previously described (Monroy et al. 2000). Oocytes were injected with wild type or mutant T122D, S124D or T122D/S124D mouse NCC cRNA and 48 h later 22Na+ uptake was assessed in control conditions or after 16 h of low chloride hypotonic stress, which is known to activate the cotransporter via WNK‐SPAK phosphorylation of the amino terminal threonines 53 and 58, as previously described (Pacheco‐Alvarez et al. 2006; Bazua‐Valenti et al. 2015). Single or double point mutants were made using the QuikChange Lightning mutagenesis kit (Agilent Technologies, Santa Clara, CA, USA), following the manufacturer's protocol.
Statistics
Analyses of plasma renin activity in SPAK‐KO and DKO mice on both normal and Na+‐deficient diets, and responses of KS‐OSR1‐KO and control mice, and SPAK‐KO and DKO mice to K+‐deficient diets were done by two‐way ANOVA with Tukey post hoc test, using GraphPad Prism 6.05; unpaired t tests and one‐way ANOVA were used for other analyses. All values are expressed as means ± standard error of the mean. For all analyses, P < 0.05 was considered to be significant. Note that for both one‐way and two‐way ANOVAs, multiplicity adjusted P values (corrected for multiple comparisons) are reported to provide support for the strength of the differences detected. Comparisons of slopes (determined by Pearson's correlation) for pNCC versus plasma [K+] plots were performed using an online tool (https://www.statstodo.com/Comp2Regs_Pgm.php).
Results
Combined disruption of SPAK and OSR1, and cloning of a truncated OSR1 isoform
As the mice studied are SPAK−/−/OSR1flox/flox/Pax8‐rtTA+/Cre+, direct comparisons with WT mice were not practical, so most comparisons were made between SPAK−/−/OSR1flox/flox/Pax8‐rtTA+/Cre+ treated with vehicle, or with doxycycline to induce OSR1 disruption. As mice lacking SPAK and OSR1 individually have been previously characterized, valid conclusions can be made regarding the additive effects of disrupting both kinases. Western blotting showed that SPAK was absent from SPAK‐KO and DKO mice (Fig. 1 A). Abundances of both full‐length OSR1 and a shorter form of OSR1 (S‐OSR1) were significantly lower in DKO mice, but not completely absent (Fig. 1 B and C). While not technically correct, we refer to these mice throughout as double knockouts for simplicity, as is commonly done for incomplete knockout (e.g. Tiwari et al. 2008; Faresse et al. 2012); the localization of residual OSR1 expression is discussed later (see Fig. 3 C below). Truncated isoforms of SPAK have been identified (McCormick et al. 2011) which inhibit the activities of NKCC1 and NKCC2 (Grimm et al. 2012; Park et al. 2013). These truncated forms may arise from alternative translation starts or promoters (McCormick et al. 2011), or as a result of proteolytic cleavage of full‐length SPAK (Markadieu et al. 2014). We performed 5′RACE PCR using a primer to exon 11 of OSR1 and identified a transcript which lacks exons 1–4, and instead contains a novel first exon (4A), joined to exon 5 (Fig. 1 D). This novel exon shares no homology with exon 5A of KS‐SPAK, but the first in‐frame START codon is homologous to that of KS‐SPAK. The 3′ end of exon 4A is located 3.4 kb upstream of exon 5 in intron 4–5, showing it is derived from mRNA and not from genomic DNA. RT‐PCR using total RNA from mouse brain and kidney suggests that this transcript may display tissue‐specific expression. While cleavage of full‐length SPAK to generate truncated SPAK isoforms by the peptidase DNPEP has been reported, this was not observed for OSR1 (Markadieu et al. 2014), suggesting S‐OSR1 is only generated by alternative promoter usage.
Figure 1. Disruption of SPAK/OSR1 and cloning of a truncated isoform of OSR1 .
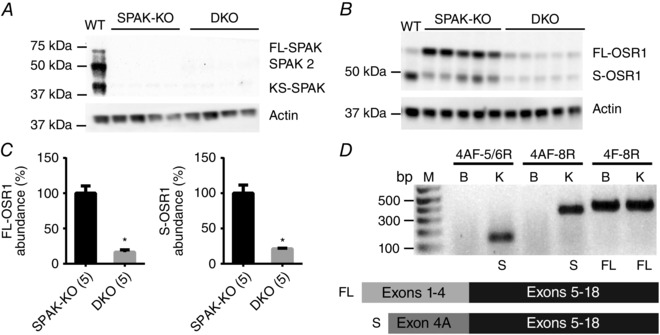
A, Western blot analysis of whole kidney lysates confirmed the absence of SPAK in SPAK knockout (SPAK‐KO) and SPAK/OSR1 double knockout (DKO) mice. B, Western blots showed a significant reduction in abundance of FL‐OSR1 and a short form of OSR1 (S‐OSR1) in SPAK/OSR1 DKO mice. C, quantification of FL‐OSR1 and S‐OSR1 abundance using blot in B. Densitometry values were normalized to actin and plotted as means ± SEM. FL‐OSR1: SPAK‐KO 100±10%, DKO 16±3%; * P = 6×10⁻⁵. S‐OSR1: SPAK‐KO: 100±12% and DKO: 21±1%; * P = 0.0001, unpaired t‐tests. D, 5′RACE PCR using a primer to exon 11 of OSR1 identified a transcript which lacks exons 1–4, and instead contains a novel first exon (4A), joined to exon 5 (see cartoon). This novel exon shares no homology with exon 5A of KS‐SPAK. RT‐PCR using total RNA from mouse brain and kidney revealed that this transcript may display tissue‐specific expression, as it is absent from brain. Numbers above bars indicate primer pairs used (see Methods). M, DNA ladder; bp, base pairs; B, brain; K, kidney; S, S‐OSR1 amplicon present; FL, FL‐OSR1 amplicon present.
SPAK/OSR1 DKO mice display reduced blood pressure and volume contraction
We hypothesized that DKO mice would lead to polyuria and salt‐wasting (leading to severe hypotension) as well as other electrolyte derangements (e.g. hypercalciuria, hypomagnesaemia and severe hypokalaemia), due to impaired activation of both NCC and NKCC2. On a normal salt diet, DKO mice had significantly lower systolic blood pressure than SPAK‐KO mice (Fig. 2 A). On a normal diet, plasma [K+] was significantly lower in DKO mice than in SPAK‐KO mice, but plasma [Na+], [Mg2+], [Cl−], [HCO3 −], blood urea nitrogen (BUN), haematocrit and aldosterone did not differ (Table 1). Following dietary sodium restriction, in addition to lower plasma [K+] than SPAK‐KO mice, DKO mice had elevated BUN and haematocrit, suggesting mild volume contraction (Table 2). Urinary Na+, K+ and Ca2+ excretion did not differ at baseline or following dietary sodium restriction, except for a small difference in Na+ excretion after 2 days of sodium restriction (Fig. 2 B–D), indicating that overall SPAK‐KO and DKO mice were in similar electrolyte balance. The absence of decreased K+ excretion in DKO at basal state while plasma [K+] is lower suggests that K+ loss is of renal origin. Despite the greater difference in plasma [K+] following dietary sodium restriction, we did not detect enhanced urinary K+ excretion in DKO mice over the time course of the experiment (Fig. 2 C), possibly because our assay could not detect small differences in urinary K+. Twenty‐four hour urine volume did also not differ, either on a normal diet or following dietary sodium restriction (Fig. 2 E). Plasma renin activity did not differ significantly on either normal diet or following dietary sodium restriction, but DKO mice appeared to display a greater increase in response to sodium restriction (Fig. 2 F).
Figure 2. Effects of combined disruption of SPAK/OSR1 on blood pressure, electrolyte excretion, and plasma renin activity .
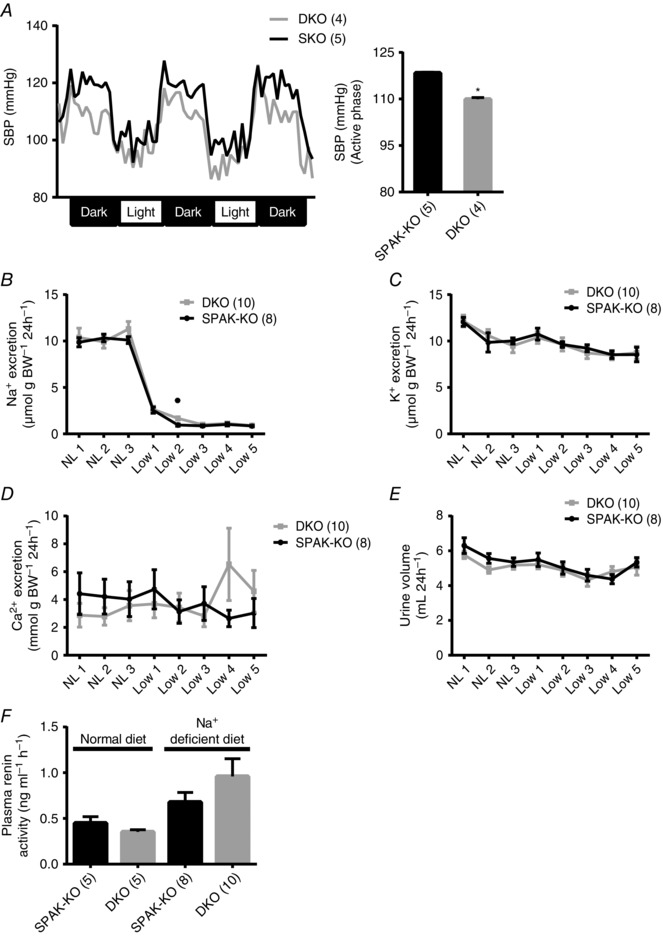
A, radiotelemetry showed reduced systolic blood pressure in SPAK/OSR1 double knockout (DKO) mice. Left, tracing using 1 h average values; right, mean of the hourly averages over three dark periods ± SEM; * P = 0.001, unpaired t‐test. B–E, there were no differences in 24 h urinary excretion of (B) sodium (Na+), (C) potassium (K+) or (D) calcium (Ca2+) on a normal sodium (0.49%) diet (NL 1 to NL 3) or following 5 days of dietary sodium (0.02%) restriction (Low 1 to Low 5) between SPAK knockout (SPAK‐KO) and DKO mice with the exception of a small difference in Na+ excretion after 2 days of sodium restriction (Low 2); * P = 0.005, unpaired t‐test. E, urine volumes did not show a significant difference. F, plasma renin activity (PRA), determined by measurement of angiotensin I following incubation of plasma with angiotensinogen, showed no difference between genotypes by two‐way ANOVA. For A–F, values are means ± SEM.
Table 1.
Blood electrolyte analysis on normal diet
| SPAK‐KO (n = 11) | DKO (n = 14) | ||||
|---|---|---|---|---|---|
| Mean | SEM | Mean | SEM | P | |
| Na+ (mmol l–1) | 148.4 | 0.7 | 149.0 | 1.0 | 0.63 |
| K+ (mmol l–1) | 3.71 | 0.12 | 3.35 | 0.11 | 0.05 |
| Cl− (mmol l–1) | 111.5 | 0.4 | 110.6 | 0.6 | 0.18 |
| Ca2+ (mmol l–1) | 1.26 | 0.01 | 1.26 | 0.01 | 0.88 |
| Mg2+ (mmol l–1) | 2.10 | 0.07 | 1.86 | 0.10 | 0.09 |
| Aldosterone (pg ml–1) | 130 | 26 | 110 | 25 | 0.60 |
| tCO2 (mmol l–1) | 23.3 | 0.8 | 24.7 | 0.5 | 0.15 |
| BUN (mg dl–1) | 30.8 | 1.0 | 30.2 | 1.2 | 0.70 |
| Haematocrit (%) | 39.0 | 0.6 | 39.8 | 0.4 | 0.29 |
Significant P values in bold type.
Table 2.
Blood electrolyte analysis on Na+‐deficient diet
| SPAK‐KO (n = 7) | DKO (n = 10) | ||||
|---|---|---|---|---|---|
| Mean | SEM | Mean | SEM | P | |
| Na+ (mmol l–1) | 146.7 | 0.6 | 145.7 | 0.7 | 0.31 |
| K+ (mmol l–1) | 3.44 | 0.09 | 2.83 | 0.05 | <0.001 |
| Cl− (mmol l–1) | 109.4 | 0.9 | 108.1 | 0.9 | 0.31 |
| Ca2+ (mmol l–1) | 1.25 | 0.03 | 1.25 | 0.03 | 0.94 |
| Mg2+ (mmol l–1) | 2.11 | 0.15 | 2.39 | 0.17 | 0.15 |
| Aldosterone (pg ml–1) | 283 | 29 | 228 | 19 | 0.13 |
| tCO2 (mmol l–1) | 24.0 | 1.2 | 25.1 | 0.8 | 0.42 |
| BUN (mg dl–1) | 26.4 | 1.4 | 36.3 | 1.6 | <0.01 |
| Haematocrit (%) | 43.3 | 0.9 | 45.2 | 0.4 | 0.05 |
Significant P values in bold type.
Abundant pNKCC2 remains in the medulla despite an absence of SPAK and OSR1
We next determined the abundance of both total NKCC2 and NCC, and the degree of phosphorylation at the SPAK/OSR1 phosphorylation sites p‐T96/T101 for NKCC2 (pNKCC2) and p‐T53 for NCC (pNCC). As previously reported (Yang et al. 2010; McCormick et al. 2011; Grimm et al. 2012), pNKCC2 abundance was dramatically elevated in SPAK‐KO compared with WT mice (Fig. 3 A), and was also greater in SPAK‐KO mice than in DKO mice. While pNKCC2 abundance was significantly lower in DKO mice than in SPAK‐KO mice, it was still significantly greater than in WT mice. Total NKCC2 (tNKCC2) did not differ between genotypes (Fig. 3 B). As Western blotting indicated residual OSR1 expression in DKO mice (Fig. 1 B and C), which may account for the significant levels of pNKCC2 we observed in these mice, we performed immunofluorescence for both OSR1 and pNKCC2. In SPAK‐KO mice (Fig. 3 C), cortical OSR1 displayed a punctate/apical distribution in some cells (previously shown to be the DCT), and a purely apical distribution in others (previously shown to be the TAL) (Grimm et al. 2012; Saritas et al. 2013). In the medulla, OSR1 was expressed widely in SPAK‐KO mice. In DKO mice, residual OSR1 expression was present in the cortex and was found at a similar distribution to OSR1 in SPAK‐KO mice (a mixture of punctate/apical and purely apical), but was completely absent from the medulla of DKO mice. Immunofluorescence revealed the presence of pNKCC2 in both the cortex and the medulla. Thus, while residual OSR1 may be responsible for phosphorylation of NKCC2 at T96/T101 in the cortex, both SPAK and OSR1 are completely absent in the medulla. These data suggest the existence of another kinase that phosphorylates these sites.
Another possible explanation for the high levels of pNKCC2 we detect is that our pNKCC2 antibody is not specific, and cross‐reacts with phosphorylated NCC and/or NKCC1. The former is unlikely because pNKCC2 abundance was greater than in WT mice, despite an almost complete lack of total NCC in DKO mice (see below). In the renal epithelium, NKCC1 expression is restricted to the papilla and the termini of the inner medullary collecting duct, where it is expressed exclusively along the basolateral membrane (Kaplan et al. 1996). Immunofluorescence for pNKCC2 clearly showed an absence of signal in the papilla in SPAK‐KO mice (Fig. 3 C, inset), and the signal in the inner medulla was exclusively restricted to the apical membrane (of presumably the TAL). These data are consistent with our previous findings using the same antibody, which showed a large increase in pNKCC2 abundance in SPAK‐KO mice by both Western blotting and immunostaining (McCormick et al. 2011), and confirm that our pNKCC2 antibody does not detect pNKCC1.
As SPAK‐KO mice display approximately 90% less total and pNCC compared with WT mice (see Fig. 3 D, right) (McCormick et al. 2011), longer exposures were performed to identify differences in total and pNCC. DKO mice displayed significantly lower pNCC abundance (Fig. 3 D), but total NCC (tNCC) did not differ (Fig. 3 D). pNCC/tNCC was lower in DKO mice (Fig. 3 E), confirming an effect of combined SPAK/OSR1 deletion on phosphorylation and not simply on tNCC expression. The presence of residual OSR1 expression in the cortex (Fig. 3 C) may account for our observation that pNCC is not completely absent in DKO mice. Following dietary sodium restriction, pNCC abundance remained lower in DKO mice, with no difference in tNCC (data not shown).
Compensatory changes in NKCC2 and NCC phosphorylation in SPAK/OSR1 DKO mice
Both NKCC2 and NCC can be phosphorylated at several residues by SPAK/OSR1‐independent pathways (Fig. 4 A) (Fraser et al. 2007; Richardson et al. 2008, 2011; Huttlin et al. 2010; Feric et al. 2011; Lundby et al. 2012). To identify compensatory phosphorylation of NKCC2 and NCC by SPAK/OSR1‐independent pathways in DKO mice in an unbiased manner, we performed quantitative phosphoproteomics using medulla‐enriched samples from SPAK‐KO and DKO mice on a normal diet. While we selected medulla‐enriched preparations to reduce signal from proximal tubule, a significant quantity of cortex was still present, as we detected NCC. Both tNCC and tNKCC2 were modestly elevated in DKO mice in this analysis (Fig. 4 B). We found significant differences in the abundances of several NCC and NKCC2 phosphopeptides, which have all been previously identified (Fig. 4 A). Abundances of p‐S57 and p‐S126 NKCC2 were lower in DKO mice (Fig. 4 C). For NCC, p‐T122 and p‐T122/p‐S124 abundances were significantly higher in DKO mice, and p‐S89 abundance was higher in the pair of mice in which it was detected (Fig. 4 B).
Figure 4. Compensatory activation of NCC in SPAK/OSR1 double knockout mice .
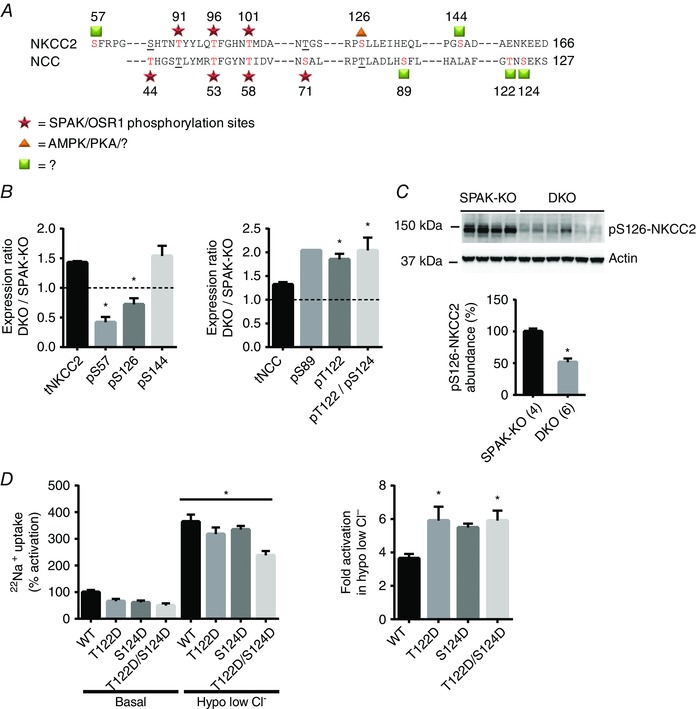
A, schematic indicating amino‐terminal phosphorylation sites in mouse NKCC2 and NCC. Red text indicates a confirmed phosphorylation site for that particular cotransporter, while underlining represents a site that could be, but has not shown to be, phosphorylated in the other cotransporter. Well‐established SPAK/OSR1 sites are marked by stars. Both AMPK and PKA phosphorylate NKCC2 at serine 126 (triangle) in vitro, but the kinase responsible in vivo has not been definitively determined. For sites marked with squares, in vitro data have not provided clear evidence of the responsible kinase. B, quantification of phosphoproteomic data obtained from SPAK knockout (SPAK‐KO) and SPAK/OSR1 double knockout (DKO) mice on a normal diet, with abundance expressed as the mean expression ratio (DKO/SPAK‐KO) ± SEM. Left, abundance of total and phosphorylated forms of NKCC2; right, the same for NCC. The dashed line represents the ratio at which expression is equal; values above this line represent greater abundance in DKO mice, while values below represent lower abundance in DKO mice. Note that phospho‐serine 89 peptides were only detected in a single replicate. For both NCC and NKCC2, * P < 0.0001, one‐way ANOVA comparing each phosphopeptide with total cotransporter abundance. C, Western blot analysis confirmed lower abundance pS126‐NKCC2 in DKO mice than in SPAK‐KO mice, quantified below; densitometry values were normalized to actin and are means ± SEM. * P = 0.0003, unpaired t‐test. D, 22Na+ uptake assays in Xenopus oocytes suggest T122 and S124 may act synergistically with SPAK/OSR1 sites. Left, representative assay shows activities of WT NCC and phosphomimetic mutants (with either one or both sites mutated to aspartic acid, D) in ND96 (Basal), and in hypotonic low chloride conditions (Hypo low Cl−), which leads to phosphorylation at SPAK/OSR1‐dependent sites. Activities are shown relative to WT NCC in basal conditions ± SEM. All mutants tended to lower basal activity compared with WT NCC, but one‐way ANOVA did not reveal a significant difference. WT NCC and all mutants displayed increased activity in hypotonic low chloride conditions (* P < 0.0001). Right, fold activation of WT or mutant NCC in hypotonic low chloride conditions (calculated using data in the left panel), which is significantly higher in T122D and T122D/S124D NCC (* P = 0.02), and trended to higher in S124D NCC (P = 0.07). One‐way ANOVAs were performed and multiplicity adjusted P values are reported.
To confirm these changes, we performed Western blotting. Abundance of p‐S126 NKCC2 was lower in DKO mice, consistent with the phosphoproteomic data (Fig. 4 C). Abundance of pS126‐pNKCC2 did not differ between SPAK‐KO and DKO following dietary sodium restriction (data not shown), suggesting a possible compensatory response. Phosphorylation of NKCC2 at S126 is SPAK/OSR1‐independent, and also determines cotransporter activity (Fraser et al. 2007; Richardson et al. 2011). The kinase responsible for S126 phosphorylation has been proposed to be either 5′ adenosine monophosphate‐activated protein kinase (AMPK) (Fraser et al. 2007; Gunaratne et al. 2010; Richardson et al. 2011) or protein kinase A (PKA) (Gunaratne et al. 2010; Rieg et al. 2013), but a definitive identification is lacking. We did not find any difference in abundance of phospho‐AMPK between SPAK‐KO and DKO mice (data not shown). In contrast to a previous report (Grimm et al. 2012), we also did not find any difference in the level of phospho‐AMPK expression between cortex and medulla between WT and SPAK‐KO mice, despite using the same antibody, and finding greater abundance of pS126‐NKCC2 in SPAK‐KO mice (data not shown). There was also no significant difference in phospho‐PKA abundance between SPAK‐KO and DKO mice (data not shown). While we could detect pS89 NCC in WT mice, the poor sensitivity of the antibody (Sorensen et al. 2013) did not allow us to quantify its abundance in SPAK‐KO and DKO mice (data not shown). Immunoblotting with an antibody raised against pS124 (Rosenbaek et al. 2012) was unsuccessful, possibly due to sequence differences between mouse and the rat‐derived antigen.
Phosphorylation of NCC at T122 might compensate for reduced SPAK/OSR1‐dependent phosphorylation, but in contrast to S124 (Rosenbaek et al. 2012) and S89 (Richardson et al. 2008), the functional significance of phosphorylation at this site, or of double T122/S124 phosphorylation, have not been tested previously, so we performed 22Na+ uptake assays in Xenopus oocytes. We confirmed the previously reported observation that the mutant S124A NCC displays slightly reduced activity (Rosenbaek et al. 2012), and obtained similar results with T122A; responses to low chloride hypotonic stress were similar to WT NCC (data not shown). Phosphomimetic T122D and S124D mutants showed similar activity to WT NCC at baseline (Fig. 4 D, left), but low chloride hypotonic stress (Bazua‐Valenti et al. 2015) caused a greater fold activation than was seen for WT NCC (Fig. 4 D, right). Activation of NCC is due to phosphorylation of T53, T58 and probably S71 under these conditions (Pacheco‐Alvarez et al. 2006; Richardson et al. 2008), and because phosphorylation of T122 and T124 further enhanced NCC activation, there may be synergy of the activating kinases.
Compensatory mechanisms along the collecting duct in SPAK/OSR1 DKO mice
Western blotting for other potential compensatory sodium reabsorptive pathways, expressed along the cortical collecting duct, revealed inconsistent differences in the abundances of the three subunits of the epithelial sodium channel (ENaC). Alpha was unchanged, beta trended towards higher, full‐length gamma trended to lower and the cleaved gamma N‐terminal fragment was significantly lower in DKO mice (suggesting reduced abundance of the active form of gamma ENaC) (Fig. 5 A–C). Therefore, to determine whether these changes in subunit abundance translated into altered ENaC activity, we performed an amiloride response test. Blockade of ENaC with amiloride induced a natriuresis in both SPAK‐KO and DKO mice, but the degree was significantly greater in DKO mice (Fig. 5 D). We next confirmed a recent report (Grimm et al. 2015) that abundance of pendrin, which can compensate for disruption of NCC (Soleimani et al. 2012), is increased in SPAK‐KO mice compared with WT mice (data not shown); however, abundance was lower in DKO mice compared with SPAK‐KO mice (Fig. 5 E). Abundance of the Na+‐dependent Cl−/HCO3− exchanger (NDCBE), which can act in concert with pendrin to perform electroneutral thiazide‐sensitive NaCl reabsorption along the cortical collecting duct (Leviel et al. 2010; Eladari et al. 2014), was significantly greater in DKO mice (Fig. 5 F).
Figure 5. Compensatory changes in sodium transport pathways along the collecting duct .
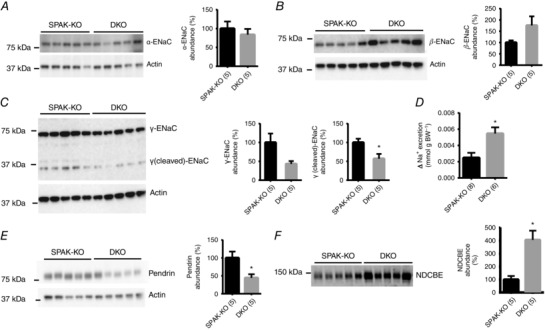
A, Western blot analysis of whole kidney lysates from SPAK knockout (SPAK‐KO) and SPAK/OSR1 double knockout (DKO) mice on a normal diet revealed no difference in the abundance of α‐ENaC. Right‐hand panels in A–C show graphs of quantification, with densitometry values normalized to actin; values are means ± SEM. B, abundance of β‐ENaC trended higher in DKO mice, but the difference was not significant (P = 0.10). C, abundance of γ‐ENaC trended lower (P = 0.05), and abundance of the cleaved γ‐ENaC N‐terminal fragment was significantly lower in DKO mice (* P = 0.02). D, to determine whether changes in ENaC subunit abundance translated into changes in ENaC activity, a 6 h urine collection was performed before and after injection of vehicle (0.09% saline) or 40 μg 25g−1 body weight amiloride. Urine sodium (Na+) was determined by flame photometry and the difference in excretion following injection of vehicle or amiloride was calculated. Values are means ± SEM. Sodium excretion increased to a greater degree in DKO mice (* P = 0.009), suggesting increased ENaC activity. E, abundance of pendrin was significantly lower in DKO mice than in SPAK‐KO mice, as shown by quantification to the right, with densitometry values normalized to actin and shown as means ± SEM (* P = 0.03). F, abundance of NDCBE was significantly elevated in DKO mice (* P = 0.004). For quantification, values were normalized to Coomassie blue staining and shown as means ± SEM. For A–F, numbers in parentheses indicate n. All comparisons were made using unpaired t‐tests.
Disruption of SPAK and OSR1 reveals their central role in potassium homeostasis
It has recently been proposed that the DCT plays a central role in potassium homeostasis by acting as a sensor of plasma [K+] (Terker et al. 2015 and 2016). A low K+, diet increases phosphorylation of NCC (Vallon et al. 2009; Castaneda‐Bueno et al. 2014; Terker et al. 2015 and 2016); both SPAK and OSR1 have been implicated in this process (Castaneda‐Bueno et al. 2014; Terker et al. 2015; Wade et al. 2015). Wade et al. (2015) reported that SPAK‐KO mice display a blunted increase in pNCC abundance in response to dietary K+ restriction, and proposed that another kinase (e.g. OSR1) may also be involved. We therefore examined the effects of dietary K+ restriction in SPAK/OSR1 DKO mice. Plasma [K+] was dramatically lower in DKO mice (Table 3); consistent with this, DKO mice displayed lower plasma [Cl−] and higher plasma [HCO3 −] (Table 3).
Table 3.
Blood electrolyte analysis on K+‐deficient diet
| SPAK‐KO (n = 9) | DKO (n = 9) | ||||
|---|---|---|---|---|---|
| Mean | SEM | Mean | SEM | P | |
| Na+ (mmol l–1) | 145.7 | 0.4 | 146.6 | 0.4 | 0.16 |
| K+ (mmol l–1) | 3.11 | 0.09 | 2.08 | 0.06 | <0.001 |
| Cl− (mmol l–1) | 108.0 | 0.6 | 102.1 | 1.3 | <0.01 |
| Ca2+ (mmol l–1) | 1.28 | 0.02 | 1.25 | 0.03 | 0.52 |
| Mg2+ (mmol l–1) | 3.72 | 0.54 | 3.58 | 0.33 | 0.83 |
| tCO2 (mmol l–1) | 21.8 | 0.6 | 27.4 | 0.9 | <0.001 |
| BUN (mg dl–1) | 28.4 | 2.3 | 26.0 | 1.8 | 0.43 |
| Haematocrit (%) | 39.9 | 1.4 | 37.2 | 1.0 | 0.17 |
Significant P values in bold type.
A previously reported non‐inducible kidney‐specific OSR1‐KO displayed mild hypokalaemia at baseline, with a slight exacerbation following dietary K+ restriction (Lin et al. 2011). To rule out the possibility that OSR1 disruption alone was sufficient to lead to the dramatic reduction in plasma [K+] in our model, we K+‐restricted our inducible kidney‐specific OSR1‐KO (KS‐OSR1‐KO) mice. Plasma [K+] did not differ at baseline, but was mildly but significantly lower in KS‐OSR1‐KO mice following K+ restriction, with lower plasma [Cl−] and higher plasma [HCO3 −] (Table 4). The plasma [K+] we observed at this level of dietary K+ in WT mice was consistent with that seen in a recent study (Terker et al. 2016). Thus, while plasma [K+] differed significantly between WT and OSR1‐KO mice following dietary K+ restriction, the difference was relatively small, and the levels in OSR1‐KO mice did not drop to those seen in DKO mice. KS‐OSR1‐KO mice still display increased pNCC abundance following K+ restriction (Fig. 6 A; and Terker et al. 2015). We next compared the ability of SPAK‐KO and DKO mice to induce NCC phosphorylation in response to dietary K+ restriction. As previously reported (Terker et al. 2015; Wade et al. 2015), pNCC abundance increased in SPAK‐KO mice (Fig. 6 B). In contrast, DKO mice displayed an inability to induce NCC phosphorylation in response to this challenge (Fig. 6 B).
Table 4.
Blood electrolyte analysis of KS‐OSR1‐KO on normal or K+‐deficient diet
| Normal diet | K+‐deficient diet | |||||||||
|---|---|---|---|---|---|---|---|---|---|---|
| Control (n = 5) | OSR1‐KO (n = 5) | Control (n = 5) | OSR1‐KO (n = 7) | |||||||
| Mean | SEM | Mean | SEM | P | Mean | SEM | Mean | SEM | P | |
| Na+ (mmol l–1) | 148.0 | 0.5 | 146.2 | 0.4 | 0.09 | 148.0 | 0.3 | 147.0 | 0.9 | 0.43 |
| K+ (mmol l–1) | 4.22 | 0.14 | 4.26 | 0.09 | 0.87 | 2.78 | 0.06 | 2.56 | 0.05 | 0.05 |
| Cl− (mmol l–1) | 113.0 | 0.7 | 111.8 | 0.7 | 0.40 | 111.0 | 0.6 | 106.1 | 0.7 | <0.01 |
| Ca2+ (mmol l–1) | 1.29 | 0.01 | 1.28 | 0.01 | 0.45 | 1.23 | 0.01 | 1.20 | 0.01 | 0.11 |
| tCO2 (mmol l–1) | 19.2 | 0.7 | 20.2 | 0.5 | 0.43 | 20.0 | 0.9 | 23.6 | 0.3 | <0.01 |
| BUN (mg dl–1) | 18.6 | 1.0 | 22.0 | 0.7 | 0.08 | 23.2 | 0.6 | 23.9 | 1.1 | 0.73 |
| Haematocrit (%) | 38.4 | 0.2 | 39.6 | 1.0 | 0.45 | 40.2 | 0.6 | 40.7 | 0.6 | 0.67 |
Significant P values in bold type.
Figure 6. Effects of dietary potassium restriction on abundances of total and phosphorylated forms of NCC .
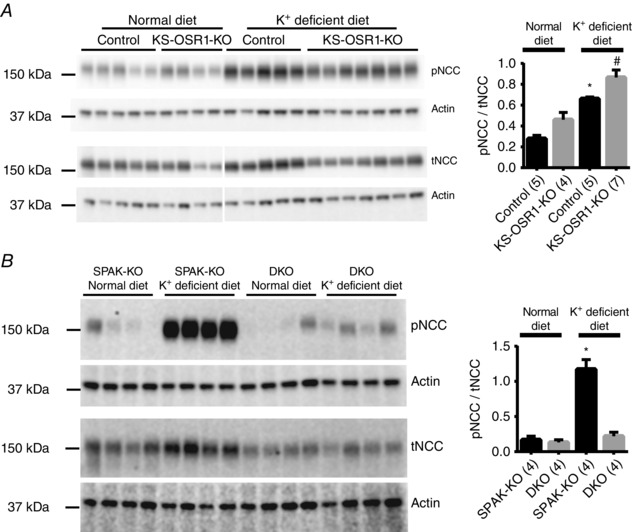
A, similar to control mice (OSR1fl/fl/Pax8‐rtTA/LC1 administered vehicle, not doxycycline), inducible kidney‐specific OSR1 knockout (KS‐OSR1‐KO) mice displayed an increase in abundance of NCC phosphorylated at the SPAK/OSR1‐dependent site threonine 53 (pNCC) in response to 7 days of dietary potassium restriction (K+‐deficient diet). Values were normalized to actin, and the pNCC/tNCC ratio was calculated and plotted as means ± SEM (right). pNCC/tNCC following potassium restriction was greater than on normal diet; * P = 0.0014 for control and # P = 0.0008 for KS‐OSR1‐KO mice. B, SPAK‐KO mice displayed a robust increase in pNCC after being placed on a K+‐deficient diet, but DKO mice displayed an almost complete failure to respond. Values were normalized to actin, and the pNCC/tNCC ratio was calculated and plotted as means ± SEM (right). pNCC/tNCC following potassium restriction was greater than on normal diet in SPAK‐KO (* P < 0.0001), but not in DKO mice (P = 0.8692). For A and B, two‐way ANOVAs were performed and multiplicity adjusted P values are reported.
Data derived from WT mice under various conditions show an inverse linear relationship between pNCC and plasma [K+] (Terker et al. 2016). We therefore plotted pNCC abundance against the corresponding plasma [K+] value for SPAK‐KO and DKO mice on normal and low K+ diets (Fig. 7 A). On a normal diet, the line for DKO mice was shifted down, and its slope was flatter and differed significantly form that obtained for SPAK‐KO mice (SPAK‐KO, −0.742 vs. DKO, −0.194, P = 0.01), suggesting that NCC phosphorylation is less responsive to changes in plasma [K+] in DKO mice. However, because dietary potassium is abundant, plasma [K+] is not dramatically lower in DKO mice. Dietary K+ restriction shifted the lines for both SPAK‐KO and DKO mice to the left compared with the lines obtained on a normal diet. The line for DKO mice was more dramatically shifted, and had a positive slope that differed from that of SPAK‐KO mice on the same diet (SPAK‐KO, −0.291 vs. DKO, +0.828, P = 0.003). Despite a flatter line, SPAK‐KO mice maintained plasma [K+] at levels similar to those observed in WT mice on the same diet (Table 4). In DKO mice, the line was shifted extremely far to the left and its slope was positive, indicating an inability to respond to lower plasma [K+]. This analysis suggests that SPAK‐KO mice can still activate NCC sufficiently to maintain plasma [K+] despite a dramatic reduction in tNCC, but DKO mice cannot.
Figure 7. The inverse relationship between pNCC and plasma [K+] is absent in SPAK/OSR1 double knockout mice .
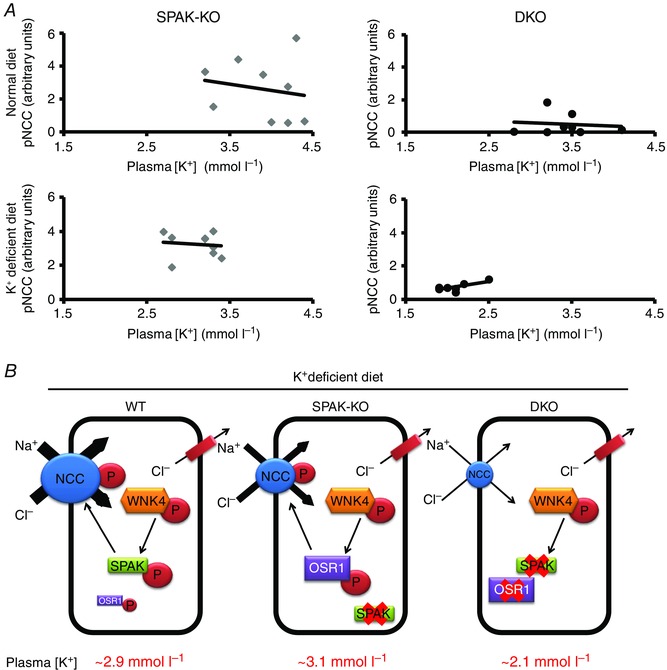
A, pNCC abundance and plasma [K+] display an inverse linear relationship (Terker et al. 2016), so we examined this relationship in SPAK knockout (SPAK‐KO) and SPAK/OSR1 double knockout (DKO) mice using Pearson's correlation. On a normal diet (top), both groups showed this relationship, but in DKO mice the line was shifted down and had a significantly flatter slope (comparison of slopes, SPAK‐KO = −0.742 and DKO = −0.194, P = 0.01). Dietary K+ restriction (bottom) shifted the lines for both SPAK‐KO and DKO mice to the left compared with the lines obtained on a normal diet. The line for DKO mice was more dramatically shifted, and had a positive slope whereas that for SPAK‐KO mice was still negative (comparison of slopes, SPAK‐KO = −0.291 and DKO = +0.828, P = 0.003). B, model depicting WNK4‐SPAK/OSR1‐NCC pathway activation following dietary K+ restriction in WT, SPAK knockout (SPAK‐KO) and SPAK/OSR1 knockout (DKO) mice. SPAK plays the dominant role in NCC phosphorylation in WT mice, as confirmed by maintenance of plasma [K+] and pNCC abundance in kidney‐specific OSR1 knockout mice (not shown for clarity). In SPAK‐KO mice, OSR1 can compensate for a lack of SPAK, preserving plasma [K+]. In DKO mice, plasma [K+] is dramatically lower, suggesting that other NCC‐activating pathways are unable to compensate during K+ restriction. In WNK4 and NCC knockout mice, potassium restriction causes plasma [K+] to fall to similar levels to those seen in DKO mice.
Discussion
The primary goal of our study was to test the hypothesis that SPAK and OSR1 can compensate for each other to maintain extracellular fluid volume. We predicted polyuria and a severe salt‐wasting phenotype due to reduced activity of both NKCC2 and NCC, but instead found that on a normal diet, SPAK/OSR1 DKO mice display only a moderately more severe phenotype than SPAK KO mice, with lower systolic blood pressure and lower plasma [K+]. Our major finding was that in contrast to SPAK and OSR1 single knockout mice, SPAK/OSR1 DKO mice display an inability to activate NCC in response to dietary K+ restriction, leading to profound hypokalaemia. The classic mechanism for renal K+ secretion is that K+ is secreted into the lumen of the connecting tubule and cortical collecting duct via ROMK (Kir1.1) and Ca2+‐activated big‐conductance K+ channels along a favourable electrochemical gradient created by Na+ absorption via ENaC (Wang, 1995; Palmer & Frindt, 2000; Giebisch et al. 2003; Pluznick & Sansom, 2006). Recent paradigm‐shifting discoveries suggest that the DCT, via NCC, plays a central role in K+ homeostasis (Sandberg et al. 2006; Vallon et al. 2009; Sorensen et al. 2013; van der Lubbe et al. 2013; Terker et al. 2015 and 2016). Abnormal NCC activity is responsible for causing hyperkalaemia or hypokalaemia, such as in familial hyperkalaemic hypertension (FHHt), caused by high NCC activity (Take et al. 1991; Lalioti et al. 2006; Yang et al. 2007), or in Gitelman syndrome, caused by loss‐of‐function of NCC (Simon et al. 1996). In this new model, a primary function of the DCT is to sense and respond to changes in plasma [K+] (Terker et al. 2015 and 2016). Decreased plasma [K+] is proposed to enhance Cl− exit via the basolateral K+–Cl− cotransporter 4 (KCC4) (Mount et al. 1999; Velazquez & Silva, 2003) and the chloride channel CLC‐K2 (Vitzthum et al. 2002; Lourdel et al. 2003). Activity of WNK kinases is inhibited by Cl− binding to specific residues (Piala et al. 2014; Terker et al. 2016), but WNK4 is particularly sensitive, with its activity modulated within the physiological range of intracellular Cl− to which the DCT is exposed (Terker et al. 2016). As plasma [K+] decreases, intracellular Cl− also decreases, which disinhibits WNK4, leading to SPAK/OSR1 phosphorylation, which then directly phosphorylate and activate NCC. This ultimately reduces distal Na+ delivery to the connecting tubule and cortical collecting duct, reducing K+ secretion.
SPAK‐KO mice display a lower increase in pNCC abundance in response to dietary K+ restriction compared with WT mice (Terker et al. 2015; Wade et al. 2015), and it was proposed that OSR1 may be involved in NCC activation under these conditions. A non‐inducible kidney‐specific OSR1 KO model displayed mild hypokalaemia at baseline, with a slight exacerbation following dietary NaCl and K+ restriction (Lin et al. 2011). Here, we report that on a normal diet, plasma [K+] was slightly lower than in DKO mice than in SPAK‐KO mice. When dietary K+ was restricted, mice lacking only SPAK‐KO or KS‐OSR1‐KO mice retained the ability to activate NCC (as reflected by increased pNCC abundance) and maintain plasma [K+] in a range similar to WT mice. In contrast, DKO mice failed to activate NCC in response to dietary K+ restriction, and plasma [K+] levels decreased precipitously. These observations suggest that when dietary K+ is abundant, the extremely low pNCC abundance in SPAK‐KO and DKO mice does not dramatically affect plasma [K+]. In DKO mice, when K+ availability is low, the critical role of the DCT in sensing plasma [K+] is revealed, as an inability to stimulate NCC phosphorylation is correlated with the development of profound hypokalaemia. Importantly, activation of NCC via phosphorylation at increased SPAK/OSR1‐independent sites such as T122, S124 and S89 does not appear to compensate for a lack of SPAK/OSR1 during K+ restriction.
While maintenance of potassium homeostasis is strongly disrupted in DKO mice, the effects on sodium homeostasis and maintenance of extracellular fluid volume were less severe than predicted. Systolic blood pressure was lower in DKO mice on a normal sodium diet. Furthermore, dietary sodium restriction led to mild volume contraction, but changes in urinary electrolyte excretion were essentially the same in both SPAK‐KO and SPAK/OSR1 DKO mice. While we did not directly compare DKO mice with mice lacking only OSR1 (as they have different genetic backgrounds), the phenotype of SPAK/OSR1 DKO mice does also not appear to be more severe than that of a previously reported non‐inducible kidney‐specific OSR1 knockout (Lin et al. 2011). Our data suggest that several compensatory processes are activated to maintain extracellular fluid volume in DKO mice.
Mutation of either SPAK/OSR1‐dependent or ‐independent phosphorylation sites reduces NKCC2 activity in vitro (Gimenez & Forbush, 2005; Fraser et al. 2007). Phosphorylation by SPAK/OSR1 is likely to mainly affect intrinsic cotransporter activity; phosphorylation at other sites such as S126 may also enhance NKCC2 recycling and plasma membrane insertion (Ares et al. 2011). Abundance of pNKCC2 is dramatically greater in SPAK‐KO mice than in WT mice (Yang et al. 2010; McCormick et al. 2011; Grimm et al. 2012), and while lower than in SPAK‐KO mice, was still greater in DKO mice than in WT mice. Disruption of OSR1 along the nephron was previously reported to decrease abundance of pNKCC2 (Lin et al. 2011), so it is necessary to reconcile our conflicting data. One possibility is that residual OSR1 expression in our model is sufficient to account for this discrepancy, but our immunofluoresence data revealed abundant pNKCC2 in the medulla despite a complete absence of OSR1. Therefore, the increased pNKCC2 abundance we observed in the absence of SPAK and OSR1 is probably the result of the activity of another kinase. WNK4, in a complex with the scaffolding protein MO25α (also called Cab39), may directly phosphorylate NKCC2 at SPAK‐dependent sites (Ponce‐Coria et al. 2014), but we did not find any significant changes in their abundance (data not shown), although changes in their activities cannot be excluded. Another possibility is that an as yet unidentified kinase phosphorylates SPAK/OSR1 at these sites, and this kinase may only be strongly activated in the absence of both SPAK and OSR1 (with inhibitory SPAK isoforms possibly inhibiting this other kinase, similar to their effects on OSR1) (McCormick et al. 2011; Grimm et al. 2012).
Two knock‐in mouse models have been generated with mutations in SPAK. The first has a mutation of threonine 243 to alanine (T243A) in the activation loop, which is a target of WNK kinase phosphorylation (Rafiqi et al. 2010). The second has a mutation of a critical leucine to an alanine (L502A) in the conserved carboxy‐terminal domain, which is required for interactions with WNK kinases (Zhang et al. 2015). In both cases, WNK‐dependent activation of SPAK is inhibited, and while pNCC abundance is reduced as in SPAK‐KO mice, the abundance of pNKCC2 is reduced, rather than increased. The formation of protein scaffolds has been proposed to play a key role in the function of SPAK and OSR1, and several partners have been identified that may form part of a larger complex for both NKCC2 and NCC. These include MO25α (Filippi et al. 2011; Grimm et al. 2012; Ponce‐Coria et al. 2014), SORLA (Reiche et al. 2010), MAL/VIP17 (Carmosino et al. 2010) and γ‐adducin (Dimke et al. 2011). The two knock‐in models may retain the ability to form protein scaffolds (although it may be impaired in mice with the L502A mutation as L502 is important for protein–protein interactions), while the knockout approach we took completely removes components of scaffolds. Together, both approaches can provide important insights into the regulation of NKCC2 and NCC in vivo. For example, we and others have proposed the existence of inhibitory SPAK isoforms (McCormick et al. 2011; Grimm et al. 2012) (and here we report the cloning of a putative inhibitory OSR1 isoform, S‐OSR1) that when absent along the TAL (as in the SPAK‐KO) lead to disinhibition of OSR1 and hence an increase in pNKCC2. In the knock‐in model, all isoforms of SPAK including the full‐length form are still present, and the mutant forms of full‐length SPAK could act as dominant‐negative inhibitors of OSR1 and any other kinases that interact with and phosphorylate NKCC2 and NCC. In SPAK/OSR1 DKO mice, two possible components of the scaffold have been removed, yet the abundance of pNKCC2 was still significant. This suggests that another kinase may substitute for SPAK and OSR1, or that scaffolds are not essential for phosphorylation of NKCC2.
Phosphorylation of NKCC2 at S126 has been proposed to be performed by AMPK (Fraser et al. 2007; Gunaratne et al. 2010; Richardson et al. 2011) or by PKA (Gunaratne et al. 2010; Rieg et al. 2013), but the kinase responsible in vivo is still unclear. We found no significant differences in abundances of the activated forms of these kinases in either whole kidney, or separated cortex and medulla. These data are in contrast to the findings of Grimm and colleagues who reported elevated p‐AMPK levels in the medulla of SPAK‐KO mice compared with WT mice (Grimm et al. 2012), although they did not assess pS126‐NKCC2 abundance. These discrepant findings may reflect differences in background, age, diet or other environmental factors. We also found significantly lower abundance of p‐S57 NKCC2 in DKO mice; the physiological relevance of phosphorylation at this site, and the kinase responsible, is unknown. However, the lower abundances of p‐S57 and p‐S126 NKCC2 in DKO mice may contribute to the lower systolic blood pressure we observed. WT mice treated with furosemide for 4 weeks develop polyuria (about 5‐fold higher volume than controls) and hypercalciuria (Takahashi et al. 2000), neither of which was observed in SPAK/OSR1 DKO mice. Thus, we conclude that while SPAK and OSR1 are important in maintaining salt transport along the TAL, they are not essential. While this may reflect compensatory activation of NKCC2 by other pathways, NKCC2 activity may also be less sensitive to changes in phosphorylation status than other cotransporters (Gimenez & Forbush, 2005; Hannemann & Flatman, 2011).
Disruption of SPAK leads to a large decrease in abundances of total NCC and NCC phosphorylated at SPAK/OSR1‐dependent sites (Yang et al. 2010; McCormick et al. 2011; Grimm et al. 2012). In contrast, constitutive disruption of OSR1 in kidney modestly increases abundance of pNCC (Lin et al. 2011). Counter to the hypothesis that OSR1 activity along the DCT is dependent on SPAK (Grimm et al. 2012), we found that disruption of both kinases further reduced pNCC abundance, indicating that OSR1 is still active in SPAK‐KO mice. However, our data clearly support the hypothesis that SPAK is the primary determinant of NCC activity. NCC is also phosphorylated at several SPAK/OSR1‐independent sites. In rats, pS124‐NCC abundance is increased by 1‐desamino‐8‐d‐arginine, vasopressin or sodium restriction, and the mutant S124A displays reduced activity in Xenopus oocytes (Rosenbaek et al. 2012). Our quantitative phosphoproteomics analysis identified increased phosphorylation of NCC at T122 alone, and at T122 and S124 simultaneously in DKO mice. T122 is conserved in human but not in rat, but nothing is known about the role of phosphorylation at this site. Our data suggest that T122 and S124 phosphorylation may enhance the response of NCC to activating stimuli such as reduced intracellular chloride concentration. We also found preliminary evidence for increased phosphorylation at S89 of NCC in DKO mice. This site is not phosphorylated by SPAK/OSR1, and an S89A mutant displays the same activity as WT NCC (Richardson et al. 2008). Together, these data suggest that following SPAK disruption, other pathways are activated in an attempt to preserve NCC activity. Confirmation by Western blotting is required, but this is currently limited by the available antibodies.
Changes in other distal sodium transport pathways revealed more distal compensatory processes. Abundance of ENaC subunits differed, but as has been reported previously in several models (Weisz & Johnson, 2003), the direction of the changes was inconsistent. ENaC activity is also regulated by alterations in its membrane abundance and phosphorylation status, and by proteolytic cleavage (reviewed by Bhalla & Hallows, 2008), so correlation of activity with subunit abundance as determined by Western blotting may not be valid. We therefore performed an amiloride response test and found that DKO mice displayed a greater natriuresis, suggesting that ENaC activity was greater in DKO mice. Abundance of pendrin was lower, consistent with a previous report that chronic K+ depletion (and hence reduced plasma [K+]) reduces pendrin abundance (Wagner et al. 2002), but discordant with the observation that it is increased in SPAK‐KO mice (Grimm et al. 2015). NDCBE was robustly increased, consistent with observations in SPAK‐KO mice (Grimm et al. 2015). Thus, compensatory activation of NKCC2 and NCC as well as other transport pathways (e.g. ENaC and NDCBE) may prevent DKO mice from developing severe salt‐wasting either at baseline or following dietary sodium restriction.
In summary, our data reveal that together SPAK and OSR1 play essential roles in the pathway along the DCT that responds to fluctuations in plasma [K+], with the WNK4‐SPAK/OSR1 pathway possibly being the sole mechanism by which NCC is activated in response to low plasma [K+] (Fig. 7 B). This is supported by the observations that WNK4 is the main WNK responsible for NCC activation in vivo (Takahashi et al. 2014), and that K+ restriction lowers plasma [K+] to remarkably similar levels in DKO mice (presented here), WNK4 knockout mice (Castaneda‐Bueno et al. 2014) and NCC knockout mice (A. S. Terker and D. H. Ellison, personal communication). The lack of severe salt‐wasting or polyuria either at baseline or following salt restriction suggests that SPAK and OSR1 are important but not essential regulators of salt transport along the TAL. Compensatory activation of NCC and NKCC2 by phosphorylation at other sites may play a role in maintaining extracellular fluid volume, and NKCC2 may be phosphorylated at SPAK/OSR1‐dependent sites by an unidentified kinase. A compensatory response along the entire nephron may also occur, similar to that recently reported in SPAK‐KO mice (Grimm et al. 2015). Our data also reveal that regulation of NKCC2 and NCC by phosphorylation is extremely complex, with multiple mechanisms beyond SPAK/OSR1. For the majority of these SPAK/OSR1‐independent phosphorylation events, future studies will be needed to identify their physiological relevance, and the kinases involved.
Additional information
Competing interests
The authors have no competing interests to disclose.
Author contributions
The majority of the experiments were performed at Oregon Health and Science University. J.A.M. conceived and designed the experiments. M.Z.F. and J.A.M. performed all the experiments with the following exceptions. J.R. designed and conceived, and K.W.B and B.M.G performed phosphoproteomic experiments; E.R.A performed 22Na uptake assays; K.L.C. performed NDCBE Western blots. J.A.M., J.R., A.S.T., E.R.A., K.W.B., B.M.G., K.L.C., M.Z.F., G.G. and R.C. assembled, analysed and interpreted the data. J.A.M. and M.Z.F. drafted the article. All authors revised the article critically for important intellectual content. All authors have approved the final version of the manuscript and agree to be accountable for all aspects of the work. All persons designated as authors qualify for authorship, and all those who qualify for authorship are listed.
Funding
This research was supported by National Institutes of Health Grants R01DK098141 to J.A.M., and R01GM117230 and P01DK017433 to J.R. and CONACYT Mexico Grant 165815 to G.G. K.W.B. is supported by NIH‐T32 GM100884 and the National Science Foundation Graduate Research Fellowship under Grant No. DGE‐1122492.
Acknowledgements
We thank Robert Fenton for providing the anti‐pS124 NCC antibody (Rosenbaek et al. 2012), Jan Loffing for providing the anti‐pS89 NCC antibody (Sorensen et al. 2013), and Harry Park and Norma Vázquez for technical assistance.
This is an Editor&s Choice article from the 1 September 2016 issue.
References
- Ares GR, Caceres PS & Ortiz PA (2011). Molecular regulation of NKCC2 in the thick ascending limb. Am J Physiol Renal Physiol 301, F1143–1159. [DOI] [PMC free article] [PubMed] [Google Scholar]
- Bazua‐Valenti S, Chavez‐Canales M, Rojas‐Vega L, Gonzalez‐Rodriguez X, Vazquez N, Rodriguez‐Gama A, Argaiz ER, Melo Z, Plata C, Ellison DH, Garcia‐Valdes J, Hadchouel J & Gamba G (2015). The Effect of WNK4 on the Na+–Cl– cotransporter is modulated by intracellular chloride. J Am Soc Nephrol 26, 1781–1786. [DOI] [PMC free article] [PubMed] [Google Scholar]
- Bhalla V & Hallows KR (2008). Mechanisms of ENaC regulation and clinical implications. J Am Soc Nephrol 19, 1845–1854. [DOI] [PubMed] [Google Scholar]
- Boersema PJ, Raijmakers R, Lemeer S, Mohammed S & Heck AJ (2009). Multiplex peptide stable isotope dimethyl labeling for quantitative proteomics. Nat Protoc 4, 484–494. [DOI] [PubMed] [Google Scholar]
- Bostanjoglo M, Reeves WB, Reilly RF, Velazquez H, Robertson N, Litwack G, Morsing P, Dorup J, Bachmann S & Ellison DH (1998). 11β‐hydroxysteroid dehydrogenase, mineralocorticoid receptor, and thiazide‐sensitive Na–Cl cotransporter expression by distal tubules. J Am Soc Nephrol 9, 1347–1358. [DOI] [PubMed] [Google Scholar]
- Carmosino M, Rizzo F, Procino G, Basco D, Valenti G, Forbush B, Schaeren‐Wiemers N, Caplan MJ & Svelto M (2010). MAL/VIP17, a new player in the regulation of NKCC2 in the kidney. Mol Biol Cell 21, 3985–3997. [DOI] [PMC free article] [PubMed] [Google Scholar]
- Castaneda‐Bueno M, Cervantes‐Perez LG, Rojas‐Vega L, Arroyo‐Garza I, Vazquez N, Moreno E & Gamba G (2014). Modulation of NCC activity by low and high K+ intake: insights into the signaling pathways involved. Am J Physiol Renal Physiol 306, F1507–1519. [DOI] [PMC free article] [PubMed] [Google Scholar]
- Cox J & Mann M (2008). MaxQuant enables high peptide identification rates, individualized p.p.b.‐range mass accuracies and proteome‐wide protein quantification. Nat Biotechnol 26, 1367–1372. [DOI] [PubMed] [Google Scholar]
- Dimke H, San‐Cristobal P, de Graaf M, Lenders JW, Deinum J, Hoenderop JG & Bindels RJ (2011). γ‐Adducin stimulates the thiazide‐sensitive NaCl cotransporter. J Am Soc Nephrol 22, 508–517. [DOI] [PMC free article] [PubMed] [Google Scholar]
- Eladari D, Chambrey R, Picard N & Hadchouel J (2014). Electroneutral absorption of NaCl by the aldosterone‐sensitive distal nephron: implication for normal electrolytes homeostasis and blood pressure regulation. Cell Mol Life Sci 71, 2879–2895. [DOI] [PMC free article] [PubMed] [Google Scholar]
- Faresse N, Lagnaz D, Debonneville A, Ismailji A, Maillard M, Fejes‐Toth G, Naray‐Fejes‐Toth A & Staub O (2012). Inducible kidney‐specific Sgk1 knockout mice show a salt‐losing phenotype. Am J Physiol Renal Physiol 302, F977–985. [DOI] [PubMed] [Google Scholar]
- Feric M, Zhao B, Hoffert JD, Pisitkun T & Knepper MA (2011). Large‐scale phosphoproteomic analysis of membrane proteins in renal proximal and distal tubule. Am J Physiol Cell Physiol 300, C755–770. [DOI] [PMC free article] [PubMed] [Google Scholar]
- Filippi BM, de los Heros P, Mehellou Y, Navratilova I, Gourlay R, Deak M, Plater L, Toth R, Zeqiraj E & Alessi DR (2011). MO25 is a master regulator of SPAK/OSR1 and MST3/MST4/YSK1 protein kinases. EMBO J 30, 1730–1741. [DOI] [PMC free article] [PubMed] [Google Scholar]
- Fraser SA, Gimenez I, Cook N, Jennings I, Katerelos M, Katsis F, Levidiotis V, Kemp BE & Power DA (2007). Regulation of the renal‐specific Na+‐K+‐2Cl– co‐transporter NKCC2 by AMP‐activated protein kinase (AMPK). Biochem J 405, 85–93. [DOI] [PMC free article] [PubMed] [Google Scholar]
- Giebisch G, Hebert SC & Wang WH (2003). New aspects of renal potassium transport. Pflugers Arch 446, 289–297. [DOI] [PubMed] [Google Scholar]
- Gimenez I & Forbush B (2005). Regulatory phosphorylation sites in the NH2 terminus of the renal Na‐K‐Cl cotransporter (NKCC2). Am J Physiol Renal Physiol 289, F1341–1345. [DOI] [PubMed] [Google Scholar]
- Grimm PR, Lazo‐Fernandez Y, Delpire E, Wall SM, Dorsey SG, Weinman EJ, Coleman R, Wade JB & Welling PA (2015). Integrated compensatory network is activated in the absence of NCC phosphorylation. J Clin Invest 125, 2136–2150. [DOI] [PMC free article] [PubMed] [Google Scholar]
- Grimm PR, Taneja TK, Liu J, Coleman R, Chen YY, Delpire E, Wade JB & Welling PA (2012). SPAK isoforms and OSR1 regulate sodium‐chloride co‐transporters in a nephron‐specific manner. J Biol Chem 287, 37673–37690. [DOI] [PMC free article] [PubMed] [Google Scholar]
- Gunaratne R, Braucht DW, Rinschen MM, Chou CL, Hoffert JD, Pisitkun T & Knepper MA (2010). Quantitative phosphoproteomic analysis reveals cAMP/vasopressin‐dependent signaling pathways in native renal thick ascending limb cells. Proc Natl Acad Sci USA 107, 15653–15658. [DOI] [PMC free article] [PubMed] [Google Scholar]
- Hannemann A & Flatman PW (2011). Phosphorylation and transport in the Na‐K‐2Cl cotransporters, NKCC1 and NKCC2A, compared in HEK‐293 cells. PloS ONE 6, e17992. [DOI] [PMC free article] [PubMed] [Google Scholar]
- Hao P, Ren Y, Dutta B & Sze SK (2013). Comparative evaluation of electrostatic repulsion‐hydrophilic interaction chromatography (ERLIC) and high‐pH reversed phase (Hp‐RP) chromatography in profiling of rat kidney proteome. J Proteomics 82, 254–262. [DOI] [PubMed] [Google Scholar]
- Huttlin EL, Jedrychowski MP, Elias JE, Goswami T, Rad R, Beausoleil SA, Villen J, Haas W, Sowa ME & Gygi SP (2010). A tissue‐specific atlas of mouse protein phosphorylation and expression. Cell 143, 1174–1189. [DOI] [PMC free article] [PubMed] [Google Scholar]
- Kaplan MR, Plotkin MD, Brown D, Hebert SC & Delpire E (1996). Expression of the mouse Na‐K‐2Cl cotransporter, mBSC2, in the terminal inner medullary collecting duct, the glomerular and extraglomerular mesangium, and the glomerular afferent arteriole. J Clin Invest 98, 723–730. [DOI] [PMC free article] [PubMed] [Google Scholar]
- Kettenbach AN & Gerber SA (2011). Rapid and reproducible single‐stage phosphopeptide enrichment of complex peptide mixtures: application to general and phosphotyrosine‐specific phosphoproteomics experiments. Anal Chem 83, 7635–7644. [DOI] [PMC free article] [PubMed] [Google Scholar]
- Lalioti MD, Zhang J, Volkman HM, Kahle KT, Hoffmann KE, Toka HR, Nelson‐Williams C, Ellison DH, Flavell R, Booth CJ, Lu Y, Geller DS & Lifton RP (2006). Wnk4 controls blood pressure and potassium homeostasis via regulation of mass and activity of the distal convoluted tubule. Nat Genet 38, 1124–1132. [DOI] [PubMed] [Google Scholar]
- Leviel F, Hubner CA, Houillier P, Morla L, El Moghrabi S, Brideau G, Hassan H, Parker MD, Kurth I, Kougioumtzes A, Sinning A, Pech V, Riemondy KA, Miller RL, Hummler E, Shull GE, Aronson PS, Doucet A, Wall SM, Chambrey R & Eladari D (2010). The Na+‐dependent chloride‐bicarbonate exchanger SLC4A8 mediates an electroneutral Na+ reabsorption process in the renal cortical collecting ducts of mice. J Clin Invest 120, 1627–1635. [DOI] [PMC free article] [PubMed] [Google Scholar]
- Lin SH, Yu IS, Jiang ST, Lin SW, Chu P, Chen A, Sytwu HK, Sohara E, Uchida S, Sasaki S & Yang SS (2011). Impaired phosphorylation of Na+‐K+‐2Cl– cotransporter by oxidative stress‐responsive kinase‐1 deficiency manifests hypotension and Bartter‐like syndrome. Proc Natl Acad Sci USA 108, 17538–17543. [DOI] [PMC free article] [PubMed] [Google Scholar]
- Lourdel S, Paulais M, Marvao P, Nissant A & Teulon J (2003). A chloride channel at the basolateral membrane of the distal‐convoluted tubule: a candidate ClC‐K channel. J Gen Physiol 121, 287–300. [DOI] [PMC free article] [PubMed] [Google Scholar]
- Lundby A, Secher A, Lage K, Nordsborg NB, Dmytriyev A, Lundby C & Olsen JV (2012). Quantitative maps of protein phosphorylation sites across 14 different rat organs and tissues. Nat Commun 3, 876. [DOI] [PMC free article] [PubMed] [Google Scholar]
- Markadieu N, Rios K, Spiller BW, McDonald WH, Welling PA & Delpire E (2014). Short forms of Ste20‐related proline/alanine‐rich kinase (SPAK) in the kidney are created by aspartyl aminopeptidase (Dnpep)‐mediated proteolytic cleavage. J Biol Chem 289, 29273–29284. [DOI] [PMC free article] [PubMed] [Google Scholar]
- McCormick JA, Mutig K, Nelson JH, Saritas T, Hoorn EJ, Yang CL, Rogers S, Curry J, Delpire E, Bachmann S & Ellison DH (2011). A SPAK isoform switch modulates renal salt transport and blood pressure. Cell Metab 14, 352–364. [DOI] [PMC free article] [PubMed] [Google Scholar]
- McCormick JA, Yang CL, Zhang C, Davidge B, Blankenstein KI, Terker AS, Yarbrough B, Meermeier NP, Park HJ, McCully B, West M, Borschewski A, Himmerkus N, Bleich M, Bachmann S, Mutig K, Argaiz ER, Gamba G, Singer JD & Ellison DH (2014). Hyperkalemic hypertension‐associated cullin 3 promotes WNK signaling by degrading KLHL3. J Clin Invest 124, 4723–4736. [DOI] [PMC free article] [PubMed] [Google Scholar]
- Monroy A, Plata C, Hebert SC & Gamba G (2000). Characterization of the thiazide‐sensitive Na+‐Cl– cotransporter: a new model for ions and diuretics interaction. Am J Physiol Renal Physiol 279, F161–169. [DOI] [PubMed] [Google Scholar]
- Mount DB, Mercado A, Song L, Xu J, George AL, Jr , Delpire E & Gamba G (1999). Cloning and characterization of KCC3 and KCC4, new members of the cation‐chloride cotransporter gene family. J Biol Chem 274, 16355–16362. [DOI] [PubMed] [Google Scholar]
- Pacheco‐Alvarez D, Cristobal PS, Meade P, Moreno E, Vazquez N, Munoz E, Diaz A, Juarez ME, Gimenez I & Gamba G (2006). The Na+:Cl– cotransporter is activated and phosphorylated at the amino‐terminal domain upon intracellular chloride depletion. J Biol Chem 281, 28755–28763. [DOI] [PubMed] [Google Scholar]
- Palmer LG & Frindt G (2000). Aldosterone and potassium secretion by the cortical collecting duct. Kidney Int 57, 1324–1328. [DOI] [PubMed] [Google Scholar]
- Park HJ, Curry JN & McCormick JA (2013). Regulation of NKCC2 activity by inhibitory SPAK isoforms: KS‐SPAK is a more potent inhibitor than SPAK2. Am J Physiol Renal Physiol 305, F1687–1696. [DOI] [PMC free article] [PubMed] [Google Scholar]
- Piala AT, Moon TM, Akella R, He H, Cobb MH & Goldsmith EJ (2014). Chloride sensing by WNK1 involves inhibition of autophosphorylation. Sci Signal 7, ra41. [DOI] [PMC free article] [PubMed] [Google Scholar]
- Pluznick JL & Sansom SC (2006). BK channels in the kidney: role in K+ secretion and localization of molecular components. Am J Physiol Renal Physiol 291, F517–529. [DOI] [PubMed] [Google Scholar]
- Ponce‐Coria J, Markadieu N, Austin TM, Flammang L, Rios K, Welling PA & Delpire E (2014). A novel Ste20‐related proline/alanine‐rich kinase (SPAK)‐independent pathway involving calcium‐binding protein 39 (Cab39) and serine threonine kinase with no lysine member 4 (WNK4) in the activation of Na‐K‐Cl cotransporters. J Biol Chem 289, 17680–17688. [DOI] [PMC free article] [PubMed] [Google Scholar]
- Rafiqi FH, Zuber AM, Glover M, Richardson C, Fleming S, Jovanovic S, Jovanovic A, O'Shaughnessy KM & Alessi DR (2010). Role of the WNK‐activated SPAK kinase in regulating blood pressure. EMBO Mol Med 2, 63–75. [DOI] [PMC free article] [PubMed] [Google Scholar]
- Reiche J, Theilig F, Rafiqi FH, Carlo AS, Militz D, Mutig K, Todiras M, Christensen EI, Ellison DH, Bader M, Nykjaer A, Bachmann S, Alessi D & Willnow TE (2010). SORLA/SORL1 functionally interacts with SPAK to control renal activation of Na+‐K+‐Cl– cotransporter 2. Mol Cell Biol 30, 3027–3037. [DOI] [PMC free article] [PubMed] [Google Scholar]
- Richardson C, Rafiqi FH, Karlsson HK, Moleleki N, Vandewalle A, Campbell DG, Morrice NA & Alessi DR (2008). Activation of the thiazide‐sensitive Na+‐Cl– cotransporter by the WNK‐regulated kinases SPAK and OSR1. J Cell Sci 121, 675–684. [DOI] [PubMed] [Google Scholar]
- Richardson C, Sakamoto K, de los Heros P, Deak M, Campbell DG, Prescott AR & Alessi DR (2011). Regulation of the NKCC2 ion cotransporter by SPAK‐OSR1‐dependent and ‐independent pathways. J Cell Sci 124, 789–800. [DOI] [PMC free article] [PubMed] [Google Scholar]
- Rieg T, Tang T, Uchida S, Hammond HK, Fenton RA & Vallon V (2013). Adenylyl cyclase 6 enhances NKCC2 expression and mediates vasopressin‐induced phosphorylation of NKCC2 and NCC. Am J Pathol 182, 96–106. [DOI] [PMC free article] [PubMed] [Google Scholar]
- Rosenbaek LL, Assentoft M, Pedersen NB, MacAulay N & Fenton RA (2012). Characterization of a novel phosphorylation site in the sodium‐chloride cotransporter, NCC. J Physiol 590, 6121–6139. [DOI] [PMC free article] [PubMed] [Google Scholar]
- Sandberg MB, Maunsbach AB & McDonough AA (2006). Redistribution of distal tubule Na+‐Cl– cotransporter (NCC) in response to a high‐salt diet. Am J Physiol Renal Physiol 291, F503–508. [DOI] [PubMed] [Google Scholar]
- Saritas T, Borschewski A, McCormick JA, Paliege A, Dathe C, Uchida S, Terker A, Himmerkus N, Bleich M, Demaretz S, Laghmani K, Delpire E, Ellison DH, Bachmann S & Mutig K (2013). SPAK differentially mediates vasopressin effects on sodium cotransporters. J Am Soc Nephrol 24, 407–418. [DOI] [PMC free article] [PubMed] [Google Scholar]
- Schmitt R, Klussmann E, Kahl T, Ellison DH & Bachmann S (2003). Renal expression of sodium transporters and aquaporin‐2 in hypothyroid rats. Am J Physiol Renal Physiol 284, F1097–1104. [DOI] [PubMed] [Google Scholar]
- Seyberth HW & Schlingmann KP (2011). Bartter‐ and Gitelman‐like syndromes: salt‐losing tubulopathies with loop or DCT defects. Pediatr Nephrol 26, 1789–1802. [DOI] [PMC free article] [PubMed] [Google Scholar]
- Simon DB, Nelson‐Williams C, Bia MJ, Ellison D, Karet FE, Molina AM, Vaara I, Iwata F, Cushner HM, Koolen M, Gainza FJ, Gitleman HJ & Lifton RP (1996). Gitelman's variant of Bartter's syndrome, inherited hypokalaemic alkalosis, is caused by mutations in the thiazide‐sensitive Na‐Cl cotransporter. Nat Genet 12, 24–30. [DOI] [PubMed] [Google Scholar]
- Soleimani M, Barone S, Xu J, Shull GE, Siddiqui F, Zahedi K & Amlal H (2012). Double knockout of pendrin and Na‐Cl cotransporter (NCC) causes severe salt wasting, volume depletion, and renal failure. Proc Natl Acad Sci USA 109, 13368–13373. [DOI] [PMC free article] [PubMed] [Google Scholar]
- Sorensen MV, Grossmann S, Roesinger M, Gresko N, Todkar AP, Barmettler G, Ziegler U, Odermatt A, Loffing‐Cueni D & Loffing J (2013). Rapid dephosphorylation of the renal sodium chloride cotransporter in response to oral potassium intake in mice. Kidney Int 83, 811–824. [DOI] [PubMed] [Google Scholar]
- Takahashi D, Mori T, Nomura N, Khan MZ, Araki Y, Zeniya M, Sohara E, Rai T, Sasaki S & Uchida S (2014). WNK4 is the major WNK positively regulating NCC in the mouse kidney. Biosci Rep 34, e00107. [DOI] [PMC free article] [PubMed] [Google Scholar]
- Takahashi N, Chernavvsky DR, Gomez RA, Igarashi P, Gitelman HJ & Smithies O (2000). Uncompensated polyuria in a mouse model of Bartter's syndrome. Proc Natl Acad Sci USA 97, 5434–5439. [DOI] [PMC free article] [PubMed] [Google Scholar]
- Take C, Ikeda K, Kurasawa T & Kurokawa K (1991). Increased chloride reabsorption as an inherited renal tubular defect in familial type II pseudohypoaldosteronism. N Engl J Med 324, 472–476. [DOI] [PubMed] [Google Scholar]
- Terker AS, Zhang C, McCormick JA, Lazelle RA, Zhang C, Meermeier NP, Siler DA, Park HJ, Fu Y, Cohen DM, Weinstein AM, Wang WH, Yang CL & Ellison DH (2015). Potassium modulates electrolyte balance and blood pressure through effects on distal cell voltage and chloride. Cell Metab 21, 39–50. [DOI] [PMC free article] [PubMed] [Google Scholar]
- Terker AS, Zhang C, Erspamer KJ, Gamba G, Yang CL & Ellison DH (2016). Unique chloride‐sensing properties of WNK4 permit the distal nephron to modulate potassium homeostasis. Kidney Int 89, 127–134. [DOI] [PMC free article] [PubMed] [Google Scholar]
- Tiwari S, Sharma N, Gill PS, Igarashi P, Kahn CR, Wade JB & Ecelbarger CM (2008). Impaired sodium excretion and increased blood pressure in mice with targeted deletion of renal epithelial insulin receptor. Proc Natl Acad Sci USA 105, 6469–6474. [DOI] [PMC free article] [PubMed] [Google Scholar]
- Traykova‐Brauch M, Schonig K, Greiner O, Miloud T, Jauch A, Bode M, Felsher DW, Glick AB, Kwiatkowski DJ, Bujard H, Horst J, von Knebel Doeberitz M, Niggli FK, Kriz W, Grone HJ & Koesters R (2008). An efficient and versatile system for acute and chronic modulation of renal tubular function in transgenic mice. Nat Med 14, 979–984. [DOI] [PMC free article] [PubMed] [Google Scholar]
- Vallon V, Schroth J, Lang F, Kuhl D & Uchida S (2009). Expression and phosphorylation of the Na+‐Cl– cotransporter NCC in vivo is regulated by dietary salt, potassium, and SGK1. Am J Physiol Renal Physiol 297, F704–712. [DOI] [PMC free article] [PubMed] [Google Scholar]
- van der Lubbe N, Moes AD, Rosenbaek LL, Schoep S, Meima ME, Danser AH, Fenton RA, Zietse R & Hoorn EJ (2013). K+‐induced natriuresis is preserved during Na+ depletion and accompanied by inhibition of the Na+‐Cl‐ cotransporter. Am J Physiol Renal Physiol 305, F1177–1188. [DOI] [PubMed] [Google Scholar]
- Velazquez H & Silva T (2003). Cloning and localization of KCC4 in rabbit kidney: expression in distal convoluted tubule. Am J Physiol Renal Physiol 285, F49–58. [DOI] [PubMed] [Google Scholar]
- Vitari AC, Deak M, Morrice NA & Alessi DR (2005). The WNK1 and WNK4 protein kinases that are mutated in Gordon's hypertension syndrome phosphorylate and activate SPAK and OSR1 protein kinases. Biochem J 391, 17–24. [DOI] [PMC free article] [PubMed] [Google Scholar]
- Vitzthum H, Castrop H, Meier‐Meitinger M, Riegger GA, Kurtz A, Kramer BK & Wolf K (2002). Nephron specific regulation of chloride channel CLC‐K2 mRNA in the rat. Kidney Int 61, 547–554. [DOI] [PubMed] [Google Scholar]
- Wade JB, Liu J, Coleman R, Grimm PR, Delpire E & Welling PA (2015). SPAK‐mediated NCC regulation in response to low‐K+ diet. Am J Physiol Renal Physiol 308, F923–931. [DOI] [PMC free article] [PubMed] [Google Scholar]
- Wagner CA, Finberg KE, Stehberger PA, Lifton RP, Giebisch GH, Aronson PS & Geibel JP (2002). Regulation of the expression of the Cl–/anion exchanger pendrin in mouse kidney by acid‐base status. Kidney Int 62, 2109–2117. [DOI] [PubMed] [Google Scholar]
- Wang WH (1995). View of K+ secretion through the apical K channel of cortical collecting duct. Kidney Int 48, 1024–1030. [DOI] [PubMed] [Google Scholar]
- Weisz OA & Johnson JP (2003). Noncoordinate regulation of ENaC: paradigm lost? Am J Physiol Renal Physiol 285, F833–842. [DOI] [PubMed] [Google Scholar]
- Wessel D & Flugge UI (1984). A method for the quantitative recovery of protein in dilute solution in the presence of detergents and lipids. Anal Biochem 138, 141–143. [DOI] [PubMed] [Google Scholar]
- Yang SS, Lo YF, Wu CC, Lin SW, Yeh CJ, Chu P, Sytwu HK, Uchida S, Sasaki S & Lin SH (2010). SPAK‐knockout mice manifest Gitelman syndrome and impaired vasoconstriction. J Am Soc Nephrol 21, 1868–1877. [DOI] [PMC free article] [PubMed] [Google Scholar]
- Yang SS, Morimoto T, Rai T, Chiga M, Sohara E, Ohno M, Uchida K, Lin SH, Moriguchi T, Shibuya H, Kondo Y, Sasaki S & Uchida S (2007). Molecular pathogenesis of pseudohypoaldosteronism type II: generation and analysis of a Wnk4(D561A/+) knockin mouse model. Cell Metab 5, 331–344. [DOI] [PubMed] [Google Scholar]
- Zhang J, Siew K, Macartney T, O'Shaughnessy KM & Alessi DR (2015). Critical role of the SPAK protein kinase CCT domain in controlling blood pressure. Hum Mol Genet 24, 4545–4558. [DOI] [PMC free article] [PubMed] [Google Scholar]