

Abstract
Key point
Exercise increases skeletal muscle energy turnover and one of the important substrates for the working muscle is glucose taken up from the blood.
The GTPase Rac1 can be activated by muscle contraction and has been found to be necessary for insulin‐stimulated glucose uptake, although its role in exercise‐stimulated glucose uptake is unknown.
We show that Rac1 regulates the translocation of the glucose transporter GLUT4 to the plasma membrane in skeletal muscle during exercise.
We find that Rac1 knockout mice display significantly reduced glucose uptake in skeletal muscle during exercise.
Abstract
Exercise increases skeletal muscle energy turnover and one of the important substrates for the working muscle is glucose taken up from the blood. Despite extensive efforts, the signalling mechanisms vital for glucose uptake during exercise are not yet fully understood, although the GTPase Rac1 is a candidate molecule. The present study investigated the role of Rac1 in muscle glucose uptake and substrate utilization during treadmill exercise in mice in vivo. Exercise‐induced uptake of radiolabelled 2‐deoxyglucose at 65% of maximum running capacity was blocked in soleus muscle and decreased by 80% and 60% in gastrocnemius and tibialis anterior muscles, respectively, in muscle‐specific inducible Rac1 knockout (mKO) mice compared to wild‐type littermates. By developing an assay to quantify endogenous GLUT4 translocation, we observed that GLUT4 content at the sarcolemma in response to exercise was reduced in Rac1 mKO muscle. Our findings implicate Rac1 as a regulatory element critical for controlling glucose uptake during exercise via regulation of GLUT4 translocation.
Key point
Exercise increases skeletal muscle energy turnover and one of the important substrates for the working muscle is glucose taken up from the blood.
The GTPase Rac1 can be activated by muscle contraction and has been found to be necessary for insulin‐stimulated glucose uptake, although its role in exercise‐stimulated glucose uptake is unknown.
We show that Rac1 regulates the translocation of the glucose transporter GLUT4 to the plasma membrane in skeletal muscle during exercise.
We find that Rac1 knockout mice display significantly reduced glucose uptake in skeletal muscle during exercise.
Abbreviations
- AMPK
AMP‐activated protein kinase
- 2‐DG
2‐deoxyglucose
- mKO
muscle‐specific inducible Rac1 knockout
- PBS
phosphate‐buffered saline
- Rac1
Ras‐related C3 botulinum toxin substrate 1
- TA
tibialis anterior
- WT
wild‐type
Introduction
Exercise promotes a large increase in skeletal muscle energy turnover, and one of the important substrates for the working muscle is glucose taken up from the blood. Glucose uptake during exercise is regulated in three main steps: (i) increased glucose delivery; (ii) increased transport of glucose molecules across the muscle plasma membrane; and (iii) augmented intracellular metabolism of glucose (Richter & Hargreaves, 2013). The increase in glucose transport across the plasma membrane is mediated by translocation of the glucose transporter, GLUT4, from intracellular storage sites to the sarcolemma and t‐tubules, both in response to insulin (Marette et al. 1992; Kristiansen et al. 1996) or to exercise (Douen et al. 1990; Lauritzen et al. 2010). Despite intense research, the signalling mechanisms that mediate exercise‐stimulated glucose uptake are still incompletely understood. Our group recently identified the Rho family GTPase, Rac1 (Ras‐related C3 botulinum toxin substrate) as a previously unrealized signalling protein activated by muscle contractions (Sylow et al. 2013 b).
Rac1 regulates various cellular processes, including NADPH oxidase dependent reactive oxygen species production (Morel et al. 1991; Hordijk, 2006) and reorganization of the actin cytoskeleton (Ridley et al. 1992; Hall & Nobes, 2000; Chiu et al. 2011). A connection between Rac1 and glucose transport was originally observed in L6 muscle cells. Here Rac1 was found to be activated rapidly in response to insulin and contribute to insulin‐induced GLUT4 translocation and glucose transport. This was brought about through the induction of cortical actin filament remodelling (JeBailey et al. 2007). Rac1 also regulates insulin‐stimulated glucose uptake in mature skeletal mouse muscle. Notably, insulin‐stimulated phosphorylation of PAK1/2Thr423/402, a downstream target of Rac1, is impaired in skeletal muscle of insulin resistant human subjects (Sylow et al. 2013 a) and in ob/ob mice (Sylow et al. 2014). Although the contribution of Rac1 to the regulation of glucose transport by in vivo exercise has not been examined, we recently showed that ex vivo electrically‐induced contraction increases glucose transport to a lesser extent in muscles with decreased Rac1 signalling (Sylow et al. 2013 b). However, electrical stimulation ex vivo induces intense supraphysiological isometric muscle contraction and recruits all fibres in the stimulated muscle, and is quite different from the conditions during in vivo exercise at a submaximal intensity. Hence, there is a need to examine the possible contribution of Rac1 to glucose uptake, as well as to GLUT4 in particular, in exercising skeletal muscles.
Exercise‐stimulated glucose uptake depends in part on the activation of AMP‐activated protein kinase (AMPK) (Mu et al. 2001; O'Neill et al. 2011; Jensen et al. 2014), although this connection has been questioned in some studies (Maarbjerg et al. 2009; Fentz et al. 2015). In addition or on top of AMPK signalling, several other proteins and processes, including protein kinase C, LKB1, mechanical stretching, reactive oxygen species and nitric oxide, may participate in the regulation of exercise‐stimulated glucose uptake in skeletal muscle (Richter & Hargreaves, 2013). Other as yet unidentified mechanisms probably also contribute to the regulation of glucose uptake during muscle contraction (Jessen & Goodyear, 2005; Rose & Richter, 2005). Based on the arguments outlined above, Rac1 is one such candidate. The present study therefore aimed to investigate the involvement of Rac1 in in vivo exercise‐induced glucose uptake, as well as the underlying mechanisms.
Methods
Tetracycline‐inducible muscle‐specific Rac1 knockout (mKO) mice
Inducible muscle‐specific male and female Rac1 mKO mice were generated as described previously (Sylow et al. 2013 b). In brief, Rac1 floxed mice (Chrostek et al. 2006) were crossed with mice containing a tetracycline‐controlled transactivator coupled to the human skeletal muscle α‐actin promoter, which drives the muscle‐specific expression of the Cre recombinase (Rao & Monks, 2009). Control wild‐type (WT) mice were littermates carrying the Cre recombinase or the floxed Rac1 gene on none, one or both alleles (excluding combined Cre and floxed Rac1). Rac1 mKO mice were homozygous for the floxed Rac1 gene and either homozygous or heterozygous for the Cre recombinase. Rac1 mKO was induced at 10–14 weeks of age by adding doxycycline in the drinking water (1 g l−1; Sigma‐Aldrich, St Louis, MO, USA) for 3 weeks followed by a washout period of 3 weeks.
All animals were maintained under a 12:12 h light/dark cycle and received standard rodent chow diet (Altromin no. 1324; Chr. Pedersen, Ringsted, Denmark) and water ad libitum. All experiments were approved by the Danish Animal Experimental Inspectorate and conform with the principles of UK regulations as described by Grundy (2015).
Acclimatization to treadmill and maximal running capacity test
All mice were acclimatized to the treadmill for 3 × 5 min at 10 m min−1 and 2 × 5 min at 16 m min−1 at 0° incline during the week prior to the maximal running capacity test. The test was performed at 10° incline beginning with 5 min of warm up at 10 m min−1, after which speed was increased by ∼1.2 m min−1 every 1 min until exhaustion. Testing was performed blinded.
Glycogen‐depleted maximal running capacity test
To investigate the effects of low muscle glycogen on maximal running capacity, WT and Rac1 mKO mice were exercised for 30 min at 75% of their maximal running capacity. This exercise bout almost depletes muscle glycogen stores to an equal extent in WT and Rac1 KO mice (data not shown). Following exercise, mice were left to recover for 2.5 h without access to food and a maximal running capacity test was performed as described.
Tissue specific 2‐deoxyglucose (DG) uptake measurements during treadmill running
Each mouse was exercised (∼16 m min−1 on average) at a relative work load corresponding to 65% of its maximum running capacity for 20 min at 10° incline. To determine 2‐DG uptake in muscle and brain tissue, 2‐[3H]DG (Perkin Elmer, Boston, MA, USA) was injected i.p. in a bolus of saline containing 0.1 mm 2‐DG and 60 μCi ml−1 2‐[3H]DG corresponding to ∼12 μCi/mouse (800 μl injected saline volume/100 g body weight) into fed WT or Rac1 mKO mice immediately before the onset of exercise. Control mice were placed on a still treadmill for the same amount of time. During exercise or rest, mice were removed from the treadmill (∼1 min) and blood samples were collected from the tail vein prior to and after 10 and 20 min and analysed for glucose concentration. At 10 and 20 min, blood samples were also analysed for specific 2‐[3H]DG tracer activity. After 20 min, mice were killed by cervical dislocation, and soleus, quadriceps, tibialis anterior and gastrocnemius muscles were excised and quickly frozen in liquid nitrogen and stored at −80°C until further processing. For the high‐intensity experiment, mice were acclimatized as described above and exercised for 10 min at 20° incline at 85% of their maximal running capacity. Tissue specific 2‐DG‐6‐phosphate accumulation was measured as described previously (Fueger et al. 2004) by precipitation of phosphorylated 2‐DG, using 0.1 m Ba(OH)2 and 0.1 m ZnSO4. The total tissue 2‐[3H]DG tracer activity found in 2‐DG‐6‐phosphate was divided by the area under the curve of the mean specific activity at 10 min and 20 min and, for glucose, at 0, 10 and 20 min [for the high‐intensity experiment, specific activity only at (end) 10 min was used for the calculations]; injected 3H labelled 2‐DG tracer or plasma glucose was identical between genotypes (data not shown). This was related to muscle weight and the time to obtain the tissue‐specific 2‐DG uptake (μmol g−1 h−1). Percentage increase by exercise was calculated by relating the exercise‐stimulated values to the basal control values for the specific genotype group.
Immunohistochemistry on cryosections for GLUT4 analysis
Staining of GLUT4 and α‐sarcoglycan was carried out on 12 μm cryosections obtained from Tissue‐Tek (Sakura Finetek USA, Inc., Torrance, CA, USA) embedded tibialis anterior muscle of basal or treadmill exercised WT and Rac1 mKO mice (from a subgroup of the mice that were used for 2‐[3H]DG uptake measurements). Cryosections were fixed for 30 min in ice‐cold 4% Zamboni buffer (4% paraformaldehyde, 0.15% picric acid, 0.1 m Sorensen's phosphate buffer, pH 7.3) and washed 3 × 10 min with phosphate‐buffered saline (PBS) and incubated for 2 h with primary antibodies raised against GLUT4 (rabbit polyclonal; #PA523052; Thermo Scientific, Waltham, MA, USA) and α‐sarcoglycan (mouse monoclonal, #IVD3(1)A9; Developmental Studies Hybridoma Bank, Iowa City, IA, USA). After primary antibody incubation, sections were washed 3 × 10 min in PBS and incubated with secondary antibody conjugated to Alexa 488 (anti‐rabbit) and 568 (anti‐mouse) for 1 h followed by another 3 × 10 min wash. Subsequently, the cryosections were mounted in Vectashield (Vector Laboratories, Inc., Burlingame, CA, USA). Negative controls were performed by incubating cryosections in the absence of primary antibodies. Microscope alignment was tested prior to image collection on each day using 5 μm fluorescent beads and images were acquired on the confocal microscope by recording a z‐stack from the top to the bottom of a bead, images spaced 0.10 μm apart in the z‐plane. Images were collected using a LSM710 microscope (Carl Zeiss, Oberkochen, Germany) through a 63×/1.40 oil DIC Plan‐Apochromat objective at 20°C and analysed using Zen software (Carl Zeiss). The amount of GLUT4 protein at the plasma membrane was calculated at eight different locations across the plasma membrane of one muscle fibre by taking the ratio of the quantified mean intensity of GLUT4 to α‐sarcoglycan staining in a 5 μm line drawn perpendicular through the plasma membrane. Care was taken not to quantify areas of the membrane containing unfused GLUT4 vesicles (visible as distinct green dots in close vicinity to the plasma membrane at the resolution of the confocal microscope) such that only the fraction of GLUT4 that was fused with the plasma membrane was quantified. The average of eight fibres from each mouse was used for data analysis. All image collections and quantifications were performed blinded. Following analysis, Tissue‐Tek was mechanically removed from the tibialis anterior muscles and 2‐DG uptake (n = 5 or 6 for each condition) was measured as described above.
Immunohistochemistry on cryosections for capillary/fibre ratio analysis
Staining of capillaries was performed on 12 μm cryosections (cross‐sections) on Tissue‐Tek embedded tibialis anterior muscle of WT and Rac1 mKO mice using Biotinylated Griffonia (Bandeiraea) Simplicifolia Lectin 1 (Vector Laboratories) as primary label and Streptavidin/FITC (Dako, Glostrup, Denmark) as secondary label. Images were collected using an Axioplan 2 Universal microscope with Axiophot 2 Photo Module (Carl Zeiss) through a Plan‐NEOFLUAR 20×/0.05 lens (Carl Zeiss). The mean capillary‐to‐fibre ratio was calculated using ImageJ, version 1.47 (National Institutes of Health, Bethesda, MD, USA) as described previously (Baum et al. 2013). Image collections and quantifications were performed blinded.
Muscle analysis
Muscle tissue was pulverized in liquid nitrogen and homogenized 2 × 30 s at 30 Hz using a Tissuelyser II with stainless steel grinding balls (Qiagen, Valencia, CA, USA) in 50 mm Hepes (pH 7.5), 150 mm NaCl, 20 mm sodium pyrophosphate, 20 mm β‐glycerophosphate, 10 mm NaF, 2 mm sodium orthovanadate, 2 mm EDTA, 1% NP‐40, 10% glycerol, 2 mm phenylmethanesulfonyl fluoride, 1 mm MgCl2, 1 mm CaCl2, 10 μg ml−1 leupeptin, 10 μg ml−1 aprotinin and 3 mm benzamidine. After rotation end‐over‐end for 30 min, lysate supernatants were collected by centrifugation (13,000 g) for 20 min at 4°C.
Immunoblotting
Lysate protein concentrations were measured using the bicinchoninic acid method with BSA as standard (Pierce, Rockford, IL, USA). Total protein and phosphorylation levels of relevant proteins were determined by standard immunoblotting techniques loading equal amounts of protein. The primary antibodies used were p‐AMPKThr172 (#2535), actin (#8456), cytochrome C (#12963), p‐AktSer474 (#4051), p‐eEF2Thr57 (#2331), hexokinase II (#2106) (Cell Signaling Technology, Beverly, MA, USA), mitochondria complex I and II (Molecular Probes, Invitrogen, Carlsbad, CA, USA) and Rac1 (#610650; BD Biosciences, Clontech, Palo Alto, CA, USA). Poly(vinylidene difluoride) membranes (Immobilon Transfer Membrane; Millipore, Billerica, MA, USA) were blocked in TBS‐Tween 20 containing 2% skim milk or 5% BSA protein for 1 h at room temperature. Membranes were incubated with primary antibodies overnight at 4°C, followed by incubation with horseradish peroxidase‐conjugated secondary antibody for 30 min at room temperature. Bands were visualized using ChemiDocTM MP Imaging System (Bio‐Rad, Hercules, CA, USA) and enhanced chemiluminescence (ECL+; Amersham Biosciences, Piscataway, NJ, USA).
AMPK activity assay
Isoform‐specific AMPK activity was measured in the presence of 200 μm AMP in immunoprecipitates from 200 μg of muscle lysate protein using anti‐α1 (GenScript Corporation, Piscataway, NJ, USA) and anti‐α2 (#19131; Santa Cruz Biotechnology, Santa Cruz, CA, USA) antibodies as described previously (Kjobsted et al. 2015) and the AMARA peptide (HAMARAASAAAIARRR; 100 μm) as substrate (Hayashi et al. 2000). α2β2γ1 activity was measured by overnight α2 immunoprecipitation. The remaining lysates were then incubated with the α1 antibody to pull down the α1β2γ1 complex.
L6 and C2C12 cell culture and Rac1 activity
L6 muscle cells were maintained and differentiated into multinucleated myotubes as described previously (JeBailey et al. 2004). C2C12 muscle cells were maintained and differentiated as reported previously (Miyatake et al. 2016). For all experiments, myotubes were incubated in serum‐free α‐minimal essential medium (Dulbecco's modified Eagle's medium for C2C12) containing 5 mmol l−1 glucose for 3 h prior to stimulation with insulin (100 nm, 10 min stimulation), isoproterenol (20 μm, 20 min stimulation), caffeine (5 mm, 20 min stimulation) or electrical pulse stimulation (24 ms pulse, 1 Hz repetition for 1 h). Following stimulation, cells were rinsed in PBS and the cells were lysed in lysis buffer (Cytoskeleton Inc., Denver, CO, USA) and centrifuged for 1 min at 10,000 g. Rac1 activities were measured in the supernatant using a commercially available Rac1 activation assay kit (BK 126; Cytoskeleton Inc.). In brief, immediately after centrifugation, the protein concentration in the lysates were determined (<3 min) and an equal amount of protein was loaded onto wells coated with the p‐21‐binding domain domain of PAK, which only binds Rac1 in its GTP‐bound form. The amount of GTP‐bound Rac1 was detected using a colorimetric assay.
Statistical analysis
Results are shown as the mean ± SEM. Statistical testing was performed using t tests or two‐way (repeated measurements when applicable) ANOVA as appropriate. Tukey's post hoc test was performed when ANOVA revealed significant main effects. Statistical evaluation was performed using Sigmaplot, version 11.0 (Systat Software Inc., Chicago, IL, USA). P < 0.05 was considered statistically significant.
Results
AMPK activity is normally induced by treadmill running in Rac1 mKO mouse muscle
In Rac1 mKO mice, Rac1 protein expression was reduced by 70% in soleus muscle and by 85–90% in gastrocnemius and quadriceps muscle compared to WT control mice (Fig. 1 A and C). We speculate that the remaining Rac1 content in the Rac1 mKO muscles is a result of contamination of the whole‐muscle lysate by non‐muscle cell and tissue types, including tendons, nerves, vascular tissue, blood cells, resident macrophages and adipose tissue, in which Rac1 is highly expressed (L. Sylow, unpublished observations). Although previous studies in C2C12 muscle cells have found Rac1 to be downstream of AMPK (Lee et al. 2008), we previously observed normal Rac1 activation during exercise in AMPK‐deficient mice (Sylow et al. 2013 b). In the present study, p‐AMPKThr172 increased by ∼30% in quadriceps and gastrocnemius but not in the soleus following exercise at 65% maximum intensity (Fig. 1 B and C). No effect of Rac1 mKO on p‐AMPKThr172 was observed in any of the analysed muscles (Fig. 1 B), although basal p‐AMPKThr172 tended to be increased in Rac1 mKO soleus. Consistent with this, exercise‐induced AMPKα2 activity reached similar levels in Rac1 mKO and WT mice. AMPKα1 activity was less responsive to exercise than AMPKα2 (Fig. 1 D), as has been reported previously (Maarbjerg et al. 2009). These findings show that Rac1 is most probably not a regulator of AMPK activity in skeletal muscle during exercise in vivo.
Figure 1. Exercise‐stimulated glucose uptake is reduced in Rac1 mKO mice independent of AMPK .
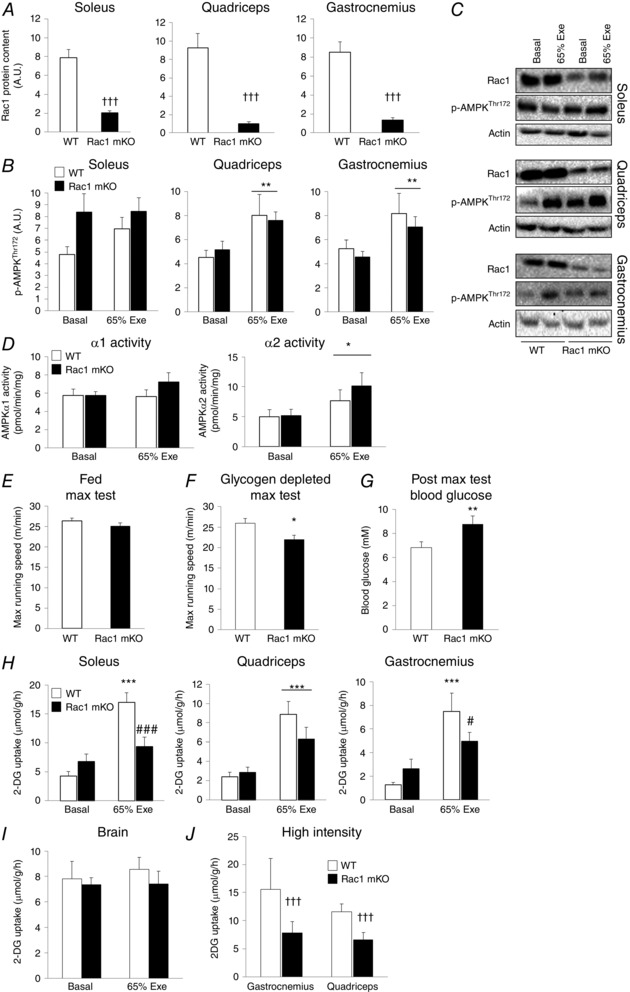
A, quantification of Rac1 protein expression in skeletal muscle of Rac1 mKO and WT littermate control mice (n = 28 or 29). B, quantification of basal and exercise‐stimulated (65% Exe; 65% of individual maximal running speed, 20 min, 10% incline) p‐AMPKThr172 in skeletal muscle of Rac1 mKO and WT littermate control mice (n = 12–16). C, representative western blots of basal and treadmill exercise‐stimulated (65% Exe) Rac1, p‐AMPKThr172 and actin (loading control) in skeletal muscle of Rac1 mKO and WT mice. D, AMPKα1 and α2 activity in the basal state or following exercise (65% Exe) (n = 11–14) E, maximal running speed of fed Rac1 mKO and WT littermate control mice (n = 27 or 28). F, maximal running speed of glycogen‐depleted Rac1 mKO and WT littermate control mice (n = 8). G, blood glucose following the glycogen‐depleted maximal running capacity test (n = 8). H, basal and exercise‐stimulated (65% Exe; 65% of individual maximum running speed, 20 min) 2‐DG uptake in soleus, quadriceps and gastrocnemius muscle (n = 12–16) and (I) the brain from Rac1 mKO and WT littermate mice (n = 12–16). J, exercise‐stimulated 2‐DG uptake in WT (n = 3) or Rac1 mKO (n = 5) mice during a short bout of high‐intensity treadmill exercise (10 min, 85% maximum running capacity, 20% incline). Significant effect of exercise stimulation is indicated: * P < 0.05, ** P < 0.01, ** P < 0.001. Significant effect of genotype is indicated: †† P < 0.01, ††† P < 0.001. Significant interaction between exercise and genotype on 2‐DG uptake is indicated: # P < 0.05, ### P < 0.001. Values are the mean ± SEM.
Rac1 regulates exercise‐induced glucose uptake in skeletal muscle
In the fed state, Rac1 mKO and WT mice performed similarly in a maximal running test (Fig. 1 E). To test whether this was also the case in a glycogen‐depleted state, the maximal running capacity test was performed 2.5 h following a 30 min 75% exercise bout. In the glycogen‐depleted state, the exercise capacity of Rac1 mKO mice was reduced by 20% compared to WT (Fig. 1 F). Rac1 mKO mice also exhibited 30% higher blood glucose following the maximal running capacity test in the glycogen‐depleted state compared to WT littermates (Fig. 1 G), which was not observed when treadmill running was performed in the fed state.
Exercise increased glucose uptake by 350 and 450% in WT soleus and gastrocnemius, respectively. This response was completely prevented in soleus muscle and reduced by 85% in the gastrocnemius of Rac1 mKO mice (Fig. 1 H). Likewise, the exercise‐induced 250% increment in 2‐DG uptake in quadriceps tended (P = 0.15) to be lower (65%) in Rac1 mKO. As expected, 2‐DG uptake into the brain, an internal control, was unaffected by genotype or exercise (Fig. 1 I). To further establish a role for Rac1 in exercise‐induced 2‐DG uptake, we applied a high‐intensity exercise protocol (85% maximum running capacity, 20% incline, 10 min) to a small number of mice. Similar to the 65% intensity protocol, Rac1 mKO mice displayed a reduced glucose uptake during high‐intensity exercise (Fig. 1 J). Importantly, the rate of plasma appearance of the i.p. injected 3H labelled 2‐DG tracer or plasma glucose was identical between genotypes (data not shown). Taken together, these results show that Rac1 is a major regulator of exercise‐stimulated glucose uptake in skeletal muscle.
KO of Rac1 blocks GLUT4 translocation in muscle
Glucose uptake is regulated by three steps: glucose delivery to the exercising muscles (determined by plasma glucose concentration, capillarization and blood flow), glucose transport (GLUT4 translocation) and intracellular metabolism of glucose (Richter & Hargreaves, 2013). To understand the underlying mechanism by which Rac1 regulates exercise‐mediated glucose uptake, we analysed the elements mediating each of these three steps. We developed an assay to measure exercise‐induced GLUT4 translocation using immunohistochemistry on cryosections from WT and Rac1 mKO tibialis anterior (TA) muscles (see detailed description in the Methods). Exercise increased the abundance of membrane associated GLUT4 relative to α‐sarcoglycan by 42% in WT TA muscle, whereas no significant increase could be detected in Rac1 mKO muscle (Fig. 2 A–C). To determine whether glucose uptake rates in TA of Rac1 mKO mice were similarly reduced, as it was in other muscles, Tissue‐Tek was removed and 2‐DG uptake was analysed on the remaining part of the TA muscle. In accordance with the GLUT4 translocation results, exercise‐stimulated glucose uptake in TA was reduced by 65% in the Rac1 mKO muscle compared to WT (Fig. 2 D). 2‐DG uptake positively correlated with GLUT4 content in the plasma membrane of the analysed muscles (Fig. 2 E), suggesting that GLUT4 intensity at the plasma membrane does in fact reflect glucose uptake rates. These findings thus suggest a major role for Rac1 in the regulation of exercise‐stimulated GLUT4 translocation and glucose uptake in skeletal muscle.
Figure 2. Rac1 regulated exercise‐induced GLUT4 translocation .
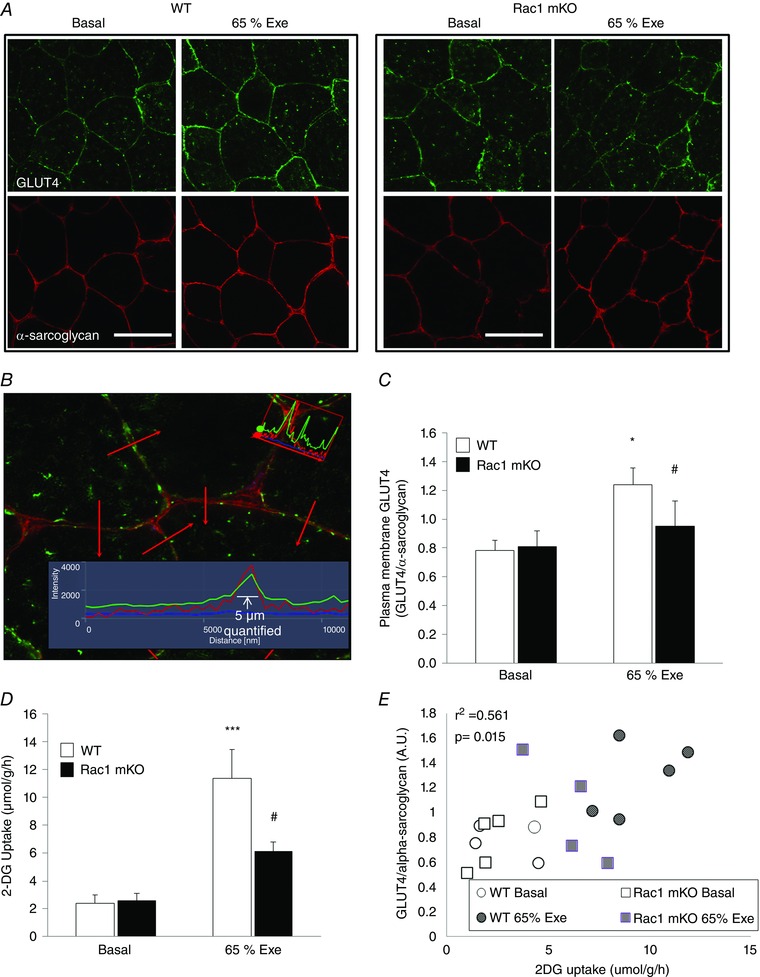
A, representative images showing cryosections of tibialis anterior muscle (cross sections) from basal and exercise‐stimulated Rac1 mKO and WT littermate mice stained with antibodies against GLUT4 (green) and α‐sarcoglycan (red). Scale bar = 50 μm. B, illustration of the quantification approach. Red arrows indicate the locations of the lines across and perpendicular to the plasma membrane of which 5 μm were analysed and quantified. C, quantification of the intensity of plasma membrane GLUT4 relative to α‐sarcoglycan in the basal and exercise‐stimulated (65% of individual maximal running speed, 20 min) state of WT and Rac1 mKO tibialis anterior muscle (n = 4–6). D, 2‐DG uptake in basal and exercise‐stimulated (65% of individual maximum running speed, 20 min) tibialis anterior muscle (n = 5 or 6). E, correlation between plasma membrane GLUT4 (GLUT4/α‐sarcoglycan) and 2‐DG uptake in basal and exercise‐stimulated tibialis anterior muscle. Included are only samples analysed for both parameters in the same muscle (n = 4 or 5). Significant difference between basal and exercise‐stimulated intensity of GLUT4/α‐sarcoglycan or 2‐DG uptake is indicated: * P < 0.05. Significant interaction between exercise and genotype is indicated: # P < 0.05. Values are the mean ± SEM.
Next, the expression of key proteins involved in intracellular handling of glucose was investigated because intracellular metabolism of incoming glucose may be limiting for glucose uptake during exercise in mouse muscle (Fueger et al. 2004). Neither mitochondrial respiratory chain proteins, such as cytochrome C or complex I or II, nor hexokinase II were altered in Rac1 mKO muscles (Fig. 3 A). We also investigated whether capillary density was reduced in Rac1 mKO muscle which could impair glucose uptake. If anything, capillary density tended to be higher in Rac1mKO than WT muscles (Fig. 3 B). Thus, neither decreased capillary density, nor decreased protein expression of key metabolic enzymes appears to contribute to decreased glucose uptake during exercise in Rac1 mKO muscle.
Figure 3. Rac1 does not alter mitochondrial proteins, capillarization or glycogen breakdown .
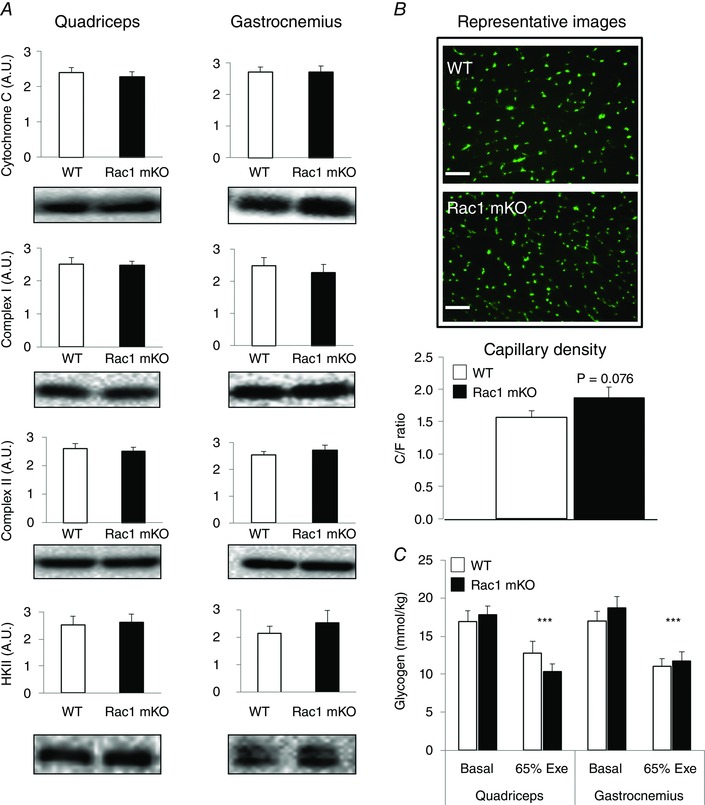
A, quantifications and representative blots of protein expression of cytochrome C, complex I, complex II and hexokinase (HK) II in mouse quadriceps and gastrocnemius muscles from Rac1 mKO and WT littermate mice (n = 14–19). B, representative images showing cryosections of tibialis anterior muscle from Rac1 mKO and WT littermate mice stained with lectin 1 (stains capillaries), with quantification of the capillary density shown below. Scale bar = 50 μm. (n = 7–9). C, glycogen concentration in quadriceps and gastrocnemius muscles from WT and Rac1 mKO mice at rest or following exercise (65% Exe) (n = 10–15). Significant difference between basal and exercise‐stimulated glycogen level is indicated: *** P < 0.001. Values are the mean ± SEM.
Because Rac1 mKO mice take up less glucose during exercise but display similar maximal running speed in the fed state, we reasoned that Rac1 mKO mice may utilize more glycogen during exercise to meet the demand for energy. However, muscle glycogen content was equally reduced by ∼30% following exercise in quadriceps and gastrocnemius muscle in both genotypes (Fig. 3 C).
Rac1 is regulated by insulin and electrical pulse stimulation but not by Ca2+ or β‐adrenergic stimulation in muscle cells
The mechanism that regulates Rac1 activity during exercise is not well understood. We recently showed that muscle stretching activates Rac1 and is a factor in the full stimulation of contraction‐stimulated glucose uptake (Sylow et al. 2015; Jensen et al. 2014). Hence, other stimuli involved in the regulation of glucose transport could also act to activate Rac1 during exercise, such as intracellular calcium (Etgen et al. 1997) and β‐adrenergic (Sato et al. 2014) stimulation. To test these possibilities, we measured Rac1‐GTP binding (i.e. activation) in L6 myotubes in response to insulin (positive control), isoproterenol (β‐adrenergic agonist) and caffeine (increases sarcoplasmic reticulum calcium‐release through the ryanodine receptors similar to excitation–contraction coupling). Insulin but not isoproterenol or caffeine increased Rac1‐GTP binding (Fig. 4 A). On the other hand, Rac1 GTP binding significantly increased in C2C12 myotubes in response to electrical pulse stimulation (Fig. 4 B). These findings suggest that the electrical pulse stimulation inducing muscle contraction activates Rac1, and this is not emulated by directly elevating intracellular calcium or β‐adrenergic stimulation.
Figure 4. Rac1 is regulated by muscle contraction (=mechanical stimulus), not calcium or beta‐adrenergic stimulation .
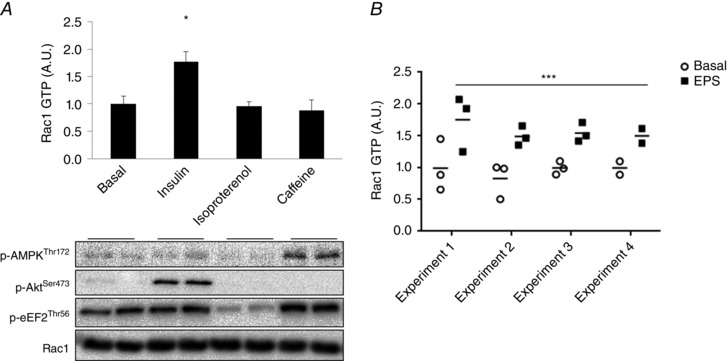
A, representative blots and bar graph showing Rac1 GTP binding (= activity) in the basal state or in response to insulin (100 nm, 10 min stimulation), isoproterenol (20 μm, 20 min stimulation) or caffeine (5 mm, 20 min stimulation) in L6 myotubes (n = 5–6). B, Rac1‐GTP binding in response to electrical pulse stimulation (EPS) in C2C12 myotubes (1 h stimulation, 24 ms, 1 Hz, four independent experiments). Significant difference between basal and stimulated Rac1‐GTP binding is indicated: * P < 0.05, *** P < 0.001. Values are the mean ± SEM.
Discussion
In the present study, we describe a systematic series of experiments investigating the role of Rac1 in glucose uptake during exercise. Our data show that Rac1 is an essential contributor to the full exercise‐stimulated glucose uptake by regulating GLUT4 translocation in mouse skeletal muscle in vivo. These findings are consistent with previous data showing that ex vivo electrically‐induced contraction‐stimulated 2‐DG transport partially relies on Rac1 (Sylow et al. 2013 b).
The molecular mechanisms that activate Rac1 during exercise remain elusive. Previous data suggest that Rac1 is not controlled by AMPK because Rac1 activation is normal in muscles from AMPK KD mice following exercise (Sylow et al. 2013 b). Also, AMPK is probably not regulated by Rac1 because AMPK phosphorylation and AMPKα2 activation during exercise were normal in Rac1 mKO mice. In agreement with such findings, AICAR (5‐aminoimidazole‐4‐carboxyamide ribonucleoside)‐induced glucose transport, which stimulates glucose uptake through activation of AMPK, is not affected in Rac1 mKO muscles (Sylow et al. 2013 b). However, it is uncertain whether only a small amount of Rac1 (30–10% remaining in the present study) is required for AMPK activation, and thus a role for Rac1 cannot be completely ruled out by the present study. Based on our findings, Rac1 and AMPK appear to regulate glucose uptake via distinct mechanisms.
Because AMPK is probably not involved in Rac1 regulation during exercise, we investigated whether other AMPK‐independent stimuli that occur during muscle contraction could activate Rac1 in L6 muscle cells in which we directly analysed Rac1 GTP binding. We found that neither calcium, nor β‐adrenergic stimulation directly activated Rac1. Another mechanism that could activate Rac1 during exercise is mechanical stress on the plasma membrane that occurs during exercise. Indeed, muscle stretching activated Rac1 (Zhou et al. 2007; Sylow et al. 2013 b) and stretching increased glucose transport in muscle (Chambers et al. 2009). Mechanical stress appears to be an important signal to glucose uptake during exercise because, if mechanical stress on the muscles is prevented, the increment in glucose uptake with contraction is significantly reduced. In agreement, we show that electrical pulse stimulation increased Rac1 GTP binding. This shows that mechanical plasma membrane stress is an important signal for glucose transport during contraction (Ihlemann et al. 1999; Jensen et al. 2014; Sylow et al. 2015) and our findings suggest that Rac1 cannot be activated by β‐adrenergic signalling or a rise in cytosolic Ca2+ (caffeine‐induced) alone.
Rac1 probably mediates the stretch‐sensitive component of contraction‐stimulated glucose transport because Rac1 inhibition did not affect glucose uptake during muscle contraction when force development was prevented (Sylow et al. 2015). By contrast, AMPK ablation completely abolished glucose transport during these conditions (Jensen et al. 2014), suggesting a role for AMPK but not Rac1 during non‐stretch conditions. Conversely, AMPK does not participate in stretch‐stimulated glucose uptake (Jensen et al. 2014). We interpret these findings to imply that AMPK acts on glucose transport via metabolically activated pathways, whereas Rac1 facilitates glucose transport via stretch‐activated pathways. Future studies should investigate glucose uptake in the absence of both Rac1 and AMPK signalling to fully understand the contribution of these signalling pathways to glucose uptake during exercise in skeletal muscle.
Similar to the upstream activators of Rac1, the downstream signalling pathways that regulate Rac1‐dependent glucose transport are currently unknown. Rac1 is a major regulator of the actin cytoskeleton (Ridley et al. 1992; Chiu et al. 2011). In muscle cells, Rac1‐dependent actin remodelling was necessary for GLUT4 vesicles to fuse with the plasma membrane and allow glucose to enter the cells (Khayat et al. 2000). Interestingly, the actin‐depolymerizing agent, latrunculin B, reduced electrically‐induced contraction‐stimulated glucose uptake in soleus and extensor digitorum longus muscles (Sylow et al. 2013 b), suggesting that the actin‐cytoskeleton may be necessary for normal regulation of glucose transport during exercise. Combined with the known role of Rac1 in insulin‐induced glucose transport, Rac1 appears to play an important role in orchestrating GLUT4 translocation in muscle as a convergence point for insulin and contraction signalling.
In summary, we found that Rac1 is an important regulator of exercise‐induced GLUT4 translocation and glucose uptake in mouse skeletal muscle. Future studies should aim to determine the upstream and downstream signalling of Rac1 with the aim of understanding the molecular mechanisms regulating glucose transport.
Additional information
Competing interests
The authors declare that they have no competing interests.
Funding
The present study was supported by the Danish Research Council (grant number DFF–4004‐00233 to LS); the Danish Medical Research Council (grant number 0602–02273B to EAR); the Novo Nordisk Foundation (grant number 10641 to TEJ); the Danish Research Council (grant number 1323‐00200A to TEJ); and the Lundbeck Foundation (grant number 2011–8205 to EAR).
Author contributions
LS, TEJ and EAR designed the study. LS conducted the experiments, performed the laboratory analysis and wrote the manuscript. TEJ, MK, LLVM, ILN, PS, TP, EAR and PB took part in conducting the experiments and/or developing the methods. AK participated in discussions and directed cellular studies. All authors commented on and approved the final version of the manuscript. E.A.R. is the guarantor of this work and, as such, has full access to all the data in the study and takes responsibility for the integrity of the data and the accuracy of the data analysis. All authors agree to be accountable for all aspects of the work, ensuring that questions related to the accuracy or integrity of any part are appropriately investigated and resolved. All persons designated as authors qualify for authorship, and all those who qualify for authorship are listed.
Acknowledgements
We acknowledge the skilled technical assistance of Betina Bolmgren, Irene Bech Nielsen, Marie Møller Christensen and Jesper Birk (Molecular Physiology Group, Department of Nutrition, Exercise and Sports, University of Copenhagen, Denmark). Rac1 floxed mice were a kind gift from Cord Brakebusch (Biomedical Institute, BRIC, University of Copenhagen, DK). Tetracycline‐activated Cre mice were a kind gift from Ashley Monks (Department of Psychology, University of Toronto Mississauga, CA).
References
- Baum O, Vieregge M, Koch P, Gul S, Hahn S, Huber‐Abel FA, Pries AR & Hoppeler H (2013). Phenotype of capillaries in skeletal muscle of nNOS‐knockout mice. Am J Physiol Regul Integr Comp Physiol 304, R1175–R1182. [DOI] [PubMed] [Google Scholar]
- Chambers MA, Moylan JS, Smith JD, Goodyear LJ & Reid MB (2009). Stretch‐stimulated glucose uptake in skeletal muscle is mediated by reactive oxygen species and p38 MAP‐kinase. J Physiol 587, 3363–3373. [DOI] [PMC free article] [PubMed] [Google Scholar]
- Chiu TT, Jensen TE, Sylow L, Richter EA & Klip A (2011). Rac1 signalling towards GLUT4/glucose uptake in skeletal muscle. Cell Signal 23, 1546–1554. [DOI] [PubMed] [Google Scholar]
- Chrostek A, Wu X, Quondamatteo F, Hu R, Sanecka A, Niemann C, Langbein L, Haase I & Brakebusch C (2006). Rac1 is crucial for hair follicle integrity but is not essential for maintenance of the epidermis. Mol Cell Biol 26, 6957–6970. [DOI] [PMC free article] [PubMed] [Google Scholar]
- Douen AG, Ramlal T, Rastogi S, Bilan PJ, Cartee GD, Vranic M, Holloszy JO & Klip A (1990). Exercise induces recruitment of the ‘insulin‐responsive glucose transporter’. Evidence for distinct intracellular insulin‐ and exercise‐recruitable transporter pools in skeletal muscle. J Biol Chem 265, 13427–13430. [PubMed] [Google Scholar]
- Etgen GJ Jr, Fryburg DA & Gibbs EM (1997). Nitric oxide stimulates skeletal muscle glucose transport through a calcium/contraction‐ and phosphatidylinositol‐3‐kinase‐independent pathway. Diabetes 46, 1915–1919. [DOI] [PubMed] [Google Scholar]
- Fentz J, Kjobsted R, Birk JB, Jordy AB, Jeppesen J, Thorsen K, Schjerling P, Kiens B, Jessen N, Viollet B & Wojtaszewski JF (2015). AMPKalpha is critical for enhancing skeletal muscle fatty acid utilization during in vivo exercise in mice. FASEB J 29, 1725–1738. [DOI] [PubMed] [Google Scholar]
- Fueger PT, Hess HS, Posey KA, Bracy DP, Pencek RR, Charron MJ & Wasserman DH (2004). Control of exercise‐stimulated muscle glucose uptake by GLUT4 is dependent on glucose phosphorylation capacity in the conscious mouse. J Biol Chem 279, 50956–50961. [DOI] [PubMed] [Google Scholar]
- Grundy D (2015). Principles and standards for reporting animal experiments in The Journal of Physiology and Experimental Physiology . J Physiol 593, 2547–2549. [DOI] [PMC free article] [PubMed] [Google Scholar]
- Hall A & Nobes CD (2000). Rho GTPases: molecular switches that control the organization and dynamics of the actin cytoskeleton. Philos Trans R Soc Lond B Biol Sci 355, 965–970. [DOI] [PMC free article] [PubMed] [Google Scholar]
- Hayashi T, Hirshman MF, Fujii N, Habinowski SA, Witters LA & Goodyear LJ (2000). Metabolic stress and altered glucose transport: activation of AMP‐activated protein kinase as a unifying coupling mechanism. Diabetes 49, 527–531. [DOI] [PubMed] [Google Scholar]
- Hordijk PL (2006). Regulation of NADPH oxidases: the role of Rac proteins. Circ Res 98, 453–462. [DOI] [PubMed] [Google Scholar]
- Ihlemann J, Ploug T, Hellsten Y & Galbo H (1999). Effect of tension on contraction‐induced glucose transport in rat skeletal muscle. Am J Physiol Endocrinol Metab 277, E208–E214. [DOI] [PubMed] [Google Scholar]
- JeBailey L, Rudich A, Huang X, Di Ciano‐Oliveira C, Kapus A & Klip A (2004). Skeletal muscle cells and adipocytes differ in their reliance on TC10 and Rac for insulin‐induced actin remodeling. Mol Endocrinol 18, 359–372. [DOI] [PubMed] [Google Scholar]
- JeBailey L, Wanono O, Niu W, Roessler J, Rudich A & Klip A (2007). Ceramide‐ and oxidant‐induced insulin resistance involve loss of insulin‐dependent Rac‐activation and actin remodeling in muscle cells. Diabetes 56, 394–403. [DOI] [PubMed] [Google Scholar]
- Jensen TE, Sylow L, Rose AJ, Madsen AB, Angin Y, Maarbjerg SJ & Richter EA (2014). Contraction‐stimulated glucose transport in muscle is controlled by AMPK and mechanical stress but not sarcoplasmatic reticulum Ca(2+) release. Mol Metab 3, 742–753. [DOI] [PMC free article] [PubMed] [Google Scholar]
- Jessen N & Goodyear LJ (2005). Contraction signaling to glucose transport in skeletal muscle. J Appl Physiol 99, 330–337. [DOI] [PubMed] [Google Scholar]
- Khayat ZA, Tong P, Yaworsky K, Bloch RJ & Klip A (2000). Insulin‐induced actin filament remodeling colocalizes actin with phosphatidylinositol 3‐kinase and GLUT4 in L6 myotubes. J Cell Sci 113, 279–290. [DOI] [PubMed] [Google Scholar]
- Kjobsted R, Treebak JT, Fentz J, Lantier L, Viollet B, Birk JB, Schjerling P, Bjornholm M, Zierath JR & Wojtaszewski JF (2015). Prior AICAR stimulation increases insulin sensitivity in mouse skeletal muscle in an AMPK‐dependent manner. Diabetes 64, 2042–2055. [DOI] [PubMed] [Google Scholar]
- Kristiansen S, Hargreaves M & Richter EA (1996). Exercise‐induced increase in glucose transport, GLUT‐4, and VAMP‐2 in plasma membrane from human muscle. Am J Physiol Endocrinol Metab 270, E197–E201. [DOI] [PubMed] [Google Scholar]
- Lauritzen HP, Galbo H, Toyoda T & Goodyear LJ (2010). Kinetics of contraction‐induced GLUT4 translocation in skeletal muscle fibers from living mice. Diabetes 59, 2134–2144. [DOI] [PMC free article] [PubMed] [Google Scholar]
- Lee YM, Lee JO, Jung JH, Kim JH, Park SH, Park JM, Kim EK, Suh PG & Kim HS (2008). Retinoic acid leads to cytoskeletal rearrangement through AMPK‐Rac1 and stimulates glucose uptake through AMPK‐p38 MAPK in skeletal muscle cells. J Biol Chem 283, 33969–33974. [DOI] [PMC free article] [PubMed] [Google Scholar]
- Maarbjerg SJ, Jorgensen SB, Rose AJ, Jeppesen J, Jensen TE, Treebak JT, Birk JB, Schjerling P, Wojtaszewski JF & Richter EA (2009). Genetic impairment of AMPKalpha2 signaling does not reduce muscle glucose uptake during treadmill exercise in mice. Am J Physiol Endocrinol Metab 297, E924–E934. [DOI] [PubMed] [Google Scholar]
- Marette A, Burdett E, Douen A, Vranic M & Klip A (1992). Insulin induces the translocation of GLUT4 from a unique intracellular organelle to transverse tubules in rat skeletal muscle. Diabetes 41, 1562–1569. [DOI] [PubMed] [Google Scholar]
- Miyatake S, Bilan PJ, Pillon NJ & Klip A (2016). Contracting C2C12 myotubes release CCL2 in an NF‐kappaB‐dependent manner to induce monocyte chemoattraction. Am J Physiol Endocrinol Metab 310, E160–E170. [DOI] [PubMed] [Google Scholar]
- Morel F, Doussiere J & Vignais PV (1991). The superoxide‐generating oxidase of phagocytic cells. Physiological, molecular and pathological aspects. Eur J Biochem 201, 523–546. [DOI] [PubMed] [Google Scholar]
- Mu J, Brozinick JT, Jr. , Valladares O, Bucan M & Birnbaum MJ (2001). A role for AMP‐activated protein kinase in contraction‐ and hypoxia‐regulated glucose transport in skeletal muscle. Mol Cell 7, 1085–1094. [DOI] [PubMed] [Google Scholar]
- O'Neill HM, Maarbjerg SJ, Crane JD, Jeppesen J, Jorgensen SB, Schertzer JD, Shyroka O, Kiens B, van Denderen BJ, Tarnopolsky MA, Kemp BE, Richter EA & Steinberg GR (2011). AMP‐activated protein kinase (AMPK) beta1beta2 muscle null mice reveal an essential role for AMPK in maintaining mitochondrial content and glucose uptake during exercise. Proc Natl Acad Sci USA 108, 16092–16097. [DOI] [PMC free article] [PubMed] [Google Scholar]
- Rao P & Monks DA (2009). A tetracycline‐inducible and skeletal muscle‐specific Cre recombinase transgenic mouse. Dev Neurobiol 69, 401–406. [DOI] [PMC free article] [PubMed] [Google Scholar]
- Richter EA & Hargreaves M (2013). Exercise, GLUT4, and skeletal muscle glucose uptake. Physiol Rev 93, 993–1017. [DOI] [PubMed] [Google Scholar]
- Ridley AJ, Paterson HF, Johnston CL, Diekmann D & Hall A (1992). The small GTP‐binding protein rac regulates growth factor‐induced membrane ruffling. Cell 70, 401–410. [DOI] [PubMed] [Google Scholar]
- Rose AJ & Richter EA (2005). Skeletal muscle glucose uptake during exercise: how is it regulated? Physiology (Bethesda) 20, 260–270. [DOI] [PubMed] [Google Scholar]
- Sato M, Dehvari N, Oberg AI, Dallner OS, Sandstrom AL, Olsen JM, Csikasz RI, Summers RJ, Hutchinson DS & Bengtsson T (2014). Improving type 2 diabetes through a distinct adrenergic signaling pathway involving mTORC2 that mediates glucose uptake in skeletal muscle. Diabetes 63, 4115–4129. [DOI] [PubMed] [Google Scholar]
- Sylow L, Jensen TE, Kleinert M, Hojlund K, Kiens B, Wojtaszewski J, Prats C, Schjerling P & Richter EA (2013. a). Rac1 signaling is required for insulin‐stimulated glucose uptake and is dysregulated in insulin‐resistant murine and human skeletal muscle. Diabetes 62, 1865–1875. [DOI] [PMC free article] [PubMed] [Google Scholar]
- Sylow L, Jensen TE, Kleinert M, Mouatt JR, Maarbjerg SJ, Jeppesen J, Prats C, Chiu TT, Boguslavsky S, Klip A, Schjerling P & Richter EA (2013. b). Rac1 is a novel regulator of contraction‐stimulated glucose uptake in skeletal muscle. Diabetes 62, 1139–1151. [DOI] [PMC free article] [PubMed] [Google Scholar]
- Sylow L, Kleinert M, Pehmoller C, Prats C, Chiu TT, Klip A, Richter EA & Jensen TE (2014). Akt and Rac1 signaling are jointly required for insulin‐stimulated glucose uptake in skeletal muscle and downregulated in insulin resistance. Cell Signal 26, 323–331. [DOI] [PubMed] [Google Scholar]
- Sylow L, Moller LL, Kleinert M, Richter EA & Jensen TE (2015). Stretch‐stimulated glucose transport in skeletal muscle is regulated by Rac1. J Physiol 593, 645–656. [DOI] [PMC free article] [PubMed] [Google Scholar]
- Zhou Y, Jiang D, Thomason DB & Jarrett HW (2007). Laminin‐induced activation of Rac1 and JNKp46 is initiated by Src family kinases and mimics the effects of skeletal muscle contraction. Biochemistry 46, 14907–14916. [DOI] [PMC free article] [PubMed] [Google Scholar]