

Abstract
It is generally assumed that antibiotics can promote horizontal gene transfer (HGT). However, because of a variety of confounding factors that complicate the interpretation of previous studies, the mechanisms by which antibiotics modulate HGT remain poorly understood. In particular, it is unclear whether antibiotics directly regulate the efficiency of HGT, serve as a selection force to modulate population dynamics after HGT has occurred, or both. Here, we address this question by quantifying conjugation dynamics in the presence and absence of antibiotic-mediated selection. Surprisingly, we find that sub-lethal concentrations of antibiotics from the most widely used classes do not significantly increase the conjugation efficiency. Instead, our modeling and experimental results demonstrate that conjugation dynamics are dictated by antibiotic-mediated selection, which can both promote and suppress conjugation dynamics. Our findings suggest that the contribution of antibiotics to the promotion of HGT may have been overestimated. These findings have implications for designing effective antibiotic treatment protocols and for assessing the risks of antibiotic use.
Horizontal gene transfer (HGT) is a main contributor to the spread of antibiotic resistance genes1–3. Conversely, it has been generally assumed that antibiotics promote HGT4,5. One of the most common mechanisms for HGT, particularly for the transfer of plasmids such as those carrying antibiotic resistance, is conjugation2,6,7. There are two broad ways in which antibiotics can promote HGT via conjugation. First, when dosed at sub-lethal concentrations, antibiotics can increase the conjugation rate by either activating the excision of transferrable genes from the host chromosome, inducing expression of conjugation machinery, or both8–12. Second, it has been speculated, but not proven, that antibiotics can cause global cellular responses, such as changes in cell wall composition or up-regulation in key survival genes13,14, that can indirectly increase the conjugation rate15–17.
Overall conjugation dynamics are determined by two components (Fig. 1a): the rate at which conjugation occurs (the conjugation efficiency), and the subsequent growth of transconjugants. An antibiotic can affect the overall conjugation dynamics by modulating the conjugation efficiency, serving as a selection force that acts on the population dynamics after conjugation, or both (Fig. 1b and c). In past studies, quantification of the effects of antibiotics on conjugation efficiency has been confounded by a lack of decoupling between these two components18–20. As a result, there are conflicting reports on whether or not antibiotics promote conjugation21. Typically, in vitro conjugation experiments have been performed in the presence of an antibiotic, followed by a period of growth, before quantification of transconjugants16,22. The conclusion that antibiotics promote conjugation has then been based on the observed increase in transconjugants in the presence of an antibiotic as compared to the control without treatment23. Unfortunately, this experimental design cannot distinguish between antibiotic effects on conjugation efficiency versus selection dynamics, nor does it show how these effects might depend on the antibiotic concentration. In vivo and case studies have also suggested a link between conjugation-mediated transfer of resistance and antibiotic treatment, possibly as a result of antibiotic selection providing a favorable environment to enable transfer24–26. As with in vitro experiments, however, this speculation remains to be definitively proved due to experimental complexities.
Fig. 1. The potential influence of antibiotics on conjugation.
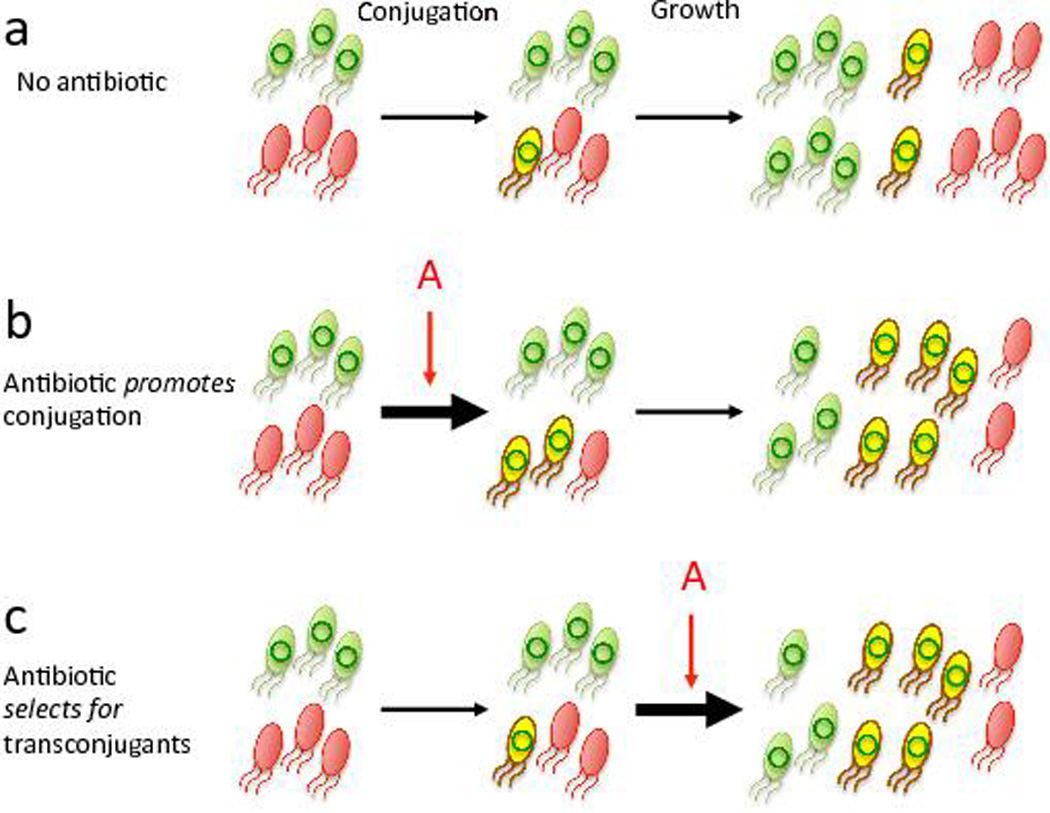
(a) Overall conjugation dynamics result from two steps: conjugation and the ensuing population dynamics of the donor (green), the recipient (red), and the transconjugant (yellow). Antibiotics can influence the conjugation dynamics by (b) modulating the conjugation efficiency or by (c) altering the population dynamics by changing the growth rates of one or more populations. Here we assume antibiotics overall promote conjugation as an illustration (b and c), compared to without any treatment (a).
Results
To determine how antibiotics affect various aspects of conjugation dynamics, it is critical to (1) decouple antibiotic-mediated induction of conjugation machinery from the global effect an antibiotic might have on the conjugation efficiency, and to (2) decouple the conjugation event from the ensuing growth dynamics. To this end, we used an engineered conjugation system27 derived from the F plasmid (Fig. 2a), wherein the conjugation machinery is constitutively expressed28,29. In this system, each donor cell (G+) carries two plasmids: an F helper plasmid (FHR) and a mobilization plasmid. FHR expresses the conjugation machinery and can mobilize any plasmid containing the oriT sequence, but is not self-transmissible. Thus, while the system is synthetic, the conjugation machinery on the F plasmid is non-engineered. The mobilization plasmid, which is transmissible by the helper plasmid, carries the oriT sequence, a gfp gene under control of a PLacZ promoter, and a kanamycin (Kan) resistance gene (kanR)30,31. Each recipient cell (R−) carries the FHR plasmid and a non-mobilizable plasmid; the non-mobilizable plasmid contains an mCherry gene under control of a PTet promoter32,33 and a chloramphenicol (Cm) resistance gene (cmR). When mixed, G+ can transfer a copy of its mobilization plasmid to R−, generating a transconjugant (Y), which expresses both GFP and mCherry (Video S1, control without oriT Video S2). For a complete list of plasmids and strains see Table S1. This system enables us to quantify conjugation dynamics by selective plating or fluorescence microscopy.
Fig. 2. Antibiotics did not significantly increase conjugation efficiency.
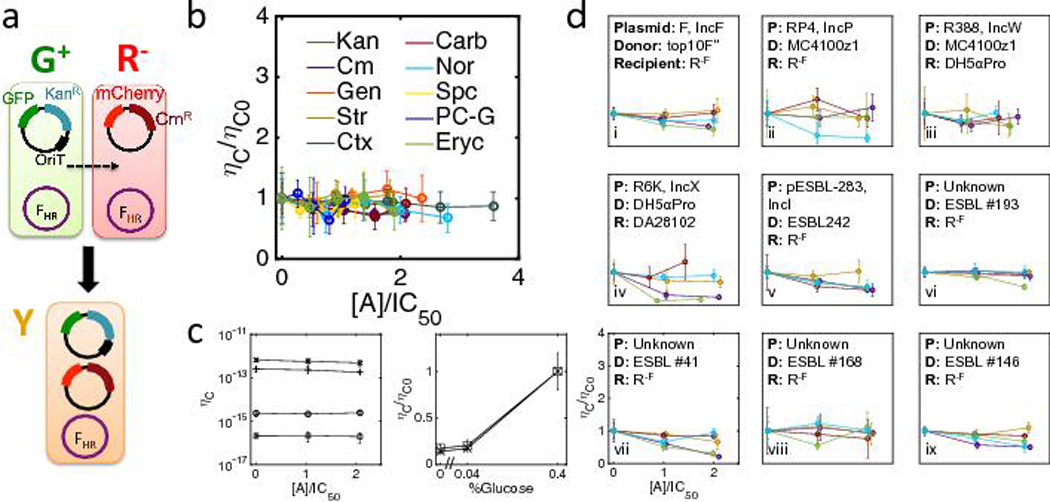
(a) A synthetic conjugation system (see Table S1). The recipient (R−) carries an immobile plasmid expressing cmR and an mCherry reporter. The donor (G+) carries a mobilizable plasmid expressing kanR and a GFP reporter. When mixed, G+ transfers a copy of its plasmid to R−, generating transconjugant Y. Transconjugants can be quantified by selective plating or by fluorescence imaging.
(b) Quantifying conjugation efficiency (ηC) for R− and G+ (see Table S2 and Methods for details) with 10 antibiotics. The y-axis is the conjugation efficiency normalized with the efficiency in the absence of antibiotics, ηC0 The x-axis is antibiotic concentration [A] normalized with each IC50 measured in plate readers (Fig. S2). There was no significant increase in ηC0 amongst all antibiotics and concentrations tested (P >0.15, one-tailed t-test, Table S3a). G− was mated with R− as control; no transconjugants were detected (CFU data not shown, demonstrated by Video S2).
(c) Left: Physiological state of the cells significantly influenced the conjugation efficiency. G+ and R−F cells were grown into exponential phase for 2 hours (See Methods). All four combinations of R−F and G+ from either stationary (s) or exponential (e) phase were tested, from top to bottom, Ge and Rs (crosses), Ge and Re (pluses), Gs and Rs (circles), and Gs and Re (squares). Str was used for these experiments, at concentrations of 0, 2, and 4 µg/mL. Differences in ηC between combinations are statistically significant (P<5×10⁻⁴, two-tailed t-test).
Right: Glucose significantly increases ηC. Crosses indicate without and boxes indicate with 2µg/mL Kan. Here, ηC0 is for the standard M9 conditions (glucose = 0.4%, Fig. 2b), since ηC under these conditions insignificantly changes between 0 and 2µg/mL Kan (P>0.71, one-tailed t-test).
(d) Antibiotics did not significantly increase the conjugation efficiency for five native self-transmissible conjugation systems, including F(i), RP4(ii), R388(iii), R6K(iv), and pESBL-283(v) from five incompatibility groups (IncF, IncP, IncW, IncX, and IncI), or for four ESBL-producing clinical E. coli isolates donors with unknown conjugation machinery (vi–ix) (P>0.15, one-tailed t-test. Donors and recipients are labeled in each panel (Table S1 and Methods).
Error bars for all data in Fig. 2 indicate mean ± standard deviation from four-six replicates.
We first quantified the conjugation efficiency in the absence of antibiotic-mediated selection. In brief, we mixed high densities of R− and G+ in an equal ratio (~5×10⁸ cells/mL of each) with varying concentrations of an antibiotic. We then incubated the mixture at room temperature (25°C) for 1 hour in M9 minimal medium before measuring the densities of R−, G+, and Y cells by selective plating. 25°C was used to ensure negligible growth over the incubation period. The R− and G+ densities did not change significantly after mixing and incubation in the absence of an antibiotic (Fig. S1a, P>0.8, two-tailed t-test), indicating lack of growth by either population. These densities also did not change when cells were incubated with high concentrations of a range of different antibiotics (Fig. S1b, P>0.2, two-tailed t-test), indicating negligible cell death. Taken together, these measurements indicate that there was negligible antibiotic-mediated selection under these experimental conditions. For all conditions, a small population of transconjugants emerged, which had a negligible effect on either parental population density, as indicated by their approximately constant population sizes (Fig. S1). We took this population to be the number of transconjugants produced directly via conjugation (i.e., in the absence of selection dynamics).
Using the protocol above, we measured the effects of 10 different antibiotics, namely Kan, Cm, gentamicin (Gen), streptomycin (Str), spectinomycin (Spc), penicillin-G (PC-G), carbenicillin (Carb), ceftriaxone (Ctx), erythromycin (Eryc), and norfloxacin (Nor). These cover six major classes, including aminoglycosides, β-lactams, cephalosporins, macrolides, amphenicols, and quinolones (Table S2). For each antibiotic, we defined a rate constant for conjugation, or the conjugation efficiency, as ; here, R, G, and Y are the colony forming units (CFU) counts of recipients, donors, and transconjugants, respectively (we remove the transfer signs ± for generality in the equation), and Δt is the time of incubation (1 hour). This metric avoids the potential bias in quantification that arises when only one parent is considered (i.e., or )20,34. When dosed up to 2×IC50 values (Fig. S2), none of the antibiotic statistically increased the conjugation efficiency (Fig. 2b, Table S3a, P>0.15, one-tailed t-test). If an antibiotic did increase the efficiency, the effect was smaller than the error associated with our experimental measurements (mean < 27%).
Although there was no effect of antibiotic on conjugation efficiency, basal conjugation efficiency did exhibit substantial day-to-day variations (up to 13-fold, Fig. S3a). Past studies have also noted such variability when reporting conjugation efficiencies16,34. This variability was likely due to differences in the physiological states of the two parental populations. These variations could result in differences in the expression of conjugation machinery35, which is greater in exponential phase than in stationary phase (Fig. S3b). Indeed, the conjugation efficiency increased drastically (~300-fold) when donor cells were harvested from exponential phase (Fig. 2c, left panel). However, the conjugation efficiency decreased (~8-fold) when recipients were harvested during exponential phase (Fig. 2c, left panel), suggesting a state-specific role for parental populations during conjugation36,37. Since the conjugation efficiency was also significantly increased when both parents were harvested from exponential phase (~280-fold), this suggests the increased metabolic activity of donors can compensate for the decreased receptivity of recipients.
We reasoned that donor recognition of the recipient, which requires an efficient searching mechanism of the pilus tip in liquid culture, is more effective when the recipient is in stationary phase, either due to decreased motility or modifications in cell wall composition38,39. As both F-tip searching and DNA transfer require energy40,41, we hypothesized that energy availability would also impact conjugation efficiency. Consistent with this notion, we found that increasing the glucose concentration in the medium significantly increased conjugation efficiency (~7-fold, Fig. 2c, right panel, P<0.01, left-sided one-tailed t-test). Importantly, regardless of the starting condition, the effects of antibiotics on the conjugation efficiency in the absence of growth remained negligible (low and high antibiotic concentration, Fig. S3c).
To test the generality of the result in Fig. 2b, we measured conjugation efficiency for five additional native self-transmissible conjugative systems, including the native F plasmid, RP4, R388, R6K, and pESBL28342 (Fig. 2d i–v, Fig. S3d) with five antibiotics: Eryc, Carb, Cm, Str, and Nor. These systems cover five different incompatibility groups, namely, IncF, IncP, IncW, IncX, and IncI. We also measured the conjugation efficiency for four clinical isolate donors expressing extended spectrum β-lactamases (ESBL); genes encoding ESBLs are often spread by conjugation43 (Fig. 2d vi–ix, Fig. S3e). Finally, we tested inter-species conjugation using FHR-bearing E. coli donor R+ cells with two ESBL clinical isolates of Klebsiella pneumoniae as recipients (Fig. S3f). For all conditions tested, we found that antibiotics did not significantly increase the conjugation efficiency (P>0.15, one-tailed t-test, see Tables S1 and S3b for list of donors and recipients as well as experimental conditions).
If antibiotics do not affect the conjugation efficiency, their effects on emergence of transconjugants can be manifested through selection dynamics on the donor (g), recipient (r), and transconjugant (y) populations. To describe these dynamics, we constructed a kinetic model consisting of three nondimensionalized ordinary differential equations (ODE) (Supplementary Information, Eq. S4–6). Assuming that y << g:
| 1 |
| 2 |
| 3 |
Briefly, we assume logistic growth for all three populations, where μr and μg are the dimensionless growth rates of r and g respectively, and is the dimensionless conjugation efficiency. Depending on how the antibiotic concentration, a, affects the growth of the parental populations, the model reveals four qualitatively different dynamics for the fraction of transconjugants, (Fig. 3b). Modulation of transconjugants can be due to two factors: the contribution through the conjugation term , and whether the transconjugants are at a selective advantage over the parental strains (i.e., if μr + μg < μy = 1).
Fig. 3. Antibiotics can both promote and suppress conjugation dynamics.
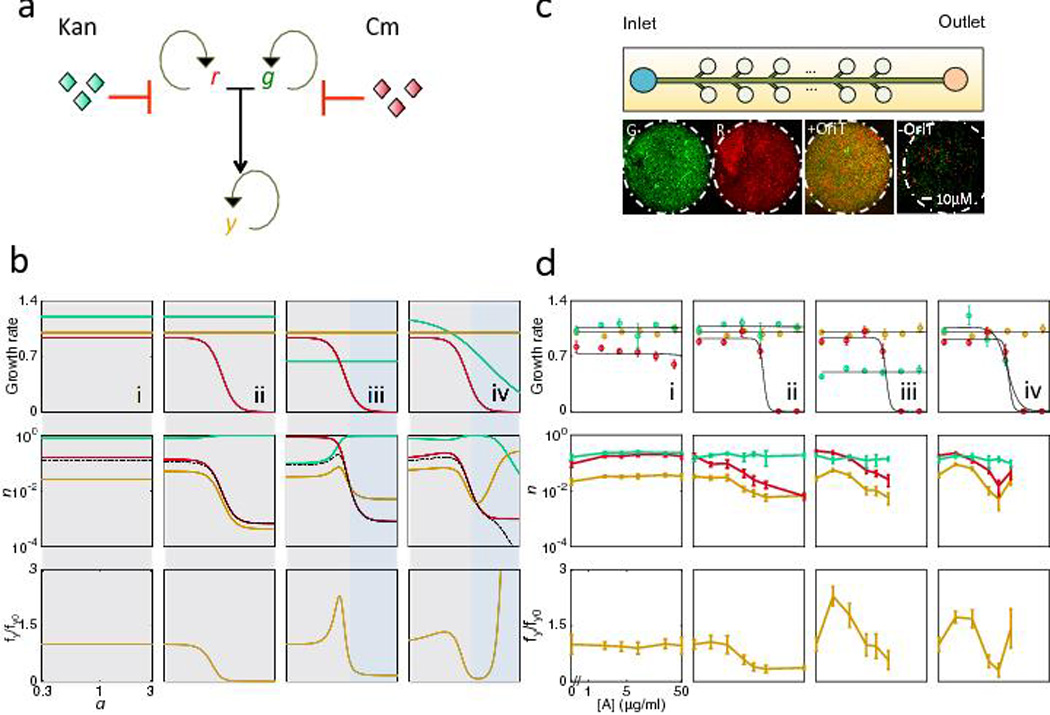
(a) Conjugation dynamics of r (recipient), g (donor), and y (transconjugant) in response to antibiotics, which can alter the growth rates of one or more of the three populations. Curved arrows represent cell proliferation, and blunt ended arrows represent antibiotic inhibition. r and g conjugate to form y.
(b) Model (Eq. 1–3) predictions of conjugation dynamics dependence on antibiotic concentration (a) for all four trends. Top row: Growth rates for the three populations. Middle row: Total density (n) of r, g, and y after 16 arbitrary time units (A.U.) Bottom row: fy normalized by fy at a = 0 (fy0). Dashed line indicates contribution through conjugation (rg). Shaded boxes outline regions of similar dynamics. (i) Antibiotic has no effect on either parent. (ii and iii) Antibiotic inhibits only one parent. (iv) Antibiotic inhibits both parents.
(c) Microfluidic platform to quantify conjugation. The microfluidic chip contains cell-trapping chambers, which allow for monolayer bacterial growth (See Fig. S5a and Methods for device details). 8–10 chambers are measured per growth condition per experiment. Each population is determined by obtaining the total pixel number of R (mCherry), G (GFP) and Y (colocalization algorithm)44, and normalized by the carrying capacity of the chamber (Nm=6×105 pixels/chamber), to obtain r, g, and y respectively. Representative images (from 10 replicates) show pure G+ and R− populations, and mixed populations with or without oriT (See Methods).
(d) Experimental results confirmed model predictions in (b). Panel numbers correspond to those in (b). Standard deviation was from 8–10 chamber replicates, with those falling outside of two standard deviations or having lost focus removed. (i) Rk and G+ are both resistant to Kan, and x-axis is Kan. (ii) R− and G+ are resistant to Cm and Kan respectively, and x-axis is Kan. (iii) Same as (ii), with 4µg/mL Cm to reduce G+ growth rate. (iv) R− and G+ are resistant to Cm and Kan respectively, and x-axis is both Cm and Kan. Top row: growth rates for the three populations quantified using plate reader measurements (see Methods). Middle row: the total density (n) of r, g, and y after 12 hours of growth. Bottom row: fy normalized by fy at [A] = 0, fy0 (see Table S5).
When the transconjugants are at a selective disadvantage, μr + μg > μy, (Fig. 3b, top row, gray region), the transconjugant population either remains constant (Fig. 3b i, middle row), decreases (Fig. 3b ii, middle row), or increases then decreases (Fig. 3b iii–iv, middle row), depending on whether the corresponding contribution through conjugation remains constant, increases, or decreases (Fig. 3b, middle row; black lines show the contribution through conjugation).
When transconjugants are at a selective advantage, i.e. μr + μg < μy (Fig. 3b iii–iv, blue region), the transconjugant population either decreases (Fig. 3b iii, middle row) or increases (Fig. 3b iv, middle row), depending on whether there are sufficient resources for the transconjugant population to grow (e.g. whether the parents are near the carrying capacity). Because both parents are sensitive to antibiotic in panel iv, as soon as transconjugants gain a selective advantage over parent cells, they can overtake the entire population. In panel iii, although transconjugants are at a selective advantage, the high density of donor cells suppresses further increase in the transconjugant population at high antibiotic concentrations. In all four cases, the transconjugant fraction, fy, follows similar dynamics as the transconjugant population itself (Fig. 3b i–iv, bottom row). Taken together, our model predicts that antibiotic-mediated selection often reduces the fraction of transconjugants in the system in contrast to conventional wisdom.
To test model predictions, we developed a microfluidic device (Fig. 3c and S5a, see Methods) to analyze population dynamics during conjugation. Bacteria form a monolayer in each growth chamber, which allows quantification of transconjugants by colocalizing pixels containing both GFP and mCherry44 (Fig. S5). Furthermore, the platform enables precise control of antibiotic delivery by modulating the flow rate of media. By varying the combinations of Kan and Cm to obtain the desired selection environments (Fig. 3d, top row), our experimental results validated overall model predictions in terms of total density (n) of each population (r, g, and y) normalized by the carrying capacity in the chamber (Fig. 3d, middle row), and the fraction of transconjugants (fy) (Fig. 3d, bottom row). In each scenario, the predicted trends for the fraction of transconjugants were maintained when we switched the antibiotic or the direction of transfer (Fig. S6a–b). These results confirmed that promotion of transconjugants by antibiotic-mediated selection occurred only in two conditions and over a particular antibiotic range (Fig. 3d iii and iv, bottom row). For a summary of microfluidic experiments, including the strains and concentrations used, see Table S5.
In nature, conjugation typically occurs in the presence of buffer populations that may also participate in conjugation. To this end, we tested the effect of a buffer population (denoted B in experiment and b in model), which can receive the mobile plasmid from donor cells and then pass this to recipient cells, generating transconjugants in the process. According to our simplified model (Fig. S6c, Eq. S14–17), we predicted that the buffer population should maintain a monotonically decreasing transconjugant population. Our full model predicts the same outcome, as long as the above conditions are met (e.g. the transconjugants never gain the selective advantage, and the contribute through conjugation monotonically decreases, Fig. S6c). Using E. coli MG1655 carrying FHR as the buffer population, our experimental results again validated model predictions (Fig. S6d).
As evident in Eq. 3 and Fig. 3b middle row, both r and g contribute critically to y dynamics. Consistent with this notion, it has been shown that pathogen-driven inflammation in mice generates blooms of both parents, resulting in high conjugation frequency45. Indeed, our modeling and experiments showed an approximate power law correlation between the transconjugant population (y) and the product of the donor and recipient populations (rg) (Fig. 4), regardless of the selection environment or the time at which the data was collected (Fig. S7). This intuitive correlation suggests a strategy to estimate the likelihood of conjugation, provided the two parental populations can be estimated in situ.
Fig. 4. Population structure influences the likelihood for conjugation frequency.
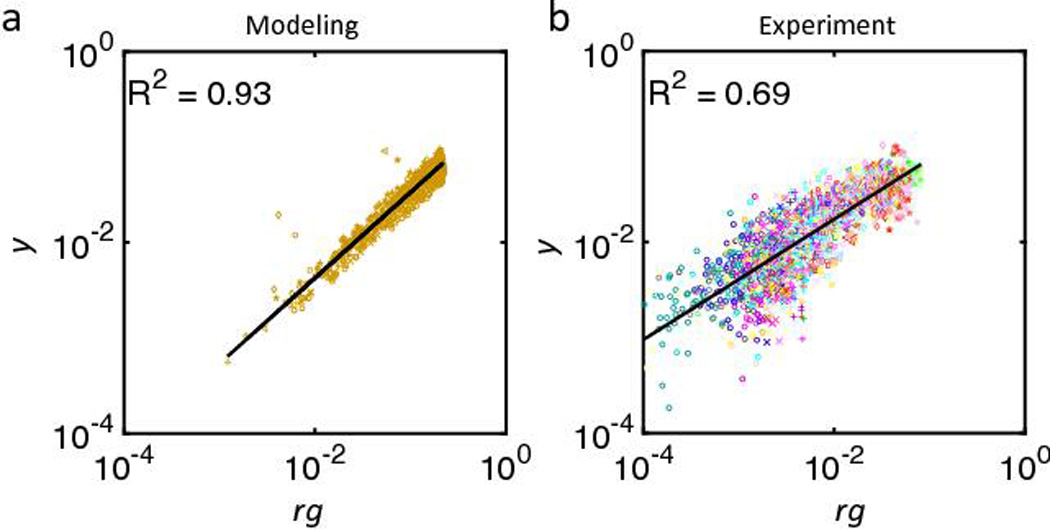
(a) Stochastic simulation with randomized parameters µr and µg, and collecting r g and y. Parameters are randomly generated from a normal distribution with mean of 1 and standard deviation of 0.3, and collected for 7 time points spanning 4 A.U. Results show approximate power law correlation between rg and y (R2 = 0.93), such that log(y) = b1log(rg) + b0 where b1=0.90 and b0=−1.25, and P<1×10⁻⁴ (linear regression). Different markers indicate different time points (o, x, +, square, <, diamond, and *).
(b) Experimental data confirm model predictions in (a) (R2 = 0.69). Here, log(y) b1log(rg) + b0 where b1=0.63 and b0=−1.41, and P<1×10⁻⁴ (linear regression). Data used from seven experiments, and collected from 7 different time points (6th to 12th hour, every hour); colors indicate independent experiments, and shading indicates varied antibiotic concentration within each experiment (lightest [A] = 0 to darkest, see Table S5a for color designation). Different markers for different time points, from 6th to 12th, are used (o, x, +, square, <, diamond, and *). Here, rg and y are quantified by normalizing the pixels for each population with respect to the carrying capacity (Nm=6×105 pixels/chamber).
See Fig. S7 for the power law correlation at each individual time point.
Discussion
It is well established that conjugation plays a major role in the worldwide spread of antibiotic resistance. However, the converse statement – that the use of antibiotics promotes conjugation – is not necessarily true. In general, conjugation must overcome mechanistic, physiological, and selective barriers to be successful46,47. Indeed, our results indicate that the contribution of antibiotic to the promotion of conjugation may be over-estimated for two reasons. First, antibiotics do not significantly increase the efficiency of conjugation in systems where the conjugation machinery is constitutively expressed. Second, even considering selection dynamics, only a small subset of parameters promotes an increase in the fraction of the transconjugants. This counterintuitive outcome results from the opposing role of an antibiotic on conjugation. If an antibiotic does not affect either parent, there is no selection advantage for the transconjugant. If the antibiotic inhibits either or both parents, it does offer a selection advantage for the transconjugant. However, the antibiotic might still reduce the frequency of conjugation by reducing the population sizes of either or both parental populations, potentially negating the effect of positive selection for the transconjugant.
While antibiotic presence does not significantly increase the efficiency of conjugation per se, our results show that other factors, particularly the physiological state of cells before conjugation and energy availability during conjugation, have a drastic impact on the conjugation efficiency (Fig. 2c). When considering selection dynamics, population structure plays a dominant role in predicting transconjugant emergence (Fig. 4). Our findings underscore the importance of quantifying the growth dynamics of microbial populations (with or without antibiotic treatment), both to gauge the physiological states of cells and to estimate the effects of antibiotic-mediated selection. This information can also contribute to assessing the risk associated with the dissemination of resistance. For example, a recent study demonstrates the feasibility of quantifying both abundances and growth rates of different microbial populations using sequencing48. These measurements, when coupled with in vitro estimates of conjugation efficiency, can enable quantitative estimates of the extent of HGT in diverse natural environments.
Methods
Strains, growth conditions, and plasmid construction
Escherichia coli strain MG1655 carrying the FHR plasmid (F plasmid with mutated oriT sequence, oriTm) was used as background strain for all engineered experiments in this study27. Donor cells (G+) contain mobilization plasmid pUA66T, which carries gfp gene under the control of PLacZ promoter, oriT for transfer, and Kanamycin (Kan) resistance (kanR), adapted from previous work31. Recipients (R−) carry pTetmCherry, an immobile plasmid containing Tetracycline (Tet) inducible mCherry gene, and Chloramphenicol (Cm) resistance (cmR) (Fig. 2a). Transconjugants (Y) are resistant to both Kan and Cm. For a complete list of strains and plasmids used in this study, see Table S1. For all experiments, single clones were grown separately for 16 hours in 3mL Luria-Bertani (LB) broth (Genessee Scientific, Catalog #11–120) containing appropriate antibiotics (either 50 µ g/mL Kan or 100 µ g/mL Cm), including 20 µ g/mL Tet, with shaking at 250 revolutions per minute at 37°C. The 75 ESBL clinical isolates were isolated and characterized by the Durham VA Medical Center; Dr. Chris Wood at Duke University further screened them for CTX-M ESBL resistance. The library consists of Klebsiella pneumoniae, K. oxytoca, Citrobacter freundii, Enterobacter clocae, and E. coli strains that have been identified as ESBL producers.
To create pUA66T, PCR was used to amplify oriT from F plasmid isolated from Top10F’, and cloned into pTetmCherry33 using AatII and XhoI sites (New England Biolabs (NEB), Ipswich, MA), generating pTetmCherryT. The product was sequenced for verification. It was then excised from pTetmCherryT and introduced into pUA6631 using AatII and XhoI to make pUA66T, and transformed into MG1655 with FHR for the final strain G+. MG1655 with FHR and pUA66 without the transfer sequence was used for the reverse direction experiments, denoted G− (Fig. S6b). To create strain R−, pTetmCherry with the ColE1 replication origin was used as backbone. The p15A replication origin from pLacGFPmut3b32,49 was exchanged for the ColE1 origin of replication in pTetmCherry, and transformed into MG1655 FHR to make the final R− strain using restriction enzyme cloning at the sites BamHI and SpeI. oriT was cloned into pTetmCherry with p15A replication origin using AatII and XhoI sites (NEB) and transformed into MG1655 FHR to create R+. This was used for inter-species conjugation and reverse direction transfer experiments (Fig. S3f and S6b). Cloning was confirmed using gel electrophoresis. To create Rk, cmR from pTetmCherry was exchanged for kanR from pUA66T using the restriction sites AatII and SacI. All enzymes and buffers used were NEB products and standard cloning procedures followed. All ligation reactions were performed using T4 DNA Ligase (NEB). All variants of G and R were transformed into MG1655 carrying FHR, except for R−F, which was transformed into MG1655. See Table S1 for a complete list of strains, plasmids, and descriptions.
Conjugation in the absence of antibiotic-mediated selection
16 hour overnight cultures (3mL LB media with appropriate selecting agents, density ~1×10⁹CFU/mL) were resuspended in M9 medium (M9CA medium broth powder from Amresco, lot # 2055C146, containing 2mg/mL casamino acid, supplemented with 0.1mg/mL thiamine, 2mM MgSO4, 0.1mM CaCl2, and either 0%w/v glucose for experiments testing glucose concentration or 0.4% for all others). R− and G+ were mixed in a 1:1 ratio to a final volume of 800 µ L. Depending on the conditions being tested, the appropriate antibiotic and concentration was added to this mixture (Table S3). Mixtures were incubated at room temperature (25°C) for 1 hour without shaking. For the parents (R− and G+), serial dilutions of 107 were performed, and four to six replicate measurements were spread onto plates containing 50 µg/mL Kan (for quantifying G+) and 100 µg/mL Cm (for quantifying R−) individually. To quantify transconjugants, cells were typically plated at a dilution of 50-fold onto plates containing both antibiotics (50 and 100 µg/mL of Kan and Cm, respectively). This dilution gave us countable cells for conjugation efficiencies within the range of 10−14–10−15. For conjugation efficiencies that were either higher, or lower, we adjusted the dilution factor accordingly. For example, conjugation efficiencies as low as 10−16 were plated with 10-fold dilutions, while efficiencies approximately 10−12 were quantified with higher fold (e.g. 203). To provide intuition into the conjugation efficiency estimate, sample numbers are shown below, followed by the calculation for conjugation efficiency:
| Population | Antibiotic on agar in µg/mL | Dilution fold for spreading | #colonies |
|---|---|---|---|
| Y | Kan (50) and Cm (100) | 50× | 50 |
| R− | Cm (100) | 107x | 70 |
| G+ | Kan (50) | 107x | 70 |
Plates were incubated overnight at 37°C and CFU were counted the following day. All CFU error bars represent four-six technical replicates due to the clone-to-clone variation (Fig. S3a), and all experiments were repeated in triplicate to ensure reproducibility. To measure the extent of growth and death during the mating period, we quantified CFU before and after the one hour incubation time both in the absence of antibiotic, and exposed to the highest concentration of each antibiotic used (Fig. S1a and b). The negligible change in CFU before and after the incubation period in the absence or presence of antibiotic demonstrates that both growth and death is negligible over this time period. Exponential phase parent populations were obtained by diluting overnight cultures 10-fold and grown shaking (37°C, 250rpm) for 2 hours prior to harvesting (Fig. 2c). Statistical testing using one-sided left-tail t-test to detect an increase is shown in Table S3 for all conjugation experiments.
Determining the IC50 value
IC50 values were determined using plate-reader measurements of bacterial growth in the presence of varying antibiotic concentrations (Perkin-Elmer Victor 3/X3). For experiments using the FHR conjugation system, G+ was used to quantify all dose responses, except for Kan, where R− was used instead. Seven logarithmically spaced antibiotic concentrations were used, and 0 µg/mL antibiotic was included as control. The highest concentration of each antibiotic was selected to capture the appropriate range of both growth and death. Specifically, concentrations of 0, 0.95, 0.399, 1.66, 6.9, 28.8, 120, and 500µg/ml were used for antibiotics Kan, Cm, Carb, Str, Spc, Ctx, and PC-G. Concentrations of 0, 0.019, 0.08, 0.33, 1.38, 5.77, 24.01 and 100 µg/ml were used for Nor and Eryc. Lastly, concentrations 0, 0.047, 0.20, 0.83, 3.46, 14.4, 60.03, and 250 µg/ml were used for Gen. A full description of all antibiotics and corresponding vendors used in this study can be found in Table S2. Three technical replicates per concentration were used to quantify the growth rate. Growth rates were quantified by log transforming the growth curves, applying K-means clustering to non-arbitrarily locate the region of longest exponential growth, curve smoothing using MATLAB, and fitting the linear portion. Dose response curves were fit to a Hill function (Eq. 4) to determine the growth rate μ, where A is the antibiotic concentration, μmax is the maximum rate, and n is the Hill coefficient.
| 4 |
For subsequent CFU experiments using G+ and R−, five antibiotic concentrations including 0 as control were selected to span a range from 2-fold below to 2-fold above the IC50 value (Fig. 2b, Table S3a). Conjugation efficiency that is not normalized to the group in the absence of antibiotic is shown in Fig S3a.
We tested various additional plasmids and strains to demonstrate the generality of these findings. For these experiments, only three concentrations of antibiotics were chosen, namely 0, the IC50 value, and 2×IC50 value. Since conjugation of the additional plasmids occurred between different strains, the IC50 of the recipient strain was used to choose the corresponding concentrations, unless the recipient was resistant to the tested antibiotic or the IC50 was too high such that it caused a decrease in viability. In either of these cases the donor IC50 was used instead. The same five antibiotics were tested for each additional conjugation pair (Cm, Carb, Eryc, Str, and Nor). For all ESBL conjugation experiments, IC50 values of the recipient, R−F, were used for antibiotic scaling. All relevant IC50 values, and donor/recipient pairs, can be found in Table S1 and S3b.
Derivation for ηC
For the sake of generality, we denote R and G without the transfer sign as the parents, since the direction of transfer doesn’t influence the quantification of the efficiency. We assume bimolecular reaction kinetics for R and G generation of Y, and that the reaction occurs with a rate constant ηC (conjugation efficiency): . If R and G remain constant over Δt, we have:
| 5 |
Screening ESBL library for donor and recipient activity
To screen the ESBL-producing library for conjugation activity, we screened each of the 75 ESBL isolates for Carb and Cm resistance by inoculating single clones in 2 mL LB. These cultures were grown overnight for 16 hours with shaking (250rpm) at 37°C. Note that the medium contained each antibiotic individually (100µg/mL). Every pathogen was resistant to Carb, and of the 75 tested, 28 isolates carried resistance to Cm.
To screen for donor activity, the remaining 47 Cm-sensitive isolates were mated individually with R−F (R− without FHR, Table S1) at 10× dilution of overnight culture for 5 hours shaking (250rpm, 37°C) in 96-well plates. Following mating, 5 µL of the mixture was spread onto agar containing Cm and Carb at the same concentrations (100µg/mL of each), and grown overnight at 37°C. Since R−F is incapable of acting as donor, any plate exhibiting colonies after 16 hours indicated a successful conjugation event between a donor ESBL isolate and R−F recipient. Four of these identified donors were used for further experiments (Fig. 2d vi–ix and Fig. S3e).
Having verified a subset of the Cm-sensitive ESBL-producing isolates that were incapable of acting as donors, we classified these as potential recipients. We mated each of the potential recipients (ampR) with R+ (cmR) by inoculating 10× dilution of overnight culture of each parent into 96 well plates, and let the plate shake for 5 hours (250rpm, 37°C). Following this, we spread 5 µL onto agar containing Cm and Carb at the same concentrations (100µg/mL of each), and grown overnight at 37°C. The corresponding ESBL from any pair that resulted in cells the following day was marked as a recipient. We used two isolates, namely of the species Klebsiella pneumoniae, as recipients for inter-species conjugation experiments (Fig. S3f).
qRT-PCR
A single clone of G+ was grown overnight for 16 hours at 37°C. Exponential phase parent was obtained by diluting overnight G+ 10× and grown shaking (250rpm) for 2 hours at 37°C prior to harvesting. RNA was extracted using the QIAGEN RNAeasy Protect Bacteria mini kit (QIAGEN, Catalog #74524). On-column DNase digestion using the RNase-Free DNase set (QIAGEN, Catalog #79254) was performed to remove any DNA present. RNA was then reverse transcribed into cDNA using the Applied Biosystems high-capacity cDNA Reverse Transcription kit (ThermoFisher Scientific, Catalog #4368814). qRT-PCR was performed using Power SYBR® Green Master Mix (ThermoFisher Scientific, Catalog #4367659), and ffh gene from E. coli chromosome was used as control gene. Data was collected from replicates of three, and quantified using the standard curve method. Genes targeted were traI (forward (FW) 5’-CCGGAAGTGCCGGTAACTAT-3’ and reverse (RV) 5’ -AGCCGGGACGATGCTTATTA-3’) and traD (FW 5’-GCCAGATCGCCAATATCATG-3’ and RV 5’- GCGTTCATGCGGAAGGTTTT-3’). Primers for ffh were FW 5’-TGTGACGAATAGAGAGCGCC-3’ and RV 5’-GGCCAATACGGCAAAAGCAT-3’ (all primers obtained from IDT Dna). Results were normalized with respect to ffh first, and then compared for fold change between exponential (Exp) and stationary (Sta) phase cultures (Fig. S3b). Error bars represent three technical replicates, and qPCR was performed twice on separate biological samples to ensure reproducibility.
The microfluidic device
The use of a microfluidic device is uniquely suited for antibiotic selection experiments, as the transconjugants are distinguishable from G+ and R− by expressing both GFP and mCherry. Trapping chambers from this device capture bacterial populations in a monolayer, which allows for highly accurate transconjugant quantification (Fig. S5a).
The microfluidic device was fabricated with polydimethylsiloxane (PDMS, Dow Corning SYLGARD 184, lot #0007724118) based on soft lithography technology50. Each device consists of six identical replicate units for different experimental conditions; each unit consists of a main channel and 24 culturing chambers (Fig. 3c and S5a). The height of each chamber is ~1.3µm, which ensures only a monolayer of bacteria will be captured and monitored, while the height of the main channel is ~30µm. Two different types of SU8 photoresists were used to fabricate a reusable mold for the device. SU8 2002 (MicroChem Corporation, lot #07020133) was spun at 5000rpm for 30 seconds to obtain the thin layer (1.3µm) on a 3-inch silicone wafer. After being baked at 180°C for 2 hours, the second layer of SU8 3025 (MicroChem Corporation, lot #11050370) was spun on top of the first layer at 2500rpm for 30 seconds to get the thick layer (30µm). Following the protocol from the photoresist data sheet, the mold was baked at 180°C for 2 hours. This mold was subsequently used to fabricate individual devices. Specifically, 20g 10:1 (weight ratio) of mixed PDMS (polymer and crosslinking agent) was poured on top of the mold, degased, and then baked at 80°C for 30min to ensure complete crosslinking. A biopsy punch with 0.75mm diameter (World Precision Instruments, Inc.) was employed to drill both the inputs and outputs. After being cleaned with scotch tape (3M Corporation) to remove the PDMS residue, the PDMS slabs were bonded to 75mm by 25mm #1 cover slips with oxygen plasma treatment (30 Watts for 30 seconds). To maintain nutrient and antibiotic concentrations during our experiments, we used programmable syringe pumps (New Era model NE-1600) to control the media flow rate at 120µL/hour with medium supplemented with varying antibiotic concentrations.
Image calibration
R− and G+ cells were grown overnight for 16 hours shaking (250rpm) at 37°C. Sub-cultures of R− and G+ were performed for two hours prior to the start of each microfluidic experiment by inoculating a 10× dilution of the overnight culture in 3mL LB with appropriate antibiotic selection (100 µ g/mL Cm for R−, 50 µ g/mL Kan with 1mM IPTG for G+ (for GFP induction), and 20 µ g/mL Tet for both), and grown shaking at 37°C. After 2 hours of sub-culture, each population was concentrated 60-fold for high-density loading. After the sub-culture, CFU counts of each population were also measured to determine relative cell density (Fig. S5b). With this protocol, we found that CFU values for R−, G+, and Y to be within standard deviations of one another. Therefore, we used culture volume to determine pre-defined ratios of the three populations in mixtures. Pre-defined mixtures of R−, G+, and Y were loaded into individual channels, and 10 chambers were imaged per channel as technical replicates, where each image contains 1024×1024 pixels. We adapted the image analysis algorithm from Villalta et al44, which uses colocalization of red and green pixels to determine the presence of transconjugants. Each bar shows the average and the standard deviation of measurements from 10 chamber replicates (Fig. S5c, error bar indicates standard deviation). Our detection limit was quantified from the calibration data of a mixture of pure R− and G+ (Fig. S5c). In the absence of yellow, the colocalization algorithm will identify <3% of the pixels as containing both mCherry and GFP. The detection limit for transconjugants was thus set as anything greater than 500 pixels. All calibration and time-lapse images were obtained using a DeltaVision Elite imaging system; experiments used 60× magnification with 80ms exposure time and 5% transmission. The device was incubated at 37°C for the entirety of the experiment, and images were obtained using a Coolsnap HQ2 high-resolution CCD camera.
Requirement of oriT for transfer
To demonstrate that conjugation relies on the presence of oriT, we first grew R− and G+ in the chip for four hours before introducing both Kan and Cm to select for the resulting transconjugants (Fig. 3c, +oriT Video S1). R− and G− (which carries pUA66, without oriT) showed no generation of transconjugants under the same conditions, thereby demonstrating the specificity of oriT for this process (Fig. 3c, −oriT Video S2). Specifically, R+ with G+, and R− with G− were mixed and loaded into the chamber. Selecting concentrations of Kan (50µg/mL) and Cm (100µg/mL) was used for selection. Cells lacking oriT did not undergo conjugation, as evidenced by the lack of yellow pixels. This observation was also verified using CFU counts.
Antibiotic selection in the microfluidic chip
Since the microfluidic experiments used several combinations of R and G variants depending on the experiment (e.g. Rk and G+ for Fig. 3d i; the full list of strains for each experiment can be found in Table S5a), we denote the parents as R and G without the transfer sign, to simplify the explanation.
R and G were grown overnight for 16 hours shaking (250rpm) at 37°C in LB medium supplemented with the appropriate antibiotics. Sub-cultures of R and G were performed for two hours prior to the start of microfluidic experiment by inoculating a 10× dilution of the overnight culture in 3mL LB and grown shaking at 37°C; G was supplemented with Kan (50 µ g/mL), IPTG (1mM), and Tet (20 µ g/mL), and R was supplemented with Cm (100 µ g/mL) and Tet (20 µ g/mL). After the sub-culture, cells were immediately resuspended in M9 containing Tet (20 µ g/mL) and IPTG (1mM), condensed 40-fold, and mixed in equal ratio. Prior to loading, the chip was vacuumed for 20 minutes to facilitate chamber entry. Between 8 to 10 chamber positions were marked for each experiment from every channel, which corresponds to one antibiotic condition. We quantified the percent of transconjugants after 12 hours of growth in the microfluidic chambers as the average of all 10 chambers, with the appropriate antibiotic concentration administered at the start of each experiment, and maintained with continuous flow of media throughout the duration of the experiment; syringe pumps are used for continuous flow at a rate of 120 µL/hr. Those chambers outside of two standard deviations, which lost focus, or had an air bubble, were removed prior to processing. All error bars represent standard deviation.
Image processing
Each video was imported into MATLAB and the time series was analyzed. The data from the 12th hour was collected and analyzed separately. The location of the chamber within the 1024×1024 image was detected using a Hough transform from the frame at the 12thhour. The total chamber size was estimated using this as 6×105 pixels/chamber. This value is used as Nm for density normalization.
Every experiment consisted of six independent antibiotic concentrations, each administered in one channel of the device. Either 8 or 10 replicates per concentration were collected. The list of concentrations, total number of chambers collected, chamber number (1–10) that was removed in the outlier process, and date of experiment can be found in Table S5b. As shown, no more than 3 chambers were ever removed per experiment, and typically only one was removed from standard deviation outliers due to blurry focus.
For processing, every channel was identified as ‘Date_KanXXCmYY’, where XX and YY correspond to the appropriate concentration. Each concentration pair was performed at least twice to ensure technical reproducibility (Fig. S5d). Whenever possible, we use datasets collected on the same experimental day, i.e. on the same chip. However, because of technical reproducibility, we can confidently combine concentrations from different experiments if one channel was not deemed useable, for example, had an air bubble. This was done for Fig. 3d ii, iv, and Fig. S6b right column.
Supplementary Material
Acknowledgments
We thank the Shared Materials and Instrumentation Facility at Duke University for assisting with the fabrication of our microfluidic device. We also thank T. Dimitriu for plasmid constructs, insightful comments and advice, E. Gullberg for strain DA28102, Y. Feng for pESBL-283, C. Woods for the ESBL library, C. Biesel for plasmid pUA66, and B. Levin, L. David, C. Biesel, K. Koelle, J.C. Kreitz, and H.R. Meredith for insightful comments and suggestions. This study was partially supported by the U.S. Army Research Office under grant #W911NF-14-1-0490 (DK, SB, LY), National Institutes of Health (LY: 1R01-GM098642), a David and Lucile Packard Fellowship (LY), and the Howard G. Clark fellowship (AJL).
Footnotes
Author contributions
AJL conceived the research, designed and performed both modeling and experimental analyses, interpreted the results, and wrote the manuscript. SH developed and optimized the microfluidic platform, and assisted in microfluidic experiments and manuscript revisions. RPS conceived the research and assisted in manuscript revisions. JKS assisted in data interpretation, experimental setup, and manuscript revisions. TAS assisted in experiments and manuscript revisions. SB and DK assisted in manuscript revisions. LY conceived the research, assisted in research design, data interpretation, and manuscript writing.
The authors declare no conflict of interest.
References
- 1.Maiden MCJ. Horizontal genetic exchange, evolution, and spread of antibiotic resistance in bacteria. Clin. Infect. Dis. 1998;27:S12–S20. doi: 10.1086/514917. [DOI] [PubMed] [Google Scholar]
- 2.Mazel D, Davies J. Antibiotic resistance in microbes. Cell. Mol. Life Sci. CMLS. 1999;56:742–754. doi: 10.1007/s000180050021. [DOI] [PMC free article] [PubMed] [Google Scholar]
- 3.Barlow M. What antimicrobial resistance has taught us about horizontal gene transfer. Methods Mol. Biol. Clifton NJ. 2009;532:397–411. doi: 10.1007/978-1-60327-853-9_23. [DOI] [PubMed] [Google Scholar]
- 4.Andersson DI, Hughes D. Microbiological effects of sublethal levels of antibiotics. Nat. Rev. Microbiol. 2014;12:465–478. doi: 10.1038/nrmicro3270. [DOI] [PubMed] [Google Scholar]
- 5.Aminov RI. Horizontal gene exchange in environmental microbiota. Front. Microbiol. 2011;2 doi: 10.3389/fmicb.2011.00158. [DOI] [PMC free article] [PubMed] [Google Scholar]
- 6.Norman A, Hansen LH, Sørensen SJ. Conjugative plasmids: vessels of the communal gene pool. Philos. Trans. R. Soc. B Biol. Sci. 2009;364:2275–2289. doi: 10.1098/rstb.2009.0037. [DOI] [PMC free article] [PubMed] [Google Scholar]
- 7.Davison J. Genetic exchange between bacteria in the environment. Plasmid. 1999;42:73–91. doi: 10.1006/plas.1999.1421. [DOI] [PubMed] [Google Scholar]
- 8.Stevens AM, Shoemaker NB, Li LY, Salyers AA. Tetracycline regulation of genes on Bacteroides conjugative transposons. J. Bacteriol. 1993;175:6134–6141. doi: 10.1128/jb.175.19.6134-6141.1993. [DOI] [PMC free article] [PubMed] [Google Scholar]
- 9.Shoemaker NBAAS. Tetracycline-dependent appearance of plasmidlike forms in Bacteroides uniformis 0061 mediated by conjugal Bacteroides tetracycline resistance elements. J. Bacteriol. 1988;170:1651–7. doi: 10.1128/jb.170.4.1651-1657.1988. [DOI] [PMC free article] [PubMed] [Google Scholar]
- 10.Salyers AA, Shoemaker NB, Li LY. In the driver’s seat: the Bacteroides conjugative transposons and the elements they mobilize. J. Bacteriol. 1995;177:5727–5731. doi: 10.1128/jb.177.20.5727-5731.1995. [DOI] [PMC free article] [PubMed] [Google Scholar]
- 11.Whittle G, Shoemaker NB, Salyers AA. Characterization of genes involved in modulation of conjugal transfer of the Bacteroides conjugative transposon CTnDOT. J. Bacteriol. 2002;184:3839–3847. doi: 10.1128/JB.184.14.3839-3847.2002. [DOI] [PMC free article] [PubMed] [Google Scholar]
- 12.Beaber JW, Hochhut B, Waldor MK. SOS response promotes horizontal dissemination of antibiotic resistance genes. Nature. 2003;427:72–74. doi: 10.1038/nature02241. [DOI] [PubMed] [Google Scholar]
- 13.Al-Masaudi SB, Day Mj, Russell Ad. Effect of some antibiotics and biocides on plasmid transfer in Staphylococcus aureus. J. Appl. Bacteriol. 1991;71:239–243. doi: 10.1111/j.1365-2672.1991.tb04454.x. [DOI] [PubMed] [Google Scholar]
- 14.Zhang P-Y, et al. Combined treatment with the antibiotics kanamycin and streptomycin promotes the conjugation of Escherichia coli. FEMS Microbiol. Lett. 2013;348:149–156. doi: 10.1111/1574-6968.12282. [DOI] [PubMed] [Google Scholar]
- 15.Xia Z-J, et al. Improving conjugation efficacy of Sorangium cellulosum by the addition of dual selection antibiotics. J. Ind. Microbiol. Biotechnol. 2008;35:1157–1163. doi: 10.1007/s10295-008-0395-9. [DOI] [PubMed] [Google Scholar]
- 16.Schuurmans JM, et al. Effect of growth rate and selection pressure on rates of transfer of an antibiotic resistance plasmid between E. coli strains. Plasmid. 2014;72:1–8. doi: 10.1016/j.plasmid.2014.01.002. [DOI] [PubMed] [Google Scholar]
- 17.Ma H, Bryers JD. Non-invasive determination of conjugative transfer of plasmids bearing antibiotic-resistance genes in biofilm-bound bacteria: effects of substrate loading and antibiotic selection. Appl. Microbiol. Biotechnol. 2013;97:317–328. doi: 10.1007/s00253-012-4179-9. [DOI] [PMC free article] [PubMed] [Google Scholar]
- 18.Rensing C, Newby DT, Pepper IL. The role of selective pressure and selfish DNA in horizontal gene transfer and soil microbial community adaptation. Soil Biol. Biochem. 2002;34:285–296. [Google Scholar]
- 19.Johnsen AR, Kroer N. Effects of stress and other environmental factors on horizontal plasmid transfer assessed by direct quantification of discrete transfer events: Effects of environmental factors on horizontal plasmid transfer. FEMS Microbiol. Ecol. 2007;59:718–728. doi: 10.1111/j.1574-6941.2006.00230.x. [DOI] [PubMed] [Google Scholar]
- 20.Sørensen SJ, Bailey M, Hansen LH, Kroer N, Wuertz S. Studying plasmid horizontal transfer in situ: a critical review. Nat. Rev. Microbiol. 2005;3:700–710. doi: 10.1038/nrmicro1232. [DOI] [PubMed] [Google Scholar]
- 21.Blázquez J, Couce A, Rodríguez-Beltrán J, Rodríguez-Rojas A. Antimicrobials as promoters of genetic variation. Curr. Opin. Microbiol. 2012;15:561–569. doi: 10.1016/j.mib.2012.07.007. [DOI] [PubMed] [Google Scholar]
- 22.Smet A, et al. In situ ESBL conjugation from avian to human Escherichia coli during cefotaxime administration. J. Appl. Microbiol. 2011;110:541–549. doi: 10.1111/j.1365-2672.2010.04907.x. [DOI] [PubMed] [Google Scholar]
- 23.Barr V, Barr K, Millar MR, Lacey RW. β-Lactam antibiotics increase the frequency of plasmid transfer in Staphylococcus aureus. J. Antimicrob. Chemother. 1986;17:409–413. doi: 10.1093/jac/17.4.409. [DOI] [PubMed] [Google Scholar]
- 24.Goren MG, et al. Transfer of carbapenem-resistant plasmid from Klebsiella pneumoniae ST258 to Escherichia coli in patient. Emerg. Infect. Dis. 2010;16:1014–1017. doi: 10.3201/eid1606.091671. [DOI] [PMC free article] [PubMed] [Google Scholar]
- 25.Karami N, et al. Transfer of an ampicillin resistance gene between two Escherichia coli strains in the bowel microbiota of an infant treated with antibiotics. J. Antimicrob. Chemother. 2007;60:1142–1145. doi: 10.1093/jac/dkm327. [DOI] [PubMed] [Google Scholar]
- 26.Cavaco LM, Abatih E, Aarestrup FM, Guardabassi L. Selection and persistence of CTX-M-producing Escherichia coli in the intestinal flora of pigs treated with amoxicillin, ceftiofur, or cefquinome. Antimicrob. Agents Chemother. 2008;52:3612–3616. doi: 10.1128/AAC.00354-08. [DOI] [PMC free article] [PubMed] [Google Scholar]
- 27.Dimitriu T, et al. Genetic information transfer promotes cooperation in bacteria. Proc. Natl. Acad. Sci. 2014 doi: 10.1073/pnas.1406840111. 201406840. [DOI] [PMC free article] [PubMed] [Google Scholar]
- 28.Zatyka M, Thomas CM. Control of genes for conjugative transfer of plasmids and other mobile elements. FEMS Microbiol. Rev. 1998;21:291–319. doi: 10.1111/j.1574-6976.1998.tb00355.x. [DOI] [PubMed] [Google Scholar]
- 29.Cheah KC, Skurray R. The F plasmid carries an IS3 insertion within finO. J. Gen. Microbiol. 1986;132:3269–3275. doi: 10.1099/00221287-132-12-3269. [DOI] [PubMed] [Google Scholar]
- 30.Zaslaver A, et al. A comprehensive library of fluorescent transcriptional reporters for Escherichia coli. Nat. Methods. 2006;3:623–628. doi: 10.1038/nmeth895. [DOI] [PubMed] [Google Scholar]
- 31.Luo ML, Mullis AS, Leenay RT, Beisel CL. Repurposing endogenous type I CRISPR-Cas systems for programmable gene repression. Nucleic Acids Res. 2014 doi: 10.1093/nar/gku971. gku971. [DOI] [PMC free article] [PubMed] [Google Scholar]
- 32.Lutz R, Bujard H. Independent and tight regulation of transcriptional units in Escherichia coli via the LacR/O, the TetR/O and AraC/I1-I2 regulatory elements. Nucleic Acids Res. 1997;25:1203–1210. doi: 10.1093/nar/25.6.1203. [DOI] [PMC free article] [PubMed] [Google Scholar]
- 33.Song H, Payne S, Gray M, You L. Spatiotemporal modulation of biodiversity in a synthetic chemical-mediated ecosystem. Nat. Chem. Biol. 2009;5:929–935. doi: 10.1038/nchembio.244. [DOI] [PMC free article] [PubMed] [Google Scholar]
- 34.Levin BR, Stewart FM, Rice VA. The kinetics of conjugative plasmid transmission: Fit of a simple mass action model. Plasmid. 1979;2:247–260. doi: 10.1016/0147-619x(79)90043-x. [DOI] [PubMed] [Google Scholar]
- 35.Frost LS, Manchak J. F- phenocopies: characterization of expression of the F transfer region in stationary phase. Microbiology. 1998;144:2579–2587. doi: 10.1099/00221287-144-9-2579. [DOI] [PubMed] [Google Scholar]
- 36.Curtiss R, Charamella LJ, Stallions DR, Mays JA. Parental functions during conjugation in Escherichia coli K-12. Bacteriol. Rev. 1968;32:320–348. [PMC free article] [PubMed] [Google Scholar]
- 37.Hoekstra WPM, Havekes AM. On the role of the recipient cell during conjugation in Escherichia coli. Antonie Van Leeuwenhoek. 1979;45:13–18. doi: 10.1007/BF00400773. [DOI] [PubMed] [Google Scholar]
- 38.Wang YA, Yu X, Silverman PM, Harris RL, Egelman EH. The structure of F-pili. J. Mol. Biol. 2009;385:22–29. doi: 10.1016/j.jmb.2008.10.054. [DOI] [PMC free article] [PubMed] [Google Scholar]
- 39.Anthony KG, Sherburne C, Sherburne R, Frost LS. The role of the pilus in recipient cell recognition during bacterial conjugation mediated by F-like plasmids. Mol. Microbiol. 1994;13:939–953. doi: 10.1111/j.1365-2958.1994.tb00486.x. [DOI] [PubMed] [Google Scholar]
- 40.Curtiss R, et al. Energy requirements for specific pair formation during conjugation in Escherichia coli K-12. J. Bacteriol. 1967;94:490. doi: 10.1128/jb.94.2.490-492.1967. [DOI] [PMC free article] [PubMed] [Google Scholar]
- 41.Clarke M, Maddera L, Harris RL, Silverman PM. F-pili dynamics by live-cell imaging. Proc. Natl. Acad. Sci. 2008;105:17978–17981. doi: 10.1073/pnas.0806786105. [DOI] [PMC free article] [PubMed] [Google Scholar]
- 42.Händel N, Otte S, Jonker M, Brul S, ter Kuile BH. Factors that affect transfer of the IncI1 β-Lactam Resistance Plasmid pESBL-283 between E. coli Strains. PLoS ONE. 2015;10 doi: 10.1371/journal.pone.0123039. [DOI] [PMC free article] [PubMed] [Google Scholar]
- 43.Rawat D, Nair D. Extended-spectrum β-lactamases in gram negative bacteria. J. Glob. Infect. Dis. 2010;2:263–274. doi: 10.4103/0974-777X.68531. [DOI] [PMC free article] [PubMed] [Google Scholar]
- 44.Villalta JI, et al. New algorithm to determine true colocalization in combination with image restoration and time-lapse confocal microscopy to map kinases in mitochondria. PLoS ONE. 2011;6:e19031. doi: 10.1371/journal.pone.0019031. [DOI] [PMC free article] [PubMed] [Google Scholar]
- 45.Stecher B, et al. Gut inflammation can boost horizontal gene transfer between pathogenic and commensal Enterobacteriaceae. Proc. Natl. Acad. Sci. 2012;109:1269–1274. doi: 10.1073/pnas.1113246109. [DOI] [PMC free article] [PubMed] [Google Scholar]
- 46.Barkay T, Smets BF. Horizontal gene transfer: perspectives at a crossroads of scientific disciplines. Nat. Rev. Microbiol. 2005;3:675. doi: 10.1038/nrmicro1253. [DOI] [PubMed] [Google Scholar]
- 47.Thomas CM, Nielsen KM. Mechanisms of, and barriers to, horizontal gene transfer between bacteria. Nat. Rev. Microbiol. 2005;3:711–721. doi: 10.1038/nrmicro1234. [DOI] [PubMed] [Google Scholar]
- 48.Korem T, et al. Growth dynamics of gut microbiota in health and disease inferred from single metagenomic samples. Science. 2015;349:1101–1106. doi: 10.1126/science.aac4812. [DOI] [PMC free article] [PubMed] [Google Scholar]
- 49.Cormack BP, Valdivia RH, Falkow S. FACS-optimized mutants of the green fluorescent protein (GFP) Gene. 1996;173:33–38. doi: 10.1016/0378-1119(95)00685-0. [DOI] [PubMed] [Google Scholar]
- 50.Duffy DC, McDonald JC, Schueller OJA, Whitesides GM. Rapid Prototyping of microfluidic systems in poly(dimethylsiloxane) Anal. Chem. 1998;70:4974–4984. doi: 10.1021/ac980656z. [DOI] [PubMed] [Google Scholar]
Associated Data
This section collects any data citations, data availability statements, or supplementary materials included in this article.