

Abstract
Recent studies have shown that tissue macrophages (MΦ) arise from embryonic progenitors of the yolk sac (YS) and fetal liver and colonize tissues before birth. Further studies have proposed that developmentally distinct tissue MΦ can be identified based on the differential expression of F4/80 and CD11b, but whether a characteristic transcriptional profile exists is largely unknown. Here, we took advantage of an inducible fate‐mapping system that facilitated the identification of CD45+c‐kit− CX 3 CR1+F4/80+ (A2) progenitors of the YS as the source of F4/80hi but not CD11bhi MΦ. Large‐scale transcriptional profiling of MΦ precursors from the YS stage to adulthood allowed for building computational models for F4/80hi tissue macrophages being direct descendants of A2 progenitors. We further identified a distinct molecular signature of F4/80hi and CD11bhi MΦ and found that Irf8 was vital for MΦ maturation. Our data provide new cellular and molecular insights into the origin and developmental pathways of tissue MΦ.
Keywords: CX3CR1, fate mapping, gene profiling, Kupffer cells, macrophages, microglia
Subject Categories: Immunology
Introduction
Macrophages (MΦ) play an important role in maintaining tissue integrity and contribute to adaptive and innate immune responses. They are part of the mononuclear phagocyte system and were classically thought to derive from blood monocytes (van Furth & Cohn, 1968). This concept prevailed for nearly half a century (Ginhoux & Jung, 2014). Accumulating evidence, however, including recent studies using sophisticated fate‐mapping approaches, has determined that some tissue MΦ and their precursors are established embryonically in the yolk sac (YS) and fetal liver before the onset of hematopoiesis in the bone marrow (Ginhoux et al, 2010; Hoeffel et al, 2012; Schulz et al, 2012; Epelman et al, 2014; Molawi et al, 2014; Gomez et al, 2015). However, conflicting reports have recently been published suggesting a different origin for all tissue macrophages except microglia from sources of the definitive hematopoiesis (Sheng et al, 2015). Thus, the origin of tissue macrophages still awaits its full discovery. We therefore adapted our recently established Cx3cr1 CreER fate‐mapping system (Goldmann et al, 2013; Yona et al, 2013) to unequivocally determine the temporal and spatial origin of tissue macrophages and to investigate their full transcriptional program during ontogeny from the YS until adulthood.
Regardless of their origin, tissue MΦ can maintain themselves in adulthood through self‐renewal and thus independently of blood monocytes (Ajami et al, 2007; Mildner et al, 2007; Hashimoto et al, 2013; Sieweke & Allen, 2013; Yona et al, 2013). Recent studies have further proposed that the expression levels of the markers F4/80 and CD11b can be used to identify ontogenetically distinct MΦ populations in various tissues, but failed to determine genetic traits underlying this supposed heterogeneity (Schulz et al, 2012; Bain et al, 2014). Previous gene expression profiling of MΦ populations from several tissues has established that only a small number of mRNA transcripts were associate with all MΦ but not DCs. However, a core gene signature of all macrophages could be detected (Gautier et al, 2012). The impact of the tissue environment on MΦ signatures is now beginning to be unraveled. Epigenetic modifications are one of the conduits through which the organ‐specific environment can influence the established MΦ identities. The chromatin landscape, among other epigenomic features of a differentiated cell type, reflects both its developmental origin as well as its future potential. Two recent studies compared the tissue MΦ enhancer repertoire that revealed a tissue‐specific signature with considerable plasticity (Gosselin et al, 2014; Lavin et al, 2014).
However, the regulatory networks, the precise ancestry, and the mechanisms that describe tissue MΦ development from the YS stage to adulthood are largely unknown. By combining large‐scale transcriptome profiling with fate mapping, immunophenotyping, and confocal imaging, we provide a detailed description of F4/80hi tissue MΦ development from uncommitted erythromyeloid precursors (EMP; CD45−c‐kit+) via the MΦ ancestor populations A1 (CD45+c‐kitloCX3CR1loF4/80lo) and A2 (CD45+c‐kit−CX3CR1+F4/80+) in the YS to embryonic MΦ and then fully differentiated MΦ during adulthood. By using an A2 cell type‐based fate‐mapping system that tracks distinct YS cells, we can furthermore show that in contrast to a recent report (Sheng et al, 2015) several tissues contain F4/80hi MΦ that are derived from the YS. Moreover, besides anticipated tissue environment‐related genetic differences, we could identify a core signature in the embryonic and adult F4/80hi and CD11bhi MΦ population.
We further identified a transcriptional factor that is essential for both F4/80hi and CD11bhi MΦ homeostasis in vivo. There are several transcription factors proven to be important for myeloid cell development including Pu.1, which affects multiple lineages of the hematopoiesis in an early stage including the development of MΦ (Rosenbauer & Tenen, 2007). Additional transcription factors have been reported to play a role in the differentiation of myeloid cells such as interferon regulatory factor (Irf) 8 as a transcriptional factor of the IRF family (Rosenbauer & Tenen, 2007). IRF‐8 interacts with other transcription factors such as IRF‐1, IRF‐2, IRF‐4 and PU.1 (Tamura & Ozato, 2002). It is known that Irf8 has critical roles in the differentiation of myeloid cells, promoting monocyte over granulocyte differentiation (Tamura & Ozato, 2002). It is also a crucial regulator of many aspects of DC development, differentiation, and function (Tamura et al, 2008), thus holding an essential role in the establishment of innate immune responses. Although Irf8 is critical for the regulation of several myeloid cell lineages derived from hematopoietic stem cells (HSCs) including bone marrow‐derived macrophages (Tamura & Ozato, 2002), its role for tissue macrophages emerged from prenatal precursors from the YS or fetal liver, independent from HSCs, is unclear. In fact, recent work proposed a vital role of IRF‐8 only for circulating monocytes but not for tissue macrophages (Hambleton et al, 2011). In contrast to that report we show that both MΦ subsets (F4/80hi and CD11bhi) are strongly dependent on the transcription factor Irf8, which in our study influenced MΦ homeostasis. Our findings substantially increase the understanding of the regulatory processes that characterize tissue MΦ development in a highly dynamic microenvironment from the YS stage until adulthood.
Results
Temporospatial in vivo fate mapping and transcriptomics defines F4/80hi MΦ as descendants of A2 progenitors
In mice, the first hematopoietic progenitors appear in the extra‐embryonic YS where they generate nucleated erythrocytes and MΦ starting at embryonic day (E) 7.5–8.0 (Bertrand et al, 2005; Cumano & Godin, 2007). From E 8.0, multilineage erythromyeloid progenitors (EMPs) emerge in the YS as a second wave that are thought to give rise to tissue MΦ in the brain (Kierdorf et al, 2013; Prinz & Priller, 2014) and other tissues as well (Gomez et al, 2015). After E 9.0, the intra‐embryonic mesoderm commits to the hematopoietic lineage and new waves of hematopoietic progenitors emerge: first in the para‐aortic splanchnopleura (P‐Sp) region and then in the aorta‐gonad‐mesonephros (AGM) region (Cumano & Godin, 2007).
To follow the fate of myeloid cells during early embryogenesis, we first used Cx3cr1 GFP/WT mice, which have a GFP knock‐in on one allele of the Cx3cr1 gene. CX3CR1 is expressed in mature monocytes as well as many tissue MΦ and their precursors (Yona et al, 2013). To determine at which time point the YS contains progenitor cells with MΦ features, we analyzed E 9.0 embryos by thorough confocal microscopy (Fig 1A and B). We detected two distinct populations in the YS at this time point: CD31+c‐kit+ EMPs and CX3CR1+F4/80+ early MΦ (Bertrand et al, 2005). Notably, CX3CR1+F4/80+ cells were found in the YS but not in the P‐Sp region indicating a largely YS‐centered localization of early MΦ progenitors at this developmental stage. By separation of CD45+ cells, we were able to discriminate between two MΦ precursor subsets, CD45+CX3CR1loF4/80lo A1 cells and CD45+CX3CR1hiF4/80hi A2 progenitors as described before (Bertrand et al, 2005; Kierdorf et al, 2013) (Fig 1C).
Figure 1. Temporospatial in vivo fate mapping of yolk sac MΦ and transcriptional ancestry of F4/80hi tissue MΦ during ontogeny.
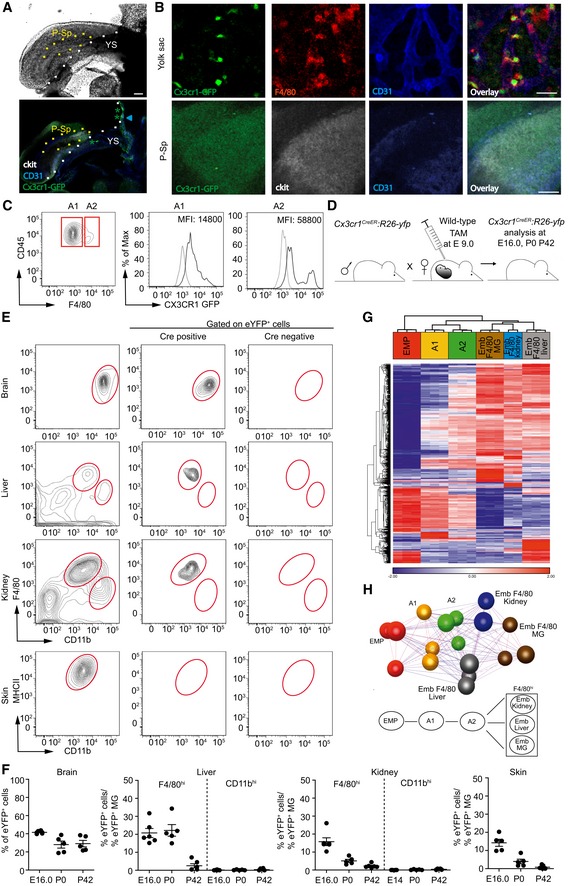
- Overview images of hematopoietic sites in an E 9.0 embryo depicting the yolk sac (YS) and para‐aortic splanchnopleura region (P‐Sp) with phase contrast (upper image) and direct fluorescence microscopy (lower image). Stars indicate CX3CR1+ cells (green) and arrowhead points to c‐kit+/CD31+ EMPs (blue/white) in the YS. Scale bar represents 100 μm. One representative picture out of five independent experiments is displayed.
- Higher magnifications of the YS and P‐Sp. CX3CR1‐GFP expression (green) is found in the YS but not in the P‐Sp, where only background staining is present. F4/80 (red), CD31 (blue), c‐kit (white). Scale bars represent 50 μm. Representative pictures out of five independent experiments are shown.
- Flow cytometric analysis of MΦ precursors in the YS of E 9.0 Cx3cr1 GFP/WT animals (A1: CD45+c‐kitloCX3CR1loF4/80lo, A2: CD45+c‐kit−CX3CR1+F4/80+). Mean fluorescent intensity (MFI) is presented. Four mice were investigated showing similar results.
- Fate‐mapping strategy to target the A2 progenitor population preferentially in the YS. Male Cx3cr1 CreER :R26‐yfp mice were bred to wild‐type animals, and plug‐positive mice were injected at E 9.0 with tamoxifen (TAM). Offspring was analyzed at E 16.0, P0 or P42.
- Flow cytometry of F4/80hiCD11blo and F4/80loCD11bhi tissue MΦ in adult (P42) Cx3cr1 CreER :R26‐yfp mice. Cre‐negative mice served as a control. Representative histograms from three independent experiments are displayed.
- Quantification of YFP labeling in tissue MΦ at E 16.0, P0, and P42 after TAM application at E 9.0 in plug‐positive Cx3cr1 CreER :R26‐yfp mice. Data are normalized to YFP+ microglia and presented as mean ± s.e.m. At least one experiment out of two is shown, and each symbol presents one mouse.
- Hierarchical clustering of the 1,000 most variable probes within the dataset of embryonic development of yolk sac‐derived tissue MΦ (EMP: erythromyeloid precursor, A1/A2: yolk sac MΦ progenitors, Emb F4/80 MG: embryonic microglia, Emb F4/80 liver: embryonic Kupffer cells, Emb F4/80 kidney: embryonic F4/80 kidney cells). Heat map displays z‐transformed log2‐expression values from red to blue via white.
- Above: Sample‐wise co‐regulation network of embryonic MΦ development. Pearson correlation threshold of 0.92 was used to generate the network. Below: scheme thereof.
From our previous studies, we know that microglia derive from the A2 progenitors of the YS (Kierdorf et al, 2013). Recently, it was suggested that the progenitor for microglia and other tissue MΦ are different from each other (Hoeffel et al, 2015; Sheng et al, 2015). However, our hypothesis was that F4/80hi MΦ derive from the A2 progenitors of the YS as well. To perform fate mapping and subsequent gene profiling of tissue MΦ during ontogeny, we next adapted our recently developed Cx3cr1 CreER mouse system (Goldmann et al, 2013; Yona et al, 2013) to target A2 progenitors only (Fig 1D). Male Cx3cr1 CreER: Rosa26‐fl‐STOP‐fl‐yfp (Cx3cr1 CreER:Rosa26‐yfp) mice were crossed to female wild‐type mice, and plug‐positive animals were injected with a single intraperitoneal dose of tamoxifen (TAM) at E 9.0. The application of TAM at E 9.0 induced the recombination of CX3CR1+ progenitor cells and therefore also targeted A2‐derived microglia (Fig EV1A and B). Importantly, to prove the specificity of our approach, we additionally investigated the recombination efficiency in microglia of E 16.0 embryos after TAM application at E 7.0 and E 8.0 (Fig EV1B). TAM application at E 8.0 but not at E 7.0 was able to target a small population of A2‐derived microglia (YFP+ cells = 17.7 ± 1.3%) as well as liver (YFP+ cells = 13.2 ± 1.4%) and kidney (YFP+ cells = 15 ± 3.1%) F4/80hi MΦ. This result shows that the TAM‐induced Cre recombination is restricted to a very limited time window of maximal 1 day. No CX3CR1+ HSCs were present in the E 10.0/E 10.5 AGM or fetal liver proving that we do not target HSCs in our approach (Fig EV1C and D). Therefore, specific targeting of A2 progenitors by TAM injection at E 9.0 induced efficient YFP labeling of 41.6 ± 0.6% brain microglia, 20.8 ± 2.5% F4/80hi Kupffer cells, 15.8 ± 2.2% F4/80hi kidney MΦ, and 14.2 ± 1.9% MHC II+ CD11b+skin MΦ at E 16.0, indicating robust labeling efficiency of various A2‐derived MΦ progeny (Fig 1F). Microglia in 6‐week‐old animals retained the YFP label, demonstrating that A2‐derived cells persists until adulthood, whereas labeling of Kupffer cells, Langerhans cells, and F4/80hi kidney cells was present but dropped after birth (Figs 1E and F, EV1E and EV2 ). This might be due to a replacement by fetal liver‐derived cells as suggested by others (Hoeffel et al, 2012; Gomez et al, 2015). In contrast, CD11bhi tissue MΦ were not labeled in this approach (Fig 1E and F). Collectively, these data suggest that F4/80hi tissue MΦ are initially derived from CX3CR1+ A2 cells in the YS, whereas CD11bhi tissue MΦ develop independently from A2 cells.
Figure EV1. Targeting of A2 precursors in the yolk sac labels F4/80hi MΦ (related to Fig 1).
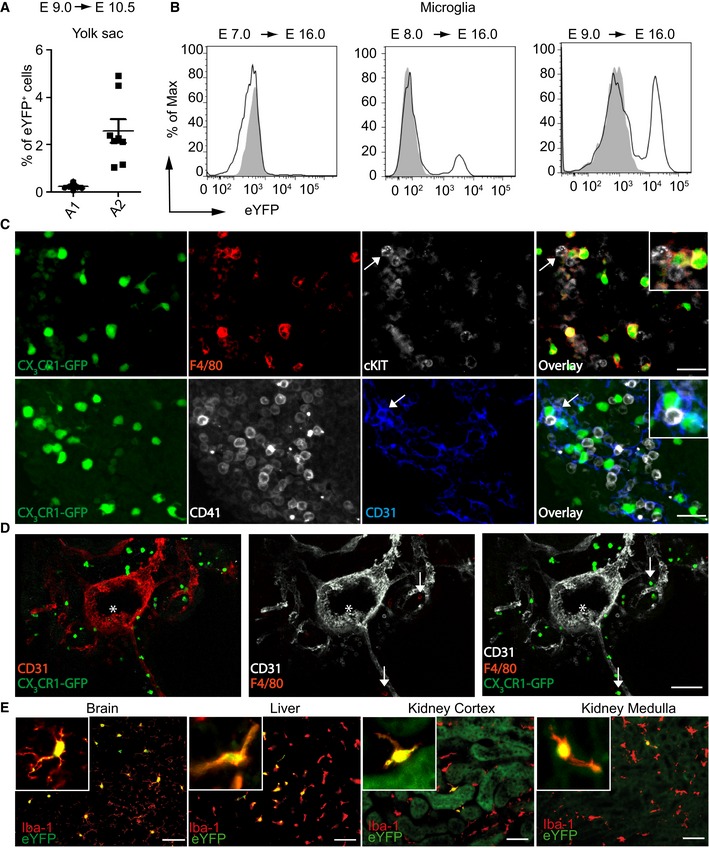
- Flow cytometric quantification of YFP+ A1 and A2 yolk sac cells at E 10.5 after TAM application at E 9.0 in pregnant Cx3cr1 CreER :R26yfp mice. Each symbol represents one mouse. Data represent mean ± s.e.m. Two independent experiments are depicted.
- Efficacies of microglia targeting (YFP+CD11b+CD45lo) at E 16.0 after TAM application either at E 7.0, E 8.0, or E 9.0 in plug‐positive Cx3cr1 CreER :R26‐yfp mice. One representative blot is shown. Gray area depicts fluorescence signal in MΦ of non‐transgenic littermates. At least three mice with similar results were investigated.
- Representative images of the fetal liver in E 10.5 Cx3cr1 GFP/WT embryos. CX3CR1‐GFP expression (green), F4/80 (red), CD31 (blue), c‐kit, or CD41 (white). Arrow points to a c‐KIT‐ and CD31‐positive cell. No co‐localization of CD31, CD41, or c‐KIT with CX3CR1‐GFP+ cells was detected. Scale bars represent 50 μm. Representative pictures out of two embryos are shown.
- Representative images of the AGM in E 10.0 Cx3cr1 GFP/WT embryos. CX3CR1‐GFP expression (green), CD31 (white or red), F4/80 (red). No CX3CR1‐GFP signal is observed close to native HSC (* marks the HSC cluster in the aorta). CX3CR1‐GFP+ cells are close to vessels; some are also F4/80+ (arrows). Scale bars represent 100 μm. Representative pictures out of two embryos are shown.
- Immunofluorescence of YFP (green) and Iba‐1 (red) from brain, liver, and kidney of adult (P42) Cx3cr1 CreER :R26‐yfp mice that received TAM at E 9.0. Scale bars represent 25 μm.
Figure EV2. Gating strategy used for flow cytometry of MΦ (related to Figs 1, 2, 3, 4, 5, 6).
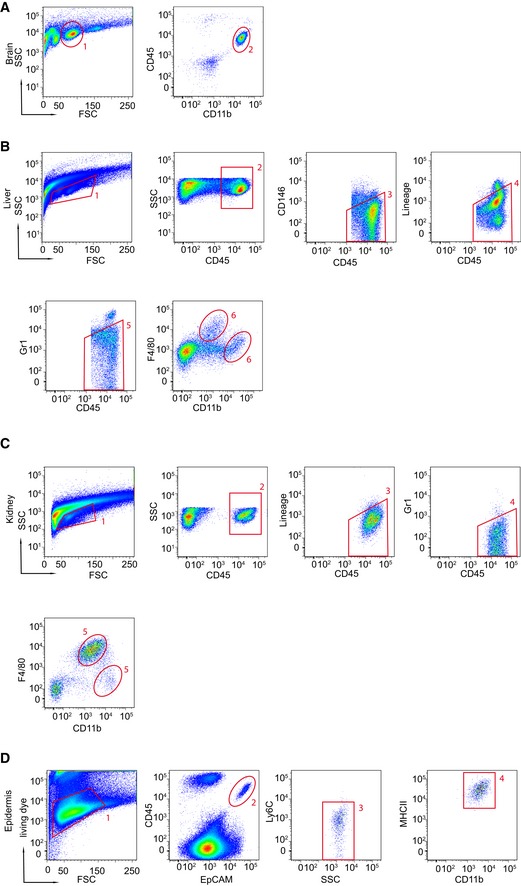
- Microglia were discriminated by CD45 and CD11b.
- Liver cells were gated for CD45‐positive cells; CD146, lineage‐ (CD3, CD19, NK1.1) and Gr1‐positive cells were excluded to select CD11bhi and F4/80hi MΦ as described recently (Huang et al, 2013).
- Kidney cells were gated on CD45+ cells followed by the exclusion of lineage markers (CD3, CD19, NK1.1) and Gr1+ cells to select the CD11bhi and F4/80hi MΦ.
- Epidermal cells were first selected by a living dye stain, followed by selection of CD45+, EpCAM+, Ly6C−, MHCII+, and CD11b+ characteristics.
After having established an A2 YS‐dependent labeling system, we isolated EMP from E 8.0 YS, A1 and A2 cells from E 9.0 YS, and embryonic F4/80hi MΦ from E 14.5 brain, liver, and kidney and performed a whole‐genome expression analysis using the Affymetrix Mouse Gene 2.1 ST Array. Subsequent investigation of the 1,000 most variable transcripts by hierarchical clustering (Fig 1G) and generating a co‐regulation network based on all expressed transcripts (Fig 1H) revealed that EMPs represent an early step in MΦ hierarchy followed by the YS populations A1 and A2, while A2 cells obviously represent a nodal point of tissue MΦ development (Fig 1G and H). These data suggest that the MΦ populations analyzed gain their own tissue‐specific signature once they have left the YS and that A2 YS progenitors are ancestors of embryonic F4/80hi tissue MΦ.
Difference in maintenance of F4/80hi and CD11bhi MΦ after birth
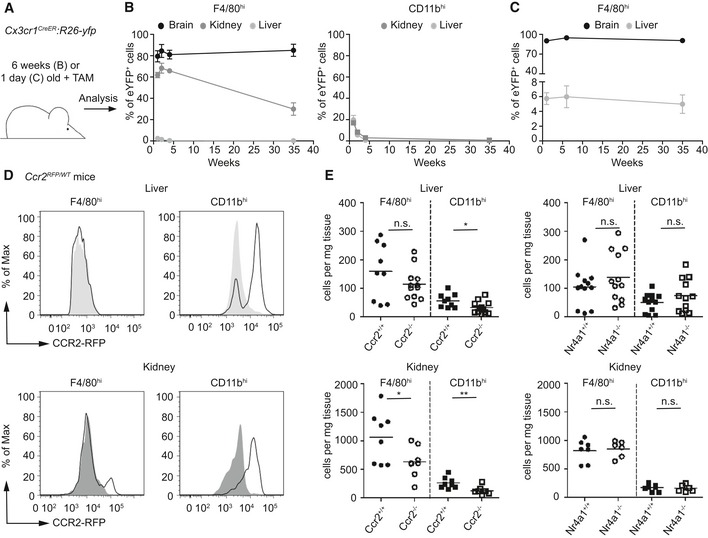
Once established in the CNS, microglia persist throughout the entire life of the organism without any significant input from circulating blood cells due to their longevity and their capacity for self‐renewal (Ajami et al, 2007; Mildner et al, 2007). We therefore sought to use this unique feature of microglia to compare the kinetics of persistence with F4/80hi and CD11bhi cells from the kidney and liver. For this purpose, we induced adult Cx3cr1 CreER :R26‐yfp animals with TAM and determined MΦ labeling at several time points after application (Fig 2A–C). FACS analysis demonstrated long‐term labeling of microglia and F4/80hi kidney MΦ with virtually no turnover in microglia and low turnover in F4/80hi kidney MΦ (exchange rate: approx. 2%/week). In contrast, YFP labeling rapidly dropped in CD11bhi cells in liver and kidney indicating higher turnover rates (approx. 32%/week for both organs). Notably, Kupffer cells dynamically express CX3CR1 during development but lose their expression shortly after birth which is why their turnover cannot be monitored during adulthood (Yona et al, 2013). To circumvent these limitations, we adapted our Cx3cr1 CreER :R26‐yfp system and induced recombination shortly after birth when F4/80hi Kupffer cells still express CX3CR1 (Fig 2C). We successfully targeted at least a subpopulation of the F4/80hi Kupffer cells. Similar to their relatives in the brain, this Kupffer cell population remained a remarkably stable population until 9 months of age. To evaluate a possible contribution of blood cells to the macrophage populations, we evaluated the contribution of both Ly6Chi and Ly6Clo monocytes. We first measured the expression of monocyte‐related CCR2 that was absent on F4/80hi Kupffer cells, only partially present on F4/80hi kidney MΦ but clearly present on CD11bhi MΦ (Fig 2D). Furthermore, we provide genetic evidence that Ly6Chi monocytes contributed to the homeostasis of F4/80hi kidney MΦ as well as CD11bhi MΦ shown by reduced cell numbers in mice lacking Ccr2 (Fig 2E). In contrast, Ly6Clo monocytes were dispensable for F4/80hi and CD11bhi MΦ development and homeostasis as mice lacking Nr4a1 presented with normal amounts of MΦ subsets in liver and kidney (Fig 2E). These data indicate that adult microglia and Kupffer cells are stable populations which do not undergo significant exchange with blood cells within the first 9 months of life. In contrast, adult F4/80hi kidney MΦ are partially replaced by blood monocytes, whereas adult CD11bhi MΦ found in the liver and kidney have a fast and continuous exchange with circulating CCR2‐dependent progenitors, most likely Ly6Chi monocytes.
Figure 2. Differences in turnover of CX 3 CR1+ CD11bhi and F4/80hi tissue MΦ after birth.
-
AScheme of fate mapping in Cx3cr1 CreER :R26‐yfp mice that were either treated at 6 weeks of age (for B) or at postnatal day 1 (for C) and analyzed at 6 days, 2, 4, and 35 weeks (for B) and 6 days, 6 and 35 weeks (for C).
-
B, CFlow cytometric quantifications of YFP+ MΦ in the brain, liver, and kidney at the indicated time points after TAM application in Cx3cr1 CreER :R26‐yfp mice. Data are summarized from two independent experiments (7–8 mice each) and represented as mean ± s.e.m.
-
DCCR2 expression on F4/80hi and CD11bhi MΦ in the liver or kidney of adult Ccr2 RFP/WT mice, respectively. Gray area depicts fluorescence signal in MΦ of non‐transgenic littermates. Representative cytometric graphs are shown. Four mice were investigated showing similar results.
-
EFlow cytometric analysis of MΦ populations in the liver or kidney in adult mice lacking Ccr2 or Nr4a1. Each symbol represents one mouse. Data are summarized from three independent experiments and represent mean ± s.e.m. Significant differences were determined by an unpaired t‐test. n.s.: not significant. *P < 0.05, **P < 0.01.
Distinct gene profiles of F4/80hi and CD11bhi MΦ during ontogeny
The results presented above suggested that microglia and F4/80hi MΦ from liver and kidney are derived from CD45+CX3CR1hiF4/80hi A2 progenitors in the YS, whereas CD11bhi MΦ seem to originate from later hematopoietic sources, for example, elements from the definitive hematopoiesis (Ginhoux & Jung, 2014). Thus, we examined whether this divergent origin is mirrored by a distinct gene profile. To do so, we performed an unsupervised clustering analysis of genomewide expression arrays from embryonic (Fig 3A) and adult (Fig 3B) F4/80hi MΦ in comparison with the CD11bhi populations. Hierarchical clustering based on the 1,010 most differentially expressed genes revealed that all F4/80hi MΦ in the brain, liver, and kidney shared a common signature of expressed genes, which was clearly distinct from the CD11bhi cells. Importantly, F4/80hi versus CD11bhi MΦ clustering was not only present prior to birth as described recently (Schulz et al, 2012) but was still detectable in adulthood (Fig 3A and B). Based on the clear cut separation of F4/80hi versus CD11bhi MΦ by hierarchical cluster analyses, we created two groups, including only the embryonic or adult F4/80hi (microglia, liver and kidney) or CD11bhi (liver and kidney) MΦ and excluded genes that were significantly differentially expressed within one of the groups (Fig 3C and D). This approach confirmed the hypothesis of robust similarities within MΦ subgroups rather than within different MΦ populations in the same organ (Fig 3D). Notably, only adult Langerhans cells were transcriptionally separate from both adult F4/80hi and CD11bhi MΦ in other tissues emphasizing their distinct ancestry and kinetics compared to other MΦ as described before (Hoeffel et al, 2012) (Fig 3B and E). Up‐ and down‐regulated genes in F4/80hi versus CD11bhi MΦ were examined thoroughly (Fig 3F–I). The hemoglobin Y, beta‐like embryonic chain (Hbb‐y), and hemoglobin X, alpha‐like embryonic chain in Hba complex (Hba‐x), were highly enriched in embryonic F4/80hi MΦ of all tissues reflecting their common origin with erythrocytes from the EMP. Two E3 ubiquitin‐protein ligases, namely Rnf135 and March8 that mediate ubiquitination of immune molecules such as CD86, MHC class II, and RIG‐I, were more highly expressed in adult F4/80hi MΦ compared to CD11bhi MΦ. On the contrary, solute carrier family 7, member 11 (Slc7a11), involved in the protection from oxidative stress, and prostaglandin‐endoperoxide synthase 2 (Ptgs2, also known as cyclooxygenase‐2; Cox‐2) involved in the regulation of inflammatory responses were highly up‐regulated in adult CD11bhi MΦ. Additionally, adult CD11bhi MΦ were characterized by the enhanced expression of the chemokine receptor Ccr2 and the growth factor Flt3 that is present in multipotent hematopoietic progenitors. Complementary to the above data showing a contribution of Ly6Chi monocytes to F4/80hi kidney MΦ, Ccr2 was also expressed in a high manner in this MΦ population. Long‐living adult F4/80hi MΦ, however, expressed high levels of the transcription factor Maf and the macrophage colony‐stimulating factor (Csf1r). We further visualized additional prominent examples of differentially expressed genes between F4/80hi and CD11bhi MΦ in different tissues during embryogenesis and adulthood related to macrophage function such as cytokines and other secreted proteins, antigen capturing molecules, proteolytic enzymes, cell surface markers, and transcription factors (Fig EV3 and Table EV1). Taken together, our observations suggest that a distinct genetic profile of F4/80hi and CD11bhi MΦ is present prenatally and in adulthood.
Figure 3. Distinct gene profile of F4/80hi and CD11bhi MΦ from embryogenesis until adulthood.
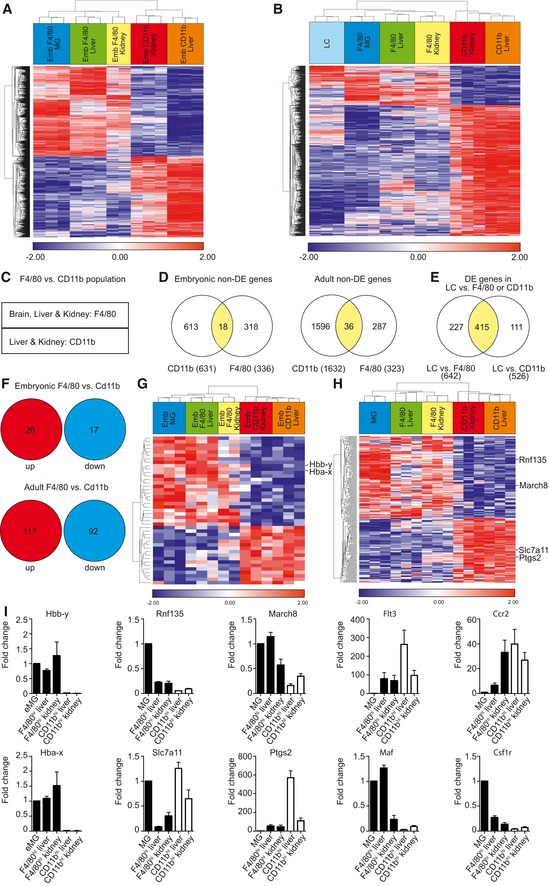
- Hierarchical clustering created on the 1,010 most significantly differentially expressed (DE) genes between embryonic (Emb) F4/80hi and CD11bhi cells. Heat map displays z‐transformed log2‐expression values from red to blue via white.
- Hierarchical clustering based on the 755 most significantly differentially expressed genes between adult F4/80hi and CD11bhi cells. Heat map shows z‐transformed log2‐expression values from red to blue via white.
- Scheme describing the compared samples of F4/80hi (microglia, liver, kidney) and CD11bhi (liver, kidney) tissue MΦ populations for analysis shown in (D–I).
- Venn diagrams overlaying the genes which are jointly expressed in F4/80hi or in CD11bhi cells at similar levels irrespective of tissue origin (“non‐differentially expressed (non‐DE) genes”) defined by a false discovery rate (FDR) adjusted P‐value > 0.95 for both embryonic and adult cells separately. Numbers in parentheses indicate the amount of all genes for each MΦ population.
- Venn diagram shows the differentially expressed (DE) genes between adult Langerhans cells (LC) and adult F4/80hi or CD11bhi cells (functional connectivity |FC| > 1.5, FDR adjusted P‐value < 0.05).
- Number of up‐ and down‐regulated genes in F4/80hi versus CD11bhi populations (|FC| > 1.5, FDR adjusted P‐value < 0.05) from genes fulfilling the criteria in (D), that is, non‐DE genes between organs for each group.
- Hierarchical clustering of embryonic F4/80hi and CD11bhi cells based on 43 DE genes in embryonic cells visualized in (F). Heat map exhibits z‐transformed log2 expression values from red to blue via white.
- Hierarchical clustering of adult F4/80hi and CD11bhi cells based on 209 DE genes in adult cells visualized in (F). Heat map presents z‐transformed log2 expression values from red to blue via white.
- Quantitative RT–PCR of differentially expressed genes depicted in (G and H). Analyses of differentially expressed genes in embryonic (Hbb‐y and Hba‐x) or adult (Rnf135, March8, Slc7a11, Ptgs2, Flt3, Ccr2, Maf, and Csf1r) tissue macrophages. Data are normalized to β‐actin and GAPDH and expressed as ratio of the mRNA expression compared to microglia and show mean ± s.e.m. Three mice per group were analyzed.
Figure EV3. Visualization of genes differentially expressed between F4/80hi and CD11bhi MΦ during embryogenesis and adulthood (related to Fig 3).
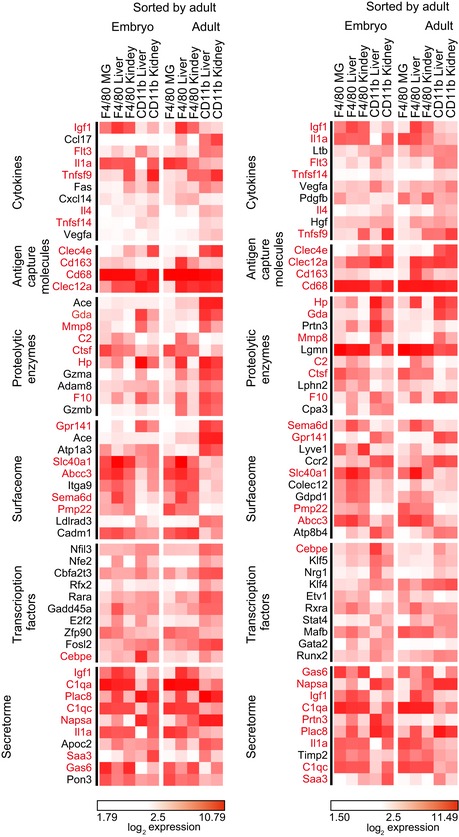
Heat map visualization of differentially expressed genes between F4/80hi and CD11bhi MΦ in different tissues during embryogenesis and adulthood. The top 10 genes based on fold change (FC) (left panel: FC F4/80hi vs. CD11bhi in adult; right panel: FC F4/80hi vs. CD11bhi in embryo) among the differentially expressed genes related to macrophage function such as cytokines, antigen capturing molecules, proteolytic enzymes, cell surface markers, and transcription factors are shown. Values are represented in log2 expression. Genes being common in both heat maps are highlighted by red color.
Irf8 is expressed in F4/80hi and CD11bhi MΦ during ontogeny
In addition to CSF‐R1, several transcription factors such as PU.1 (encoded by Sfpi) and Runx1 have been shown to be important for the lineage commitment in myeloid cells (Rosenbauer & Tenen, 2007). It is well established that PU.1 can act alone or in association with other transcription factors such as IRF8 (Rosenbauer & Tenen, 2007). To determine which transcription factors are present during macrophage development, we measured Runx1, Sfpi, and Irf8 levels in sorted EMP, A1 and A2 cells, embryonic microglia, and F4/80hi and CD11bhi MΦ from kidney and liver (Fig 4A). Irf8 and Sfpi were barely detectable in EMP, whereas Runx1 was strongly expressed. Notably, Irf8, Runx1, and Sfpi mRNA levels were continuously expressed during prenatal macrophage development, suggesting that these transcription factors play an important role for these macrophage populations. Since Irf8 was described to play an essential role in the development of microglia, especially in the maturation of the A1 to A2 progenitor populations in the YS (Kierdorf et al, 2013), we hypothesized that Irf8 might also be required for other YS‐derived F4/80hi MΦ populations. As expected, in the E 9.0 YS especially A2 cells expressed IRF8 as visualized in Irf8‐VENUS PAC reporter mice (Fig 4B).
Figure 4. Irf8 is broadly expressed in tissue MΦ.
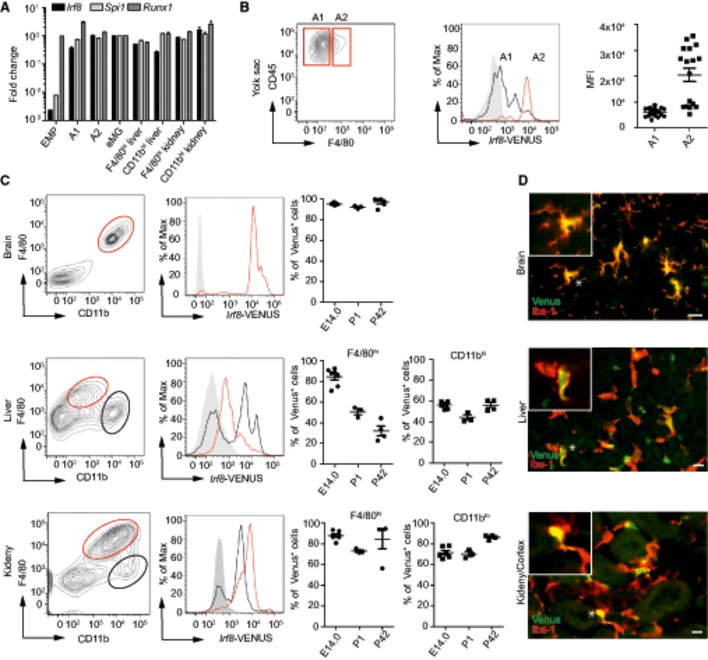
- Quantitative qRT–PCR of transcription factors during MΦ development. Data are normalized to β‐actin and GAPDH and expressed as ratio of the mRNA expression compared to embryonic microglia and show mean ± s.e.m. Two to three mice per group were analyzed.
- Irf8‐VENUS expression on A1 and A2 progenitor cells isolated from the E 9.0 yolk sac of Irf8‐Venus PAC reporter mice. Representative blots obtained from 17 individual embryos are shown. Mean fluorescence intensity (MFI) of Irf8‐VENUS signal in A1 and A2 progenitor cells. Each symbol represents one mouse. Data are from one representative experiment out of two and represented as mean ± s.e.m.
- Flow cytometric measurement of the Irf8‐VENUS signal in brain, liver, and kidney MΦ from E 14.0, postnatal (P1), and adult (P42) Irf8‐VENUS PAC reporter mice. Representative density blots are shown (left) and quantification thereof (right). Each symbol represents one mouse. Data are from one representative experiment and displayed as mean ± s.e.m.
- Representative immunofluorescence images of Venus (green) and Iba‐1+ (red) MΦ from brain, liver, and kidney of adult Irf8‐VENUS PAC reporter mice. Stars indicate the cell shown in the insert. Scale bar represents 10 μm.
We next determined whether IRF8 expression is strictly developmentally regulated or whether it is also expressed in adult MΦ during homeostasis (Fig 4C and D). Microglia constantly expressed high levels of IRF8 from embryogenesis until adulthood (Fig 4C). Notably, CD11bhi and F4/80hi MΦ in the liver and kidney were strongly positive for the Irf8‐VENUS signal suggesting an essential role of this transcription factor for MΦ maintenance.
Irf8 regulates tissue MΦ homeostasis
To assess the function of IRF8 in MΦ under steady‐state conditions during adulthood, we used Irf8 −/− mice to quantify the number of MΦ in brain, liver, and kidney and performed a thorough morphometric analysis of these cell populations (Fig 5). Irf8‐deficient microglia exhibited drastic changes in their morphology including a significant decrease in their dendritic branching, assessed by filament length and number of dendrite terminal points per cell, whereas the cell number was increased (Fig 5A). Similarly, liver MΦ in Irf8 −/− mice were characterized by a significantly reduced cell surface and volume as well as cell number (Fig 5B). In contrast, the number of kidney MΦ was significantly reduced by Irf8 deficiency; the morphometric parameters, however, were unchanged (Fig 5C). Despite these severe effects on tissue MΦ, the organ function of the liver and kidney under homeostatic conditions was unimpaired in Irf8‐deficient animals (Fig EV4).
Figure 5. Lack of Irf8 impairs tissue MΦ homeostasis.
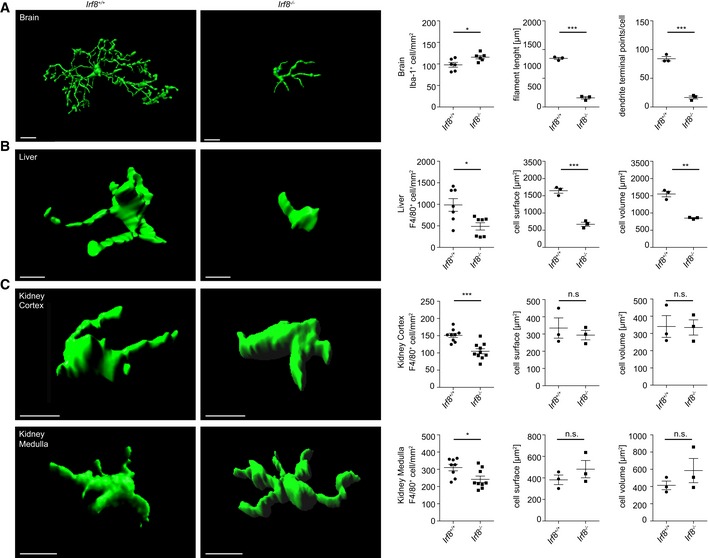
-
A–CThree‐dimensional reconstruction (left) and Imaris‐based morphometric analysis of CX3CR1+ brain microglia or F4/80+ liver and kidney MΦ in adult Irf8 −/− or Irf‐8 +/+ mice, respectively. Quantification of cell density of Iba‐1+ microglia and F4/80+ liver and kidney MΦ in adult Irf8 −/− or Irf‐8 +/+ mice, respectively (left). Scale bars represent 10 μm. For morphological measurements, each symbol represents one mouse with at least six examined cells per mouse. Data represent mean ± s.e.m. Significant differences were examined by an unpaired t‐test and marked with asterisks (*P < 0.05, **P < 0.01, ***P < 0.001); n.s.: not significant.
Figure EV4. Normal liver and kidney parameters in Irf8‐deficient mice under homeostatic conditions (related to Fig 5).
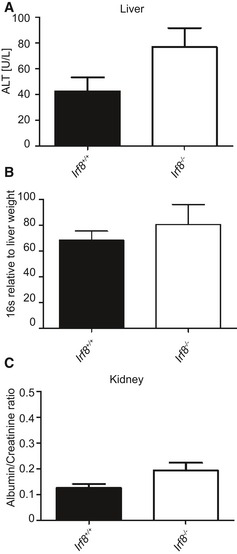
- Alanine aminotransferase (ALT) activity in the serum of adult Irf8 −/− and Irf8 +/+ mice.
- qPCR analysis for bacterial 16S rRNA in the livers of adult Irf8 −/− and Irf8 +/+ animals
- Albumin:creatinine ratio in the urine of adult Irf8 −/− and Irf8 +/+ mice. Bars represent mean ± s.e.m. of at least three mice per group. Significant differences were not detectable by using an unpaired t‐test.
To further analyze the impact of Irf8‐deficiency on tissue MΦ under homeostatic conditions, we performed a detailed transcriptional analysis. The number of differentially expressed genes between Irf8 +/+ and Irf8 −/− mice was higher in the embryonic compared to the adult MΦ cell populations (Fig 6A). Moreover, Irf8 deficiency had an influence on the transcriptional pattern of both F4/80hi and CD11bhi MΦ populations (Fig 6A–C). The genes commonly up‐ (red) or down (blue)‐regulated in embryonic and adult CD11bhi or F4/80hi MΦ populations exhibited distinct gene ontology (GO) clusters (Fig 6D). Obviously, genes related to the immune system were down‐regulated in all Irf8 −/− MΦ populations suggesting an impact of IRF8 on the immune response of these cells. Quantitative RT–PCR performed with the adult MΦ populations confirmed this finding by showing a down‐regulation of Toll‐like receptor 12 (Tlr12), major histocompatibility complex class II, DM alpha (H2‐DMa), and basic leucine zipper transcription factor and ATF‐Like 3 (Batf3) in Irf8 −/− F4/80hi MΦ (Fig 6E). Moreover, Cd36, Fc fragment of IgG, high affinity Ia, receptor (Fcgr1 also known as Cd64), and Irf7 were down‐regulated in Irf8 −/− CD11bhi MΦ (Fig 6E). All of these genes are involved in immune response or regulation of type I interferons. Suppression of MHC class II expression on Irf8 −/− MΦ was additionally confirmed by immunohistochemistry (Fig EV5). In sum, these data provide clear evidence for an essential role of IRF8 for ensuring proper MΦ maturation throughout development and adulthood in both F4/80hi and CD11bhi MΦ.
Figure 6. Altered gene transcription profile in MΦ lacking Irf8 .
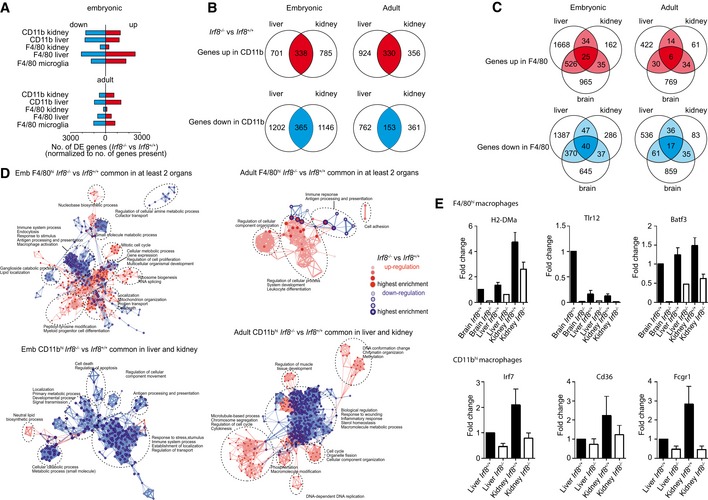
- Number of differentially expressed (DE) genes between Irf8 +/+ and Irf8 −/− mice in several embryonic and adult MΦ cell populations. DE genes were identified by a one‐way ANOVA model (|FC| > 1.5, FDR adjusted P‐value < 0.05). The absolute numbers were normalized to the number of genes present in embryonic or adult cells.
- Venn diagrams of DE genes between Irf8 +/+ and Irf8 −/− CD11bhi cells from adult or embryonic liver and kidney. Commonly up‐ (red area) and down‐regulated (blue area) genes between cells derived from Irf8 +/+ and Irf8 −/− mice are shown.
- Venn diagrams of DE genes for F4/80hi cells from adult or embryonic liver, kidney, and brain. Commonly up‐ (red area) and down‐regulated (blue area) genes are shown.
- Gene Ontology (GO) network built on common DE genes in embryonic (left panel) and adult (right panel) F4/80hi (upper row) CD11bhi (lower row) cells from microglia, liver, and kidney identified in at least two organs (identified in B and C). Red symbols represent GO terms associated with up‐regulated genes in Irf8 −/− compared to Irf8 +/+ mice, while blue edges indicate down‐regulation.
- Quantitative qRT–PCR of selected genes in tissue MΦ from adult Irf8 −/− and Irf8 +/+ mice. Data are normalized to β‐actin and GAPDH and expressed as ratio of the mRNA expression compared to microglia of Irf8 +/+ mice or to liver CD11bhi cells of Irf8 +/+ mice and show mean ± s.e.m. Three mice per group were analyzed.
Figure EV5. Down‐regulation of MHC class II in Irf8‐deficient mice (related to Fig 6).
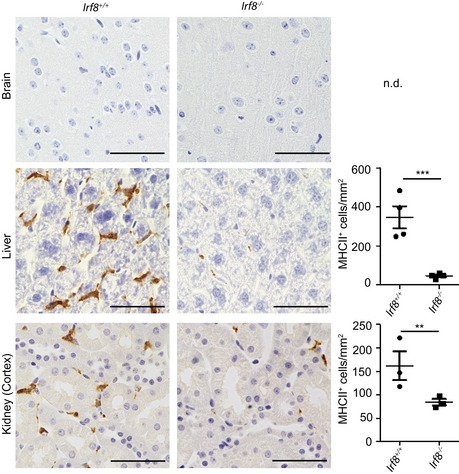
MHCII immunohistochemistry of brain, liver, and kidney MΦ in adult Irf8 −/− or Irf‐8 +/+ mice (left) and quantification thereof (right). Scale bar represents 50 μm. Each symbol represents one mouse with at least four examined tissue section per mouse. Significant differences were examined by an unpaired t‐test and marked with asterisks (**P < 0.01, ***P < 0.001); n.d.: not detectable.
Discussion
Herein we describe, based on a novel fate‐mapping system using Cx3cr1 CreER mice to specifically target A2 progenitors in the YS, the origin and turnover as well as the unique transcriptional pattern of F4/80hi and CD11bhi MΦ in the liver, kidney, brain, and epidermis and thereby identified Irf8 as an important transcription factor for proper MΦ maturation.
To date, F4/80hi MΦ were mainly believed to be YS‐derived, whereas CD11bhi MΦ were shown to originate from the definitive hematopoiesis (Schulz et al, 2012; Gomez et al, 2015). However, this view was recently challenged by a study claiming that only microglia are YS‐derived, whereas all other tissue MΦ are fetal liver‐derived (Sheng et al, 2015). In contrast, our data do not support the idea of a complete fetal liver origin of all tissue F4/80hi MΦ except microglia but instead confirm earlier reports on the YS origin of most F4/80hi tissue MΦ (Schulz et al, 2012; Gomez et al, 2015). These studies provided clear evidence that EMPs, localized in the YS, are the non‐committed progenitors of tissue MΦ. Our own data add exciting new facets to the YS origin of tissue MΦ. Using a new fate‐mapping strategy in Cx3cr1 CreER:Rosa26‐yfp mice combined with transcriptional analysis, we place the A2‐progenitor population of the YS as the direct precursors of microglia and partially F4/80hi MΦ in the liver and kidney as well as Langerhans cells. By confocal microscopy of E 9.0 and E 10.0/10.5 embryos and the E 9.0 YS, we proved that CX3CR1+ cells are exclusively present in the YS but not in the P‐Sp/AGM or fetal liver at these time points and are therefore the only progenitor cells which are targeted by our fate‐mapping strategy. Additionally, our results show that, except for microglia, the YS‐derived F4/80hi MΦ population in the liver and kidney as well as Langerhans cells was decreased during development suggesting a second source for these cell populations. These data support the previous findings that YS‐derived Langerhans cell precursors are potentially replaced by fetal liver‐derived HSCs and therefore present the main source of the adult Langerhans cells (Hoeffel et al, 2012). Our results suggest a similar scenario for adult F4/80hi MΦ in kidney and liver. In contrast, CD11bhi MΦ in liver and kidney were not targeted by our fate‐mapping strategy demonstrating their origin from definitive hematopoiesis. Our data stand in contrast to a recent publication, which claims an exclusive origin of all MΦ from the fetal liver (Sheng et al, 2015). Even though a contribution of bone marrow‐derived HSCs to F4/80hi kidney MΦ was previous suggested (Schulz et al, 2012), the maintenance and turnover of these cells as well as of F4/80hi Kupffer cells and CD11bhi liver MΦ were so far not investigated. Using adult Cx3cr1 CreER:Rosa26‐yfp mice, we could identify a low but constant turnover rate for F4/80hi kidney MΦ in contrast to a high turnover rate for CD11bhi MΦ. To bypass the down‐regulation of CX3CR1 expression in F4/80hi Kupffer cells during postnatal life, we directly targeted these cells after birth. So far, it was only shown indirectly that Kupffer cells have apparently no contribution from blood monocytes using either Ccr2‐deficient (Bain et al, 2014) or parabiotic mice under homeostatic conditions (Epelman et al, 2014). However, a contribution of blood monocytes to F4/80hi Kupffer cells under disease conditions or after depletion was recently suggested (Bleriot et al, 2015; Scott et al, 2016). Our results provide therefore the first direct genetic proof that at least a subpopulation of the Kupffer cells has no turnover from birth until 9 months of age under steady‐state conditions. Recently, Clec4 has been identified as a specific gene for Kupffer cells (Scott et al, 2016) and this might open new possibilities to further study explicitly this cell population in future.
A broad transcriptional analysis of different tissue MΦ populations revealed that MΦ gene expression is strongly dependent on the specific organ environment (Gautier et al, 2012). Moreover, separation of embryonic F4/80hi and CD11bhi tissue MΦ by gene expression pattern was previously suggested (Schulz et al, 2012). In the present study, we additionally performed transcriptional microarray analysis of embryonic and adult F4/80hi and CD11bhi tissue MΦ including microglia and adult Langerhans cells. Despite organ‐specific expression patterns (data not shown), we identified robust similarities of F4/80hi versus CD11bhi MΦ across organs which were present prenatally and in adulthood. Interestingly, only Langerhans cells were transcriptionally separated from both the adult F4/80hi and CD11bhi MΦ indicating that they represent a unique tissue MΦ population. Of note, we defined signature genes for tissue macrophages based on a previous analysis (Lavin et al, 2014) using linear support vector regression implemented in CIBERSORT (Newman et al, 2015) and could demonstrate that microglia and Kupffer cells in our analysis were mainly characterized by the same signature genes (data not shown). This suggests that our sorting strategy was compatible with previous approaches to determine tissue macrophages.
PU.1 has been described as a key regulator of myeloid/macrophage development for a long time, reflected by a complete absence of mature macrophages in Pu.1‐deficient animals (McKercher et al, 1996). In contrast, Irf8 was only described as a transcription factor regulating myeloid and lymphoid maturation (Holtschke et al, 1996; Hambleton et al, 2011). More recently, we described that Irf8 is essential for the maturation of the YS A1‐ to A2‐progenitor populations (Kierdorf et al, 2013; Shiau et al, 2015). The importance of Irf8 for microglia from the early wave of hematopoiesis was also observed in zebrafish (Shiau et al, 2015). Interestingly, in their study, the impact on peripheral MΦ was limited to the embryonic stage, whereas the effect on microglia was long‐lasting. However, the role of Irf8 for other murine tissue MΦ was not studies so far. Therefore, we analyzed if the YS‐derived F4/80hi tissue MΦ are dependent on the transcription factor Irf8 concerning maturation and homeostasis. Surprisingly, we identified a remarkably high expression of Irf8 in both F4/80hi and CD11bhi MΦ and indeed found an impact of Irf8 on cell morphology and/or cell number of all tissue MΦ. Moreover, Irf8 deficiency showed considerable impact on the gene expression profile of F4/80hi and CD11bhi MΦ derived from all organs and both during embryogenesis and adulthood leading to the down‐regulation of genes related to immune function. In summary, we report that F4/80hi tissue MΦ are A2 YS progenitor‐derived, whereas CD11bhi tissue MΦ are exclusively derived from the definitive hematopoiesis independent from A2 precursors. Furthermore, we identified distinct gene profiles of the two tissue MΦ populations. We were, for the first time, able to analyze the turnover rate of tissue MΦ in the liver and kidney and show a low but constant turnover rate of F4/80hi kidney MΦ, a high turnover rate for CD11bhi tissue MΦ, and no turnover of F4/80hi liver MΦ. Moreover, we found that Irf8 is crucial for proper maturation of microglia as well as liver and kidney MΦ.
Materials and Methods
Mice
Cx3cr1 GFP/WT, Cx3cr1 CreER :R26‐yfp (Jung et al, 2000; Yona et al, 2013), Ccr2−/− (Boring et al, 1997), Nr4a1 −/−, Irf8 −/− (Holtschke et al, 1996); Irf8‐VENUS (Schonheit et al, 2013) Ccr2 RFP/WT were described elsewhere. All mice including the corresponding wild‐type controls were bred in‐house and were housed in specific pathogen‐free conditions. Experiments were performed with 6‐ to 10‐week‐old female and male mice, if not stated otherwise. All mouse experiments were performed in accordance with the animal law and guidelines. PAC‐transgenic Irf8‐Venus mice were kindly provided by Frank Rosenbauer (Medical Faculty of the WWU Münster, Germany), Nr4a1 −/− mice by Antigoni Triantafyllopoulou (University Hospital Freiburg, Germany), and Ccr2 RFP/WT mice by Mathias Jucker (German Center for Neurodegenerative Diseases, Tübingen, Germany).
Timed matings
Timed matings were used to analyze embryonic mice. The matings were started in the afternoon and separated after plug check on the following morning. Embryonic development was estimated considering the day of vaginal plug formation as embryonic day (E) 0.5 and staged by developmental criteria. The EMP was isolated at E 8.0, A1 and A2 at E 9.0, embryonic macrophage populations at E 14.5, and adult macrophage populations at postnatal day (P)42.
Tamoxifen induction
Tamoxifen (TAM, Sigma‐Aldrich, Taufkirchen, Germany) was dissolved in corn oil (Sigma‐Aldrich, Taufkirchen, Germany) to get a 20 mg/ml solution for injections. Six‐week‐old Cx3cr1 CreER:Rosa26‐yfp mice were subcutaneously injected with 4 mg TAM on 2 days (day 0 and 2). For Cre induction in the newborn mice, intraperitoneal (i.p.) injection of 0.1 mg TAM was performed at P1. For pulse labeling experiments, plug‐positive Cx3cr1 CreER:Rosa26‐yfp females from timed matings were i.p. injected with 3 mg TAM (20 mg/ml TAM + 10 mg/ml Progesterone; Sigma‐Aldrich, Taufkirchen, Germany) at E 9.0, E 8.0, or E 7.0.
Preparation of tissue samples
Mice were lethally anesthetized with ketamine (100 mg/kg bodyweight, Medistar, Germany) and xylazine (5 mg/kg bodyweight, Bayer, Leverkusen, Germany) followed by the perfusion with 1× PBS through the left heart chamber. For histology, organs were transferred to 4% PFA. For the preparation of single‐cell suspension for flow cytometry, brain, liver, and kidney were cut into small pieces. The tissue of the liver and kidney was transferred to enzymatic solutions (1 mg/ml collagenase D (Roche, Darmstadt, Germany) + 2.4 mg/ml dispase (Roche, Darmstadt, Germany) + 0.2 mg/ml DNase (Sigma‐Aldrich, Taufkirchen, Germany) in 1× PBS for the liver and 1 mg/ml collagenase D in 1× PBS for the kidney) and incubated for 30 min at 37°C on a shaker. Cell suspensions were filtered through a mesh (100 or 70 μm, restrictively). The liver samples were centrifuged at 54 g for 3 min, 4°C. Supernatant was transferred to a new tube. Liver and kidney samples were centrifuged for 5 min 251 g, 4°C. Erythrocytes were removed by RBC lysis buffer (eBioscience, San Diego, USA). Brain tissue was homogenized and filtered through a 70 μm mesh. After centrifugation (10 min 251 g, 4°C), the pellet was resuspended in 70% Percoll (Sigma‐Aldrich, Taufkirchen, Germany) and was underlay to a Percoll density gradient (30 and 37%). Density gradient centrifugation was performed for 30 min, 800 g at 4°C without brake. Microglia were collected from the interphase 70% to 37% Percoll. For skin samples, ears were separated and dermis was put on a 0.2 mg/ml dispase solution o/n 4°C, dermis and epidermis were separated, and the epidermis was cut in small pieces followed by enzymatic (1.5 mg/ml collagenase V, Life technologies, Darmstadt, Germany) digestion for 1.5 h at 37°C. Homogenates were filtered through a 100 μm mesh and centrifuged (251 g, 5 min, 4°C). Cell suspensions from isolated YS were obtained by mechanical homogenization, using passage through 22–25 gauge needles as described before (Bertrand et al, 2005).
Flow cytometry
Cells were acquired on FACSCanto II and LSRFortessa systems (BD Bioscience, Heidelberg, Germany) and analyzed with Flowjo software (TreeStar). Cell sorting was performed on a MoFlo Astrios (Beckman Coulter, Krefeld, Germany). The following antibodies were used for staining cells: anti‐CD45 (clone 30‐F11, eBioscience, San Diego, USA), anti‐CD11b (clone M1/70, eBioscience, San Diego, USA), anti‐CD146 (clone ME‐9F1, Biolegend, Fell, Germany), anti‐CD3 (clone eBio500A2, eBioscience, San Diego, USA), anti‐CD19 (clone eBio1D3, eBioscience, San Diego, USA), anti‐NK1.1 (clone PK136, eBioscience, San Diego, USA), anti‐Gr1 (clone RB6‐8C5, Biolegend, Fell, Germany), anti‐F4/80 (clone BM8, eBioscience), anti‐MHCII (clone M5/114.15.2, eBioscience, San Diego, USA), anti‐EpCAM (clone G8.8, BD Bioscience, Heidelberg, Germany), and anti‐Ly6C (clone AL 21, BD Bioscience, Heidelberg, Germany). Before surface staining, dead cells were stained using the Fixable Viability Dye eFluor® 780 or eFluor® 506 (eBioscience, San Diego, USA) followed by incubation with Fc receptor blocking antibody CD16/CD32 (clone 2.4G2, BD Bioscience, Heidelberg, Germany).
The turnover rate per week was calculated as following: For CD11bhi MΦ, the difference of YFP+ CD11bhi MΦ at 6 days to YFP+ CD11bhi MΦ at 4 weeks was defined. This value was calculated per week and then given as % of YFP+ CD11bhi MΦ at 6 days. The same calculation was done for kidney F4/80hi MΦ using the 2‐week and 35‐week time point.
Histology
For whole embryo imaging, E9.0 Cx3Cr1 GFP/+ embryos were fixed for 10 min in 4% paraformaldehyde and processed for whole‐mount immunolabeling, using F4/80‐APC (Clone BM8, eBioscience, San Diego, USA) or c‐kit‐APC (Clone 2B8, eBioscience, San Diego, USA), CD41‐AF647 (Clone eBioMWReg30, Molecular Probes, Eugen, Oregon, USA), and CD31‐PE (Clone Mec13.3, BioLegend, Fell, Germany) antibodies, as previously described (Bertrand et al, 2005). Whole embryos or isolated YS were placed in the central well of glass bottom culture dishes (P35G‐1.5‐10‐C, from MatTek, USA) filled with PBS + 10% fetal calf serum. After appropriate orientation of the sample, the well was covered with a 12‐mm coverslip glass. Image stacks were collected using a Leica SP8 confocal microscope. Images were processed using Fiji and PHOTOSHOP 8.0 (Adobe Systems, San Jose, CA) software.
For immunofluorescence staining with cryosections, tissues were fixed overnight at 4°C, dehydrated in 30% sucrose solution, and embedded in Tissue‐Tek® O.C.T.TM Compound (Sakura Finetek Europ B.V., Netherlands); 12‐ or 30‐μm parasagittal sections were cut on a cryotome and mounted onto microscope slides (Langenbrinck, Emmendingen, Germany) for staining. The organ slices were fixed in acetone for 20 min at −20°C and rehydrated in PBS. Blocking was performed with 5% BSA, 0.1% Triton X‐100 in PBS for 1 h. The 12‐μm sections were incubated with the primary antibodies anti‐GFP (1:1,000, Cat. No. 600‐101‐215S, Rockland, Limerick, USA) and anti‐Iba1 (1:500, Cat. No. 019‐19741, Wako, Osaka, Japan) in 1% BSA in PBS at 4°C overnight, whereas 30‐μm sections were incubated with anti‐F4/80 (1:200, Cat. No. MCA‐497, Serotec, Düsseldorf, Germany) or anti‐Iba1 for two nights followed by the incubation with the secondary antibodies (Alexa Fluor 555, Alexa Fluor 647 or Alexa Fluor 488, 1:500, Life technologies, Darmstadt, Germany) in 1% BSA in PBS for 1 h at RT in the dark. Nuclei were counterstained with 4,6‐diamidino‐2‐phenylindole (DAPI, 1:10,000, Cat. No. 236276, Boehringer, Mannheim, Germany) for 10–15 min, and the slides were mounted using Mowiol (Merck Millipore, Darmstadt, Germany). Representative pictures were taken with BZ‐9000 Biorevo microscope (Keyence, Neu‐Isenburg, Germany).
Imaris reconstruction
3D reconstruction of tissue macrophages was done using the IMARIS software (Bitplane, Zürich, Switzerland) as described previously (Erny et al, 2015). In brief, F4/80 or Iba‐1 immunostained 30‐μm cryosections from adult brain, liver, and kidney were used. Imaging was performed on an Olympus Fluoview 1000 confocal laser scanning microscope (Olympus, Hamburg, Germany) using a 20 × 0.95 NA objective. Z stacks were done with 3× zoom in 1.14 μm steps in z direction; 1,024 × 1,024 pixel resolution was recorded and analyzed using IMARIS software (Bitplane, Zürich, Switzerland). At least six F4/80+GFP+ cells were reconstructed per analyzed mouse using the surface plug‐in on the GFP or F4/80 signal.
Microarray analysis
FACS‐sorted MΦ populations were directly collected in cell lysis buffer, and subsequently, RNA was isolated with the Arcturus Pico Pure RNA Isolation Kit (Life technologies, Darmstadt, Germany) according to the manufacturer's protocol. Transcriptional profiles of the MΦ populations were assessed using Affymetrix® (Affymetrix, Santa Clara, USA) GeneChip Arrays (Mouse Gene 2.1 ST Arrays). Affymetrix® GeneChip array data were pre‐processed using Affymetrix® Expression Console and normalized through the Robust Multi‐array Average (RMA) implementation in the Expression Console. Sample processing and Affymetrix microarray hybridization were carried out at a genomics core facility: Center of Excellence for Fluorescent Bioanalytics (KFB, University of Regensburg, Germany).
Pre‐processing of gene expression data
The Robust Multi‐array Average (RMA) function was used to normalize the data during import of the raw Affymetrix data (CEL files) of a total of 81 samples into Partek Genomics Suite (PGS). The background value was defined as the median of the entire normalized dataset using all probes. Gene probes were only kept for further analysis if their mean expression values were higher than the background in at least one group or condition within the whole dataset. Next, multiple probes for one gene locus were filtered allowing only one probe with the highest overall mean expression. These pre‐processing steps resulted in 17,888 unique genes to be present in at least one group or condition. These genes were retained for further analyses.
Identification of differentially expressed genes and hierarchical clustering
Differentially expressed (DE) genes were defined in PGS by analysis of variance (ANOVA) models by setting certain fold change (FC) thresholds and false discovery rate [FDR, (Hochberg & Benjamini, 1990)] adjusted P‐value cutoffs to determine differences between two comparable groups, for example, cells derived from Irf8 −/− versus Irf8 +/+ mice. The respective cutoffs used for a particular comparison are described in the result section. For comparison of DE genes between different pairs of cell populations, we applied Venn diagrams. When comparing all cell populations between Irf8−/− versus Irf8+/+ mice, the absolute numbers of up‐ and down‐regulated genes from each cell population were normalized to the number of present genes and then visualized as bar plots. The most variable genes were determined in ANOVA models to compare the variations throughout groups by t‐test, that is, genes with most significant P‐values. Hierarchical clustering using the Euclidean distance on both genes and samples was performed and used for visualization of DE genes between or most variable genes of particular cell populations.
Visualization of differentially expressed genes related to macrophage function
The differentially expressed genes comparing F4/80hi against CD11bhi in adult (755 DE genes) and embryo (1,010 DE genes) were filtered by a list of known murine cytokines (233 cytokines), by a list of antigen capturing molecules (34 molecules [Scavenger receptors in homeostasis and immunity] [Myeloid C‐type Lectin Receptors in Pathogen Recognition and Host Defense]), by a list of proteolytic enzymes (754 enzymes [Twenty years of the MEROPS database of proteolytic enzymes, their substrates and inhibitors. Nucleic Acids Res 44, D343‐D350]), by a list of surface markers (3,705 marker), by a list of transcription factors (929 factors [The TRANSFAC project as an example of framework technology that supports the analysis of genomic regulation]), and by a list of secreted molecules (1,139 molecules). Only the top 10 genes among the differentially expressed molecules from the above mentioned categories were visualized in a heat map using Mayday–Integrative Analytics for Expression Data (Battke et al, 2010). The top 10 genes were selected by the highest FC comparing F4/80hi against CD11bhi in adult and embryo for each category, respectively.
Co‐regulation analysis by BioLayout Express3D
BioLayout Express3D (BioLayout) is a powerful tool for the visualization and analysis of network graphs based on co‐expression (Theocharidis et al, 2009). BioLayout was applied to discriminate different cell populations during embryonic MΦ development. Sample–sample correlation was calculated and transformed into 3D coordinates. A Pearson's correlation coefficient cutoff of 0.92 was used to keep stronger connections (higher correlation) between samples, and subsequently, the co‐regulation network was constructed and visualized in 3D space.
Gene Ontology (GO) enrichment analysis and GO network visualization. To link the data to prior knowledge, GO enrichment analysis was applied by using the Cytoscape plug‐in BiNGO (v2.44) (Maere et al, 2005). To include only significant results, the FDR q‐value threshold was set to 0.05 as default. The Cytoscape plugins Enrichment Map (v1.1) (Merico et al, 2010) and Word Cloud (Oesper et al, 2011) were used to visualize the GO networks. To decrease the size of the networks and to define certain cutoffs for the similarity of GO terms, the default settings of Jaccard coefficients (0.25) and their FDR q‐values (0.1) were utilized.
PCR array
For quantitative gene expression analysis, the RNA of FACS‐sorted MΦ population was isolated as described above. Reverse transcription was performed using the RT2 PreAMP cDNA Synthesis Kit (Qiagen, Germantown, USA) with a custom‐made Primer‐Mix according to manufacturer's instructions. RT–PCR was performed using a custom‐made SABioscience PCR‐Array (Qiagen, Germantown, USA) with the genes of interest and analyzed with a LightCycler 480 (Roche, Darmstadt, Germany). Beta‐Actin and GAPDH were used as housekeeping genes. Analysis was performed using the online data analysis center from Qiagen.
Serum protein quantifications
Serum ALT was analyzed from whole blood using ALT strips from Roche according to the manufacturer's instructions. Measurement was performed in a Reflovet machine from SCIL animal care. Values above assay range were diluted prior to measurement. Serum creatinine was measured using an enzymatic colorimetric (ELISA) creatinine kit (Lehmann) following the manufacturer's instructions.
Bacterial load
Liver lobes from adult Irf8 −/− and Irf8 +/+ were dissected and weighted before bacterial DNA was isolated from the livers as described before (Wilson & Grenfell, 1997). Quantitative PCR for 16sRNA gene was performed and normalized to the weight of the isolated tissue.
Statistical analysis
Statistical analysis was performed using GraphPad Prism (GraphPad Software, Version 6.0, La Jolla, USA). All data were tested for normality applying the F‐test to compare variance. If normality was given, an unpaired t‐test, two‐sided was applied. If the data did not meet the criteria of normality, the Mann–Whitney U‐test, two‐sided was applied. Differences were considered significant when P‐value < 0.05.
GEO accession numbers
The main GEO accession number for microarray: GSE73125.
Author contributions
NH, KK, ZA, MR, and KF conducted the experiments. JX, TU, and JLS analyzed the microarray data. IG performed immunofluorescence analysis of the YS and embryo at E 9.0. PW, MJCJ and GY performed the 3D reconstruction of Irf8−/− and Irf8+/+ microglia and liver macrophages and the quantification thereof. FR provided Irf8‐VENUS mice; MH and PAK designed experiments. JLS supported writing the manuscript. MP and NH supervised the project and wrote the manuscript.
Conflict of interest
The authors declare that they have no conflict of interest.
Supporting information
Expanded View Figures PDF
Table EV1
Review Process File
Acknowledgements
We thank Maria Oberle and Fleur Feder for excellent technical assistance, Ori Staszewski for statistical advice, Antigoni Triantafyllopoulou for providing Nr4a1 −/− mice, Mathias Jucker for providing Ccr2 RFP/WT mice, and Stefanie M. Brendecke for critically reading and editing the manuscript. MP was supported by the BMBF‐funded competence network of multiple sclerosis (KKNMS), the Sobek Foundation, the DFG (SFB 992, SFB 1160, FOR1336, PR 577/8‐1), the Fritz‐Thyssen Foundation, the Gemeinnützige Hertie Foundation (GHST) and the SFB(CRC)/TRR 167. JLS is a member of the Excellence Cluster ImmunoSensation, and he was supported by the DFG (SFB 645, SFB 704).
The EMBO Journal (2016) 35: 1730–1744
References
- Ajami B, Bennett JL, Krieger C, Tetzlaff W, Rossi FM (2007) Local self‐renewal can sustain CNS microglia maintenance and function throughout adult life. Nat Neurosci 10: 1538–1543 [DOI] [PubMed] [Google Scholar]
- Bain CC, Bravo‐Blas A, Scott CL, Gomez PE, Geissmann F, Henri S, Malissen B, Osborne LC, Artis D, Mowat AM (2014) Constant replenishment from circulating monocytes maintains the macrophage pool in the intestine of adult mice. Nat Immunol 15: 929–937 [DOI] [PMC free article] [PubMed] [Google Scholar]
- Battke F, Symons S, Nieselt K (2010) Mayday ‐ integrative analytics for expression data. BMC Bioinformatics 11: 121 [DOI] [PMC free article] [PubMed] [Google Scholar]
- Bertrand JY, Jalil A, Klaine M, Jung S, Cumano A, Godin I (2005) Three pathways to mature macrophages in the early mouse yolk sac. Blood 106: 3004–3011 [DOI] [PubMed] [Google Scholar]
- Bleriot C, Dupuis T, Jouvion G, Eberl G, Disson O, Lecuit M (2015) Liver‐resident macrophage necroptosis orchestrates type 1 microbicidal inflammation and type‐2‐mediated tissue repair during bacterial infection. Immunity 42: 145–158 [DOI] [PubMed] [Google Scholar]
- Boring L, Gosling J, Chensue SW, Kunkel SL, Farese RV Jr, Broxmeyer HE, Charo IF (1997) Impaired monocyte migration and reduced type 1 (Th1) cytokine responses in C‐C chemokine receptor 2 knockout mice. J Clin Invest 100: 2552–2561 [DOI] [PMC free article] [PubMed] [Google Scholar]
- Cumano A, Godin I (2007) Ontogeny of the hematopoietic system. Annu Rev Immunol 25: 745–785 [DOI] [PubMed] [Google Scholar]
- Epelman S, Lavine KJ, Randolph GJ (2014) Origin and functions of tissue macrophages. Immunity 41: 21–35 [DOI] [PMC free article] [PubMed] [Google Scholar]
- Erny D, Hrabe de Angelis AL, Jaitin D, Wieghofer P, Staszewski O, David E, Keren‐Shaul H, Mahlakoiv T, Jakobshagen K, Buch T, Schwierzeck V, Utermohlen O, Chun E, Garrett WS, McCoy KD, Diefenbach A, Staeheli P, Stecher B, Amit I, Prinz M (2015) Host microbiota constantly control maturation and function of microglia in the CNS. Nat Neurosci 18: 965–977 [DOI] [PMC free article] [PubMed] [Google Scholar]
- van Furth R, Cohn ZA (1968) The origin and kinetics of mononuclear phagocytes. J Exp Med, 128: 415–435. [DOI] [PMC free article] [PubMed] [Google Scholar]
- Gautier EL, Shay T, Miller J, Greter M, Jakubzick C, Ivanov S, Helft J, Chow A, Elpek KG, Gordonov S, Mazloom AR, Ma'ayan A, Chua WJ, Hansen TH, Turley SJ, Merad M, Randolph GJ (2012) Gene‐expression profiles and transcriptional regulatory pathways that underlie the identity and diversity of mouse tissue macrophages. Nat Immunol, 13: 1118–1128. [DOI] [PMC free article] [PubMed] [Google Scholar]
- Ginhoux F, Greter M, Leboeuf M, Nandi S, See P, Gokhan S, Mehler MF, Conway SJ, Ng LG, Stanley ER, Samokhvalov IM, Merad M (2010) Fate mapping analysis reveals that adult microglia derive from primitive macrophages. Science 330: 841–845 [DOI] [PMC free article] [PubMed] [Google Scholar]
- Ginhoux F, Jung S (2014) Monocytes and macrophages: developmental pathways and tissue homeostasis. Nat Rev Immunol 14: 392–404 [DOI] [PubMed] [Google Scholar]
- Goldmann T, Wieghofer P, Muller PF, Wolf Y, Varol D, Yona S, Brendecke SM, Kierdorf K, Staszewski O, Datta M, Luedde T, Heikenwalder M, Jung S, Prinz M (2013) A new type of microglia gene targeting shows TAK1 to be pivotal in CNS autoimmune inflammation. Nat Neurosci 16: 1618–1626 [DOI] [PubMed] [Google Scholar]
- Gomez PE, Klapproth K, Schulz C, Busch K, Azzoni E, Crozet L, Garner H, Trouillet C, de Bruijn MF, Geissmann F, Rodewald HR (2015) Tissue‐resident macrophages originate from yolk‐sac‐derived erythro‐myeloid progenitors. Nature 518: 547–551 [DOI] [PMC free article] [PubMed] [Google Scholar]
- Gosselin D, Link VM, Romanoski CE, Fonseca GJ, Eichenfield DZ, Spann NJ, Stender JD, Chun HB, Garner H, Geissmann F, Glass CK (2014) Environment drives selection and function of enhancers controlling tissue‐specific macrophage identities. Cell 159: 1327–1340 [DOI] [PMC free article] [PubMed] [Google Scholar]
- Hambleton S, Salem S, Bustamante J, Bigley V, Boisson‐Dupuis S, Azevedo J, Fortin A, Haniffa M, Ceron‐Gutierrez L, Bacon CM, Menon G, Trouillet C, McDonald D, Carey P, Ginhoux F, Alsina L, Zumwalt TJ, Kong XF, Kumararatne D, Butler K et al (2011) IRF8 mutations and human dendritic‐cell immunodeficiency. N Engl J Med 365: 127–138 [DOI] [PMC free article] [PubMed] [Google Scholar]
- Hashimoto D, Chow A, Noizat C, Teo P, Beasley MB, Leboeuf M, Becker CD, See P, Price J, Lucas D, Greter M, Mortha A, Boyer SW, Forsberg EC, Tanaka M, van Rooijen N, Garcia‐Sastre A, Stanley ER, Ginhoux F, Frenette PS et al (2013) Tissue‐resident macrophages self‐maintain locally throughout adult life with minimal contribution from circulating monocytes. Immunity 38: 792–804 [DOI] [PMC free article] [PubMed] [Google Scholar]
- Hochberg Y, Benjamini Y (1990) More powerful procedures for multiple significance testing. Stat Med 9: 811–818 [DOI] [PubMed] [Google Scholar]
- Hoeffel G, Wang Y, Greter M, See P, Teo P, Malleret B, Leboeuf M, Low D, Oller G, Almeida F, Choy SH, Grisotto M, Renia L, Conway SJ, Stanley ER, Chan JK, Ng LG, Samokhvalov IM, Merad M, Ginhoux F (2012) Adult Langerhans cells derive predominantly from embryonic fetal liver monocytes with a minor contribution of yolk sac‐derived macrophages. J Exp Med 209: 1167–1181 [DOI] [PMC free article] [PubMed] [Google Scholar]
- Hoeffel G, Chen J, Lavin Y, Low D, Almeida FF, See P, Beaudin AE, Lum J, Low I, Forsberg EC, Poidinger M, Zolezzi F, Larbi A, Ng LG, Chan JK, Greter M, Becher B, Samokhvalov IM, Merad M, Ginhoux F (2015) C‐Myb(+) erythro‐myeloid progenitor‐derived fetal monocytes give rise to adult tissue‐resident macrophages. Immunity 42: 665–678 [DOI] [PMC free article] [PubMed] [Google Scholar]
- Holtschke T, Lohler J, Kanno Y, Fehr T, Giese N, Rosenbauer F, Lou J, Knobeloch KP, Gabriele L, Waring JF, Bachmann MF, Zinkernagel RM, Morse HC III, Ozato K, Horak I (1996) Immunodeficiency and chronic myelogenous leukemia‐like syndrome in mice with a targeted mutation of the ICSBP gene. Cell 87: 307–317 [DOI] [PubMed] [Google Scholar]
- Huang LR, Wohlleber D, Reisinger F, Jenne CN, Cheng RL, Abdullah Z, Schildberg FA, Odenthal M, Dienes HP, Van RN, Schmitt E, Garbi N, Croft M, Kurts C, Kubes P, Protzer U, Heikenwalder M, Knolle PA (2013) Intrahepatic myeloid‐cell aggregates enable local proliferation of CD8(+) T cells and successful immunotherapy against chronic viral liver infection. Nat Immunol 14: 574–583 [DOI] [PubMed] [Google Scholar]
- Jung S, Aliberti J, Graemmel P, Sunshine MJ, Kreutzberg GW, Sher A, Littman DR (2000) Analysis of fractalkine receptor CX(3)CR1 function by targeted deletion and green fluorescent protein reporter gene insertion. Mol Cell Biol 20: 4106–4114 [DOI] [PMC free article] [PubMed] [Google Scholar]
- Kierdorf K, Erny D, Goldmann T, Sander V, Schulz C, Perdiguero EG, Wieghofer P, Heinrich A, Riemke P, Holscher C, Muller DN, Luckow B, Brocker T, Debowski K, Fritz G, Opdenakker G, Diefenbach A, Biber K, Heikenwalder M, Geissmann F et al (2013) Microglia emerge from erythromyeloid precursors via Pu.1‐ and Irf8‐dependent pathways. Nat Neurosci 16: 273–280 [DOI] [PubMed] [Google Scholar]
- Lavin Y, Winter D, Blecher‐Gonen R, David E, Keren‐Shaul H, Merad M, Jung S, Amit I (2014) Tissue‐resident macrophage enhancer landscapes are shaped by the local microenvironment. Cell 159: 1312–1326 [DOI] [PMC free article] [PubMed] [Google Scholar]
- Maere S, Heymans K, Kuiper M (2005) BiNGO: a Cytoscape plugin to assess overrepresentation of gene ontology categories in biological networks. Bioinformatics 21: 3448–3449 [DOI] [PubMed] [Google Scholar]
- McKercher SR, Torbett BE, Anderson KL, Henkel GW, Vestal DJ, Baribault H, Klemsz M, Feeney AJ, Wu GE, Paige CJ, Maki RA (1996) Targeted disruption of the PU.1 gene results in multiple hematopoietic abnormalities. EMBO J 15: 5647–5658 [PMC free article] [PubMed] [Google Scholar]
- Merico D, Isserlin R, Stueker O, Emili A, Bader GD (2010) Enrichment map: a network‐based method for gene‐set enrichment visualization and interpretation. PLoS One 5: e13984 [DOI] [PMC free article] [PubMed] [Google Scholar]
- Mildner A, Schmidt H, Nitsche M, Merkler D, Hanisch UK, Mack M, Heikenwalder M, Bruck W, Priller J, Prinz M (2007) Microglia in the adult brain arise from Ly‐6C(hi)CCR2(+) monocytes only under defined host conditions. Nat Neurosci 10: 1544–1553 [DOI] [PubMed] [Google Scholar]
- Molawi K, Wolf Y, Kandalla PK, Favret J, Hagemeyer N, Frenzel K, Pinto AR, Klapproth K, Henri S, Malissen B, Rodewald HR, Rosenthal NA, Bajenoff M, Prinz M, Jung S, Sieweke MH (2014) Progressive replacement of embryo‐derived cardiac macrophages with age. J Exp Med 211: 2151–2158 [DOI] [PMC free article] [PubMed] [Google Scholar]
- Newman AM, Liu CL, Green MR, Gentles AJ, Feng W, Xu Y, Hoang CD, Diehn M, Alizadeh AA (2015) Robust enumeration of cell subsets from tissue expression profiles. Nat Methods 12: 453–457 [DOI] [PMC free article] [PubMed] [Google Scholar]
- Oesper L, Merico D, Isserlin R, Bader GD (2011) WordCloud: a Cytoscape plugin to create a visual semantic summary of networks. Source Code Biol Med 6: 7 [DOI] [PMC free article] [PubMed] [Google Scholar]
- Prinz M, Priller J (2014) Microglia and brain macrophages in the molecular age: from origin to neuropsychiatric disease. Nat Rev Neurosci 15: 300–312 [DOI] [PubMed] [Google Scholar]
- Rosenbauer F, Tenen DG (2007) Transcription factors in myeloid development: balancing differentiation with transformation. Nat Rev Immunol 7: 105–117 [DOI] [PubMed] [Google Scholar]
- Schonheit J, Kuhl C, Gebhardt ML, Klett FF, Riemke P, Scheller M, Huang G, Naumann R, Leutz A, Stocking C, Priller J, Andrade‐Navarro MA, Rosenbauer F (2013) PU.1 level‐directed chromatin structure remodeling at the irf8 gene drives dendritic cell commitment. Cell Rep 3: 1617–1628 [DOI] [PubMed] [Google Scholar]
- Schulz C, Gomez PE, Chorro L, Szabo‐Rogers H, Cagnard N, Kierdorf K, Prinz M, Wu B, Jacobsen SE, Pollard JW, Frampton J, Liu KJ, Geissmann F (2012) A lineage of myeloid cells independent of Myb and hematopoietic stem cells. Science 336: 86–90 [DOI] [PubMed] [Google Scholar]
- Scott CL, Zheng F, De BP, Martens L, Saeys Y, De PS, Lippens S, Abels C, Schoonooghe S, Raes G, Devoogdt N, Lambrecht BN, Beschin A, Guilliams M (2016) Bone marrow‐derived monocytes give rise to self‐renewing and fully differentiated Kupffer cells. Nat Commun 7: 10321 [DOI] [PMC free article] [PubMed] [Google Scholar]
- Sheng J, Ruedl C, Karjalainen K (2015) Most tissue‐resident macrophages except microglia are derived from fetal hematopoietic stem cells. Immunity 43: 382–393 [DOI] [PubMed] [Google Scholar]
- Shiau CE, Kaufman Z, Meireles AM, Talbot WS (2015) Differential requirement for irf8 in formation of embryonic and adult macrophages in zebrafish. PLoS One 10: e0117513 [DOI] [PMC free article] [PubMed] [Google Scholar]
- Sieweke MH, Allen JE (2013) Beyond stem cells: self‐renewal of differentiated macrophages. Science 342: 1242974 [DOI] [PubMed] [Google Scholar]
- Tamura T, Ozato K (2002) ICSBP/IRF‐8: its regulatory roles in the development of myeloid cells. J Interferon Cytokine Res 22: 145–152 [DOI] [PubMed] [Google Scholar]
- Tamura T, Yanai H, Savitsky D, Taniguchi T (2008) The IRF family transcription factors in immunity and oncogenesis. Annu Rev Immunol 26: 535–584 [DOI] [PubMed] [Google Scholar]
- Theocharidis A, van Dongen S, Enright AJ, Freeman TC (2009) Network visualization and analysis of gene expression data using BioLayout Express(3D). Nat Protoc, 4: 1535–1550. [DOI] [PubMed] [Google Scholar]
- Wilson K, Grenfell BT (1997) Generalized linear modelling for parasitologists. Parasitol Today 13: 33–38 [DOI] [PubMed] [Google Scholar]
- Yona S, Kim KW, Wolf Y, Mildner A, Varol D, Breker M, Strauss‐Ayali D, Viukov S, Guilliams M, Misharin A, Hume DA, Perlman H, Malissen B, Zelzer E, Jung S (2013) Fate mapping reveals origins and dynamics of monocytes and tissue macrophages under homeostasis. Immunity 38: 79–91 [DOI] [PMC free article] [PubMed] [Google Scholar]
Associated Data
This section collects any data citations, data availability statements, or supplementary materials included in this article.
Supplementary Materials
Expanded View Figures PDF
Table EV1
Review Process File