

Abstract
Membrane fusion is essential for eukaryotic life, requiring SNARE proteins to zipper up in an α‐helical bundle to pull two membranes together. Here, we show that vesicle fusion can be suppressed by phosphorylation of core conserved residues inside the SNARE domain. We took a proteomics approach using a PKCB knockout mast cell model and found that the key mast cell secretory protein VAMP8 becomes phosphorylated by PKC at multiple residues in the SNARE domain. Our data suggest that VAMP8 phosphorylation reduces vesicle fusion in vitro and suppresses secretion in living cells, allowing vesicles to dock but preventing fusion with the plasma membrane. Markedly, we show that the phosphorylation motif is absent in all eukaryotic neuronal VAMPs, but present in all other VAMPs. Thus, phosphorylation of SNARE domains is a general mechanism to restrict how much cells secrete, opening the door for new therapeutic strategies for suppression of secretion.
Keywords: mast cell degranulation, protein kinase C, secretion, SNARE complex, VAMP8
Subject Categories: Membrane & Intracellular Transport
Introduction
Animal cells maintain tissue function by secreting regulatory factors to signal their activity and nutrient status, pathogen infections, or injury. These regulated vesicle fusion events are typically much slower than the Ca2+‐triggered release of synaptic vesicles (Wickner & Schekman, 2008; Südhof & Rothman, 2009; Jahn & Fasshauer, 2012; Wollman & Meyer, 2012; Südhof, 2013) and require in addition to SNARE proteins signaling regulators such as protein kinase C (PKC) (Oancea & Meyer, 1998; Nechushtan et al, 2000; Newton, 2010). Despite decades of investigation, the role of PKC in vesicle secretion remains incompletely resolved (Nishizuka, 1986; Leitges et al, 1996; Kalesnikoff & Galli, 2008; Lorentz et al, 2012), but may involve incoherent feed‐forward regulation (Mangan & Alon, 2003) as PKC is known to both activate (Nechushtan et al, 2000; Newton, 2010) and suppress (McHugh et al, 2000; Leitges et al, 2002; Bousquet et al, 2010) numerous cell responses. Incoherent feed‐forward circuits are formed when a single signaling protein induces two opposing pathways that activate and inhibit the same cell response (Mangan & Alon, 2003). This ubiquitous circuit motif allows cells to shape the time course of functional outputs (Kim et al, 2008; Ma et al, 2009).
SNAREs are key components of the protein complexes that drive membrane fusion. While many SNARE‐associated proteins are known to influence vesicle fusion (Jahn & Fasshauer, 2012), less is known about posttranslational regulation of SNARE proteins in general and in particular about phosphorylation of SNARE domains which form α‐helices in the SNARE complex (Sutton et al, 1998). One phosphorylation site in the SNARE domain of SNAP25, S187, has been widely studied (Shimazaki et al, 1996). Phosphorylation of S187 increases secretion (Shu et al, 2008) and the crystal structure of the SNARE complex reveals that S187 forms part of the outside surface area of the α‐helical bundle (Fasshauer et al, 1998; Sutton et al, 1998; Nagy et al, 2002). Additional SNARE domain phosphorylation sites have been reported: SNAP23 (S23, T24, and S160) (Polgár et al, 2003) and VAMP2 (T35 and S61) (Hirling & Scheller, 1996; Li et al, 2009), but their involvement in secretion has not been well defined.
Here, we discovered that phosphorylation by PKCB of residues within the SNARE domain of VAMP8 suppresses mast cell secretion. A phosphomimetic VAMP8 mutant reduces the kinetics of SNARE‐mediated vesicle fusion in vitro. The phosphorylation sites identified in VAMP8 forms part of the interaction surface facing the inside of the helical bundle of the SNARE complex, suggesting that this particular phosphorylation interferes with SNARE complex formation. Furthermore, we demonstrate that PKCB is both promoting and inhibiting secretion, thus forming an incoherent feed‐forward loop, where phosphorylation of VAMP8 constitutes the negative arm that limits secretion by preventing vesicle fusion.
Results
Systematic identification of secretion‐related phosphorylation targets of PKCB
We employed a proteomics approach to identify PKCB substrates that may control the induction and inhibition of secretion as part of an incoherent feed‐forward regulation. We used tumor mast cells (rat basophilic leukemia cells, RBL‐2H3; Kalesnikoff & Galli, 2008; Wollman & Meyer, 2012) which secrete only part (~30%) of their stored inflammatory agents in response to maximal antigen stimulation (Fig 1A), consistent with the existence of inhibitory pathways that prevent the release of the remaining vesicles. Since previous studies proposed that PKCB is the main PKC isoform regulating mast cell secretion (Nechushtan et al, 2000), we confirmed that inhibition of PKCB with ruboxistaurin (Ishii et al, 1996; Tsai et al, 2014) further reduces the amount of released vesicles in a dose‐dependent manner following stimulation with antigen (Fig 1A) or simultaneous addition of the PKC activators phorbol ester and Ca2+ ionophore (Fig EV1A).
Figure 1. Systematic identification of secretion‐related phosphorylation targets of PKCB.

- IgE‐induced β‐hexosaminidase release. Maximal antigen stimulation releases only part of the vesicle pool and is inhibited dose dependently by PKCB inhibitor, ruboxistaurin (n = 9). Values are mean ± SEM.
- PKCB knockout in RBL‐2H3 cells, achieved with genome editing using TALENs. Western blot validating complete loss of PKCB protein expression.
- IgE‐induced β‐hexosaminidase release was inhibited in PKCB knockout cells and was rescued with stable overexpression of either PKCB1 or PKCB2 (n = 24). Wild‐type RBL cells in pink and PKCB knockout cells in blue. Values are mean ± SEM; ***P < 0.001, Kruskal‐Wallis test with Dunn's multiple comparisons test.
- Phosphoproteomics analysis of PKCB targets during mast cell secretion. Intensity for each phosphopeptide compared between biological replicas of wild‐type cells challenged with antigen.
- Schematic of how candidate phosphorylation sites were narrowed down to 179 secretion‐connected phosphopeptides.
- Mean intensity for each phosphopeptide with WT compared to PKCB inhibitor versus WT compared to PKCB knockout cells. Dashed line represents threshold for twofold change of intensity. The hits (179 phosphopeptides) are highlighted in blue and the 4 phosphopeptides from VAMP8 are highlighted in red: T53 (above both thresholds), T47 (above one threshold), S54 (below both thresholds), and S17 (below both thresholds and site not perfectly conserved in mammals).
- VAMP8 immunocytochemistry imaged with a spinning disk confocal microscope. VAMP8 localized to vesicles in resting cells and expression was reduced after VAMP8 siRNA knockdown. VAMP8 translocated to the plasma membrane following antigen stimulation (4 min) (n = 3, > 50 cells per condition). Scale bar, 10 μm.
Figure EV1. PKCB and PKCA regulate mast cell secretion.

- β‐hexosaminidase release in wild‐type RBL cells induced by PDBu (100 nM) and ionomycin (100 nM). Dose‐dependent inhibition of secretion with PKCB inhibitor, ruboxistaurin (n = 10). Values are mean ± SEM.
- PKCB knockout in RBL‐2H3 cells, achieved with genome editing using TALENs. Genomic DNA sequences targeted by TALENs had deletions in all three alleles (three copies of chromosome 1; the 2‐nt and 5‐nt deletions cause a frameshift, and the 54‐nt deletion is across an exon/intron boundary).
- IgE‐induced β‐hexosaminidase release in RBL cells. Wild‐type cells (in pink) compared to PKCB knockout cells (in blue). siRNA knockdown of PKCA in PKCB knockout cells further reduced secretion in PKCB knockout cells (n = 10). Values are mean ± SEM; *P < 0.05, ***P < 0.001.
- Representative single‐cell Ca2+ recordings in wild‐type RBL cells stimulated with antigen (n = 3).
- Single‐cell Ca2+ recordings in PKCB knockout cells stimulated with antigen (n = 3).
We generated a PKCB knockout RBL cell line using genome editing with TALENs by targeting the first exon of PKCB and deleting the three PKCB copies present in RBL cells (Fig EV1B). The double‐strand cuts resulted in repair by non‐homologous end joining leading to deletions in all three alleles as demonstrated by sequencing of genomic DNA (Fig EV1B). Western blot analysis confirmed that PKCB protein expression was abolished (Fig 1B). These knockout cells showed a ~50% reduction in secretion compared to the wild‐type cells, a reduction that could be rescued by stable overexpression of either one of the two PKCB splice variants, PKCB1 or PKCB2 (Fig 1C). The remaining secretory activity in the PKCB knockout cells could be further reduced by knockdown of the PKCB homolog PKCA (Fig EV1C), suggesting that other PKC genes may contribute to the remaining secretion response. Additional control experiments showed that antigen‐triggered Ca2+ increases were the same in wild‐type and PKCB knockout RBL cells (Fig EV1D and E). We employed phosphoproteomics to gain a comprehensive understanding of which of the many known inducers and suppressors of secretion might be regulated by PKCB. Specifically, we compared phosphopeptides derived from stimulated wild‐type cells to phosphopeptides derived from either PKCB knockout cells or wild‐type cells treated with a PKCB blocker (10 μM ruboxistaurin) (Fig EV2A). The list of 17,700 phosphopeptides that could be reproducibly identified between biological replicates (Figs 1D and EV2A and B) was pruned to 179 by selecting only peptides containing evolutionarily conserved phosphorylation sites (Zhao et al, 2012), that in addition were known or proposed secretion regulators (Materials and Methods) (Fig 1E), and that were also at least twofold more abundant in control cells compared to PKCB knockout cells or cells treated with PKCB inhibitor (Fig 1F and Appendix Table S1).
Figure EV2. Proteomics: identification of secretion‐related phosphorylation targets of PKCB.

- Schematic of three different conditions of cell stimulation for the phosphoproteomics experiments.
- Number of mass spectrometry runs where each phosphopeptide was detected. Maximum number of times a phosphopeptide could be detected was nine times (three conditions with three biological replicas for each condition). Around half of all phosphopeptides were detected in all nine runs.
- Four phosphopeptides were identified from VAMP8. The identified phosphopeptides had each a single phosphorylated residue at S17, T47, T53, and S54, respectively.
Markedly, this pruned list contained 2 phosphopeptides from a 100 amino acid long SNARE protein (Figs 1F and EV2C), vesicular‐associated membrane protein 8 (VAMP8), that is known to be critical for the fusion of vesicles with the plasma membrane during mast cell secretion (Lippert et al, 2007; Puri & Roche, 2008; Tiwari et al, 2008) but was not previously known to be regulated by phosphorylation. Using antibody staining, we confirmed that VAMP8 localizes to secretory granules before stimulation and translocates to the plasma membrane after antigen stimulation (Fig 1G). This is consistent with the role of VAMP8 as a secretory vesicle protein, v‐SNARE, that forms together with the t‐SNARE (syntaxins and SNAP23) complexes that mediate the fusion of secretory vesicles with the plasma membrane (Sakiyama et al, 2009; Jahn & Fasshauer, 2012; Lorentz et al, 2012; Brochetta et al, 2014).
Non‐synaptic VAMPs have evolutionarily conserved phosphorylation sites located deep inside the SNARE complex
The soluble part of the SNARE complex consists of four α‐helices (SNARE domains) (Fasshauer et al, 1998; Sutton et al, 1998; Südhof & Rothman, 2009). Surprisingly, the phosphorylation sites in VAMP8 that we identified face the 3 other α‐helices of the SNARE complex (Fig 2A) (Fasshauer et al, 1998; Sutton et al, 1998; Diao et al, 2015) as part of the 16 conserved SNARE layers (Fasshauer et al, 1998) that are buried inside the SNARE complex (T47 at layer +3, S54 at layer +5, and T53 close to layer +5) (Figs 2B–D and EV2C). An additional site was listed as a putative phosphorylation site in the PhosphoSitePlus (Hornbeck et al, 2015) database (S61 at layer +7).
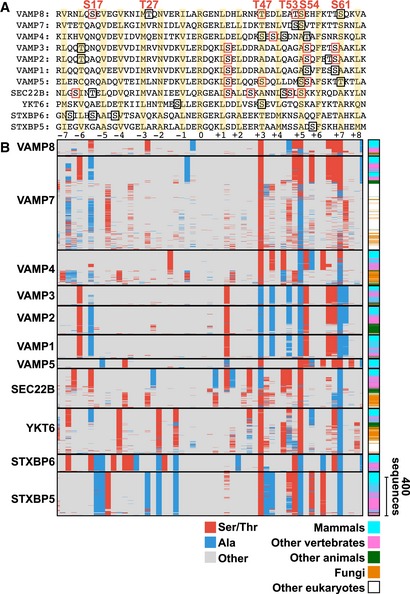
Figure 2. Non‐synaptic VAMPs have evolutionarily conserved phosphorylation sites located deep inside the SNARE complex.

- Crystal structure of VAMP8 in an autophagy SNARE complex (PDB: 4WY4). Residues T47, T53, S54, and S61 are shown as sticks‐and‐balls in the middle of the SNARE complex in an orthogonal view.
- Accessible surface area for each residue in the VAMP8 SNARE domain (calculated from PDB: 4WY4). The 16 SNARE layers are all buried inside the SNARE complex with minimal surface accessibility. The four phosphorylation sites (T47, T53, S54, and S61) all have low accessible surface areas.
- Sequence of rat VAMP8 SNARE domain compared to VAMP7 and VAMP2 (synaptobrevin). The 16 layers in the SNARE domain are highlighted in yellow and numbered below, with arginine (R) at layer zero.
- Sequence logo for the 16 layers of the v‐SNAREs examined (VAMP1, VAMP2, VAMP3, VAMP4, VAMP5, VAMP7, VAMP8, SEC22B, STXBP5, STXBP6, and YKT6) of 3,790 eukaryotic sequences. Serine or threonine residues are shown in red, alanine in blue, and all other in gray.
- An evolutionary comparison of 3,790 eukaryotic sequences of v‐SNAREs, comparing the four phosphorylation sites (T47, T53, S54, and S61). Serine or threonine residues are shown in red, alanine in blue, and any other amino acid in gray. Classification of species to the right.
Markedly, these serine and threonine phosphorylation sites inside the SNARE complex are highly conserved in all non‐synaptic VAMP subfamilies going back to plants (Fig 2E). In contrast, the well‐studied VAMP2 (synaptobrevin) (Jahn & Fasshauer, 2012; Südhof, 2013) and its homologs VAMP1 and VAMP3 that play a key role in synaptic vesicle fusion have alanine in place of serine/threonine at the same internal positions (Figs 2E and EV3A and B). This is significant since alanine residues cannot be phosphorylated and have a similar structural role as non‐phosphorylated serine/threonine. When examining 3,790 aligned eukaryotic VAMP protein sequences, particularly the residues 47 and 54 had a serine/threonine or alanine in 99.7 and 99.1% of the sequences, respectively (37.8% for position 53 and 91.3% for position 61) (Fig 2D and E). For every non‐synaptic VAMP4, VAMP5, VAMP7, VAMP8, SEC22B, YKT6, STXBP5, STXBP6 homolog, between one and four of the internal residues are serines or threonines whereas nearly every eukaryotic VAMP1, VAMP2, and VAMP3 genes involved in synaptic vesicle fusion (Südhof, 2013) do not have residues that can be phosphorylated at the same sites (Figs 2E and EV3A and B). Thus, exclusively the large group of non‐synaptic VAMPs that mediate slower secretion responses have evolutionary conserved internal sites that allow for regulation by protein kinases. A similar regulation may also occur in other SNARE proteins, since conserved serine and threonine residues can be found at similar locations within the SNARE domain of several other SNARE proteins (Fig EV4A–C).
Figure EV3. Evolutionarily conserved phosphorylation sites in v‐SNAREs.
- Comparison of the sequences for SNARE domains of different v‐SNAREs for rat. Phosphorylation sites found in our phosphoproteomics data (as well as in PhosphoSitePlus) are highlighted with a red box and phosphorylation sites reported in PhosphoSitePlus (but not found in our data) are highlighted with a black box. The 16 conserved SNARE domain layers are highlighted in yellow and numbered below, from −7 to +8, with arginine (R) at layer zero.
- Comparison of 3,790 eukaryotic sequences for the different v‐SNAREs. Serine or threonine residues are shown in red, alanine in blue, and all other in gray. Species category for each sequence is shown to the right with mammals in cyan, other vertebrates in pink, other animals in green, fungi in orange, and other eukaryotes in white.
Figure EV4. Evolutionarily conserved phosphorylation sites in SNARE‐Qa, SNARE‐Qb, and SNARE‐Qc proteins.

- Comparison of 4,564 eukaryotic sequences of the SNARE domain for SNARE‐Qa proteins. SNARE layer +4 has been reported in PhosphoSitePlus to be phosphorylated for STX4.
- Comparison of 3,675 eukaryotic sequences of the SNARE domain for SNARE‐Qb proteins. SNARE layer +4 has been reported in PhosphoSitePlus to be phosphorylated for VTI1A and SNARE layer +6 has been reported for GOSR2.
- Comparison of 2,375 eukaryotic sequences of the SNARE domain for SNARE‐Qc proteins. These sites have not yet been reported in PhosphoSitePlus.
Data information: Serine or threonine residues are shown in red, alanine in blue, and any other amino acid in gray. Species category for each sequence shown to the right in each panel.
Phosphomimetic VAMP8 reduces in vitro vesicle fusion
We hypothesized that phosphorylation of one or more of these VAMP8 sites prior to the formation of the SNARE complex may reduce SNARE‐mediated fusion by steric hindrance and by the added negative internal charge of the phosphate groups. Incomplete zippering of the SNARE complex toward the C‐terminal end may result in docked vesicles that fail to fuse with the plasma membrane (Hernandez et al, 2012). To test the fusogenic activity of VAMP8, we used in vitro ensemble content‐ and lipid‐mixing assays with SNARE proteins reconstituted in proteoliposomes (Materials and Methods) (Diao et al, 2015). We mixed liposomes containing purified VAMP8 together with liposomes containing both purified SNAP23 and STX3 (Figs 3A and EV5A) (Sakiyama et al, 2009; Brochetta et al, 2014). As expected for SNARE‐mediated membrane fusion, wild‐type non‐phosphorylated VAMP8 mediated content‐mixing (Fig 3A and B) and lipid‐mixing (Fig EV5B). However, when combining SNAP23 and STX3 vesicles with vesicles that contain a phosphomimetic version of VAMP8, VAMP8Glu (T47E, T53E, S54E), both the kinetics of content‐mixing (Fig 3B) and lipid‐mixing (Fig EV5B) were reduced, indicating that the kinetics of fusion is reduced by phosphorylation of these VAMP8 sites. Surprisingly, the effect of the phosphomimetic mutations is not as severe as deletion mutants in the C‐terminal end of the neuronal SNARE complex that have been studied previously (Hernandez et al, 2012). In accordance with the reduced fusion kinetics, SDS‐resistant SNARE complexes were formed when combining SNAP23, STX3, and VAMP8 (Fig EV5C) and VAMP8Glu was less efficient in forming SNARE complexes when compared to VAMP8 and VAMP8Ala (T47A, T53A, S54A).
Figure 3. Phosphomimetic VAMP8 reduces in vitro ensemble vesicle fusion.
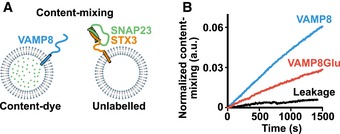
- Schematic of the in vitro ensemble content‐mixing assay. v‐SNARE vesicles (VAMP8) loaded with content dye and unlabeled t‐SNARE vesicles (SNAP23 and STX3).
- Reduced kinetics of content‐mixing was observed with VAMP8Glu (T47E, T53E, S54E) compared to wild‐type VAMP8 (n = 3). As a control (black line), the content‐mixing assay was performed by combining v‐SNARE vesicles (VAMP8) loaded with dye with unlabeled t‐SNARE vesicles prepared without SNAP23 and STX3. The slight steady increase of the control is due to a small amount of content dye leakage and consequent dequenching of the dyes.
Figure EV5. SNARE proteins in mast cell secretion.

- SNARE protein reconstitution was analyzed by SDS–PAGE of proteoliposomes containing t‐SNAREs (SNAP23 and STX3), and the v‐SNARE VAMP8 or VAMP8Glu (T47E, T53E, S54E).
- In vitro ensemble lipid‐mixing assay. v‐SNARE lipids labeled with acceptor dye (DiD) reconstituted with VAMP8 and t‐SNARE lipids labeled with donor dye (DiI) reconstituted with SNAP23 and STX3. v‐SNARE VAMP8Glu reduced the kinetics of lipid‐mixing compared to wild‐type VAMP8 (n = 3).
- SNARE complex formation of VAMP8, STX3, and SNAP23 is resistant to SDS. Half the samples were subjected to 5‐min boiling prior to SDS–PAGE. On the left, each purified protein was analyzed individually, and on the right, SDS‐resistant SNARE complex formation was assessed. There were no detectable differences between the SNARE complex formation of VAMP8 and VAMP8Ala, whereas VAMPGlu was less efficient since free STX3 was observed in the non‐boiled sample.
- Verification of siRNA knockdown of VAMP8 in RBL cells. qPCR was used to quantify mRNA for VAMP8 (n = 3). Values are mean ± SEM.
- Protein expression levels of VAMP8 mutants in RBL cells by Western blotting. siRNA knockdown of VAMP8 in combination with stable expression of VAMP8, VAMP8Ala, or VAMP8Glu, compared to endogenous expression of VAMP8. All VAMP8 constructs were resistent to siVAMP8 and untagged.
- Secretion of β‐hexosaminidase triggered by antigen in RBL cells with siRNA knockdown of endogenous VAMP8. Four different conditions: wild‐type RBL cells, stable overexpression of VAMP3, VAMP4, or VAMP7 (n = 6). Values are mean ± SEM.
Phosphorylation of VAMP8 suppresses mast cell secretion
To directly test whether phosphorylation of VAMP8 suppresses fusion in living cells, we measured secretion following antigen stimulation in RBL cells expressing VAMP8 mutants in combination with siRNA knockdown of endogenous VAMP8. We first confirmed the role of VAMP8 in secretion by showing that knockdown of VAMP8 reduced secretion, similar to previous mast cell studies (Lippert et al, 2007; Puri & Roche, 2008; Tiwari et al, 2008), and that this effect could be rescued with wild‐type VAMP8 (Figs 4A and EV5D and E). Of note, the sequence homolog VAMP3, VAMP4, and VAMP7 did not rescue the secretion defect in cells with siRNA knockdown of endogenous VAMP8 (Fig EV5F). To explore the role of the conserved phosphorylation sites of VAMP8, we mutated three sites (T47, T53, and S54) to alanine (VAMP8Ala), thus preventing all three sites from being phosphorylated. If phosphorylation of these sites had no functional relevance, secretion would be unaffected as compared to wild‐type VAMP8. Instead, we observed that VAMP8Ala did not only rescue the knockdown effect of VAMP8 siRNA, but was now able to trigger secretion of a larger fraction of the total internal vesicle pool compared to wild‐type VAMP8 (Fig 4A). Furthermore, consistent with the results of the in vitro fusion assays, the phosphomimetic VAMP8Glu (T47E, T53E, S54E) failed to rescue the VAMP8 siRNA suppression (Fig 4A). This argues that the normal antigen stimulation response includes a PKCB‐mediated suppression of secretion and that VAMP8 phosphorylation constitutes a negative arm in the incoherent feed‐forward regulation of secretion.
Figure 4. Phosphorylation of VAMP8 suppresses fusion but not docking in mast cell secretion.
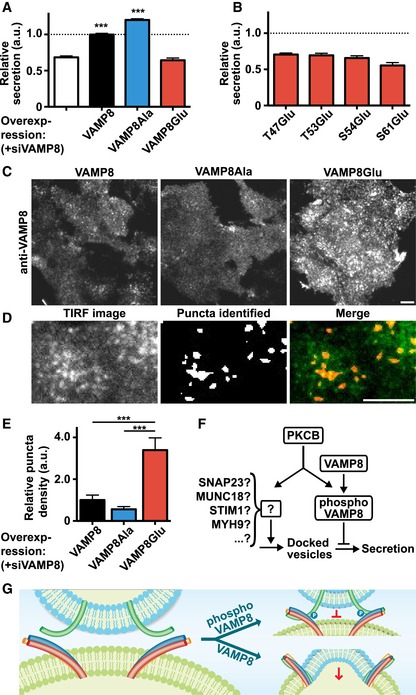
- IgE‐induced β‐hexosaminidase release in cells with siRNA knockdown of endogenous VAMP8. Wild‐type RBL cells in white, VAMP8 in black, VAMP8Ala (T47A, T53A, S54A) in blue, and VAMP8Glu (T47E, T53E, S54E) in red. VAMP8 siRNA reduced secretion, which was rescued by overexpressing VAMP8. VAMP8Ala further enhanced secretion, whereas VAMPGlu failed to rescue the siRNA effect (n = 12). Values are mean ± SEM; ***P < 0.001, one‐way ANOVA with Bonferroni's post hoc test.
- Single‐site phosphomimetic mutant of VAMP8 failed to rescue the VAMP8 siRNA effect (n = 11). Values are mean ± SEM.
- Immunocytochemistry of VAMP8 imaged at the plasma membrane using TIRF microscopy, following 4 min of antigen stimulation. Endogenous VAMP8 was knocked down with siRNA. Expressed wild‐type VAMP8 and VAMP8Ala (T47A, T53A, S54A) quickly assumed a uniform plasma membrane stain (due to VAMP8 vesicles fusion), whereas VAMP8Glu (T47E, T53E, S54E) showed a punctate stain, representing vesicles docked at the plasma membrane without fusion. Scale bar, 10 μm.
- Identification of puncta in TIRF immunocytochemistry images using MATLAB (see Materials and Methods). Identified puncta are shown in white in the middle image. Scale bar, 10 μm.
- Quantification of relative puncta density in TIRF immunocytochemistry images (n = 15, in total > 400 cells per condition). Values are mean ± SEM; ***P < 0.001, one‐way ANOVA with Bonferroni's post hoc test.
- PKCB forms an incoherent feed‐forward loop with two parallel pathways, one suppressing fusion through VAMP8 phosphorylation and one promoting docking through putative phosphorylation substrates.
- Vesicle fusion is suppressed by VAMP8 phosphorylation.
To investigate which of the phosphorylation sites is most relevant, we mutated each of the three sites individually to glutamic acid (T47E, T53E, S54E) and the additional putative phosphorylation site (S61E) which was found to be evolutionarily conserved (Fig 2E). Markedly, all of the single‐site mutants failed to rescue mast cell secretion in the VAMP8 siRNA‐treated cells (Fig 4B). This suggests that phosphorylation on either T47, T53, S54, or S61 alone is sufficient to completely abolish VAMP8 function in the SNARE complex during mast cell secretion.
Phosphorylation of VAMP8 prevents vesicle fusion but not docking
Finally, to examine docking and fusion of VAMP8‐containing vesicles during secretion, we employed total internal reflection fluorescence (TIRF) microscopy to image VAMP8 near the plasma membrane. Fixing cells 4 min after antigen stimulation enabled us to distinguish between fused vesicles, which result in VAMP8 uniformly diffusing within the plasma membrane, and docked VAMP8 vesicles, which are visible in TIRF as VAMP8 puncta. Interestingly, compared to VAMP8Ala and VAMP8 expressing cells, VAMP8Glu had a several‐fold higher puncta density (Fig 4C–E), suggesting that phosphorylation of VAMP8 still permits docking but prevents fusion of vesicles with the plasma membrane (Fig 4F and G).
Discussion
Together, our proteomics analysis identifies several putative substrates of PKCB such as MUNC18 (Brochetta et al, 2014; Genc et al, 2014), SNAP23 (Polgár et al, 2003; Lorentz et al, 2012), STIM1 (Pozo‐Guisado et al, 2010), and MYH9 (Ludowyke et al, 2006) (Appendix Table S1) that may enhance mast cell secretion as a positive arm in the incoherent feed‐forward regulation (Fig 4F). Surprisingly, we also discovered that VAMP8 has an evolutionarily conserved phosphorylation motif in the center of the SNARE fusion complex that acts in parallel as a negative regulatory arm in the same circuit to prevent fusion (Fig 4G). Phosphorylation of VAMP8 at these internal residues can ensure that the secretion response to even strong PKC stimuli is terminated and that only a fraction of the stored vesicles is released. In the case of mast cells, this is important as secretion needs to be tightly regulated to prevent overreach such as anaphylactic shock (Kalesnikoff & Galli, 2008). Based on our evolutionary analysis, the universal conservation of internal serine and threonine residues inside SNARE complexes suggests that suppression by VAMP phosphorylation is a general mechanism by which cells can reduce non‐synaptic vesicle fusion and thereby prevent the complete release of all secretory vesicles. We further speculate that suppression of membrane fusion by phosphorylation constitutes a general mechanism for SNARE proteins, since our analysis also revealed a similar phosphorylation motif in highly conserved residues in the SNARE domain of SNARE‐Qa, SNARE‐Qb, and SNARE‐Qc proteins (Fig EV4A–C).
Our data show that phosphomimetic VAMP8 decreases the kinetics of SNARE‐mediated fusion in vitro and, additionally, fail to rescue the effect of VAMP8 siRNA on secretion in living cells. Furthermore, alanine‐substituted VAMP8 increases RBL cell secretion, suggesting that VAMP8 phosphorylation inhibits mast cell secretion. Key roles of this negative regulatory arm are likely to provide a direct last minute break mechanism for fusion and also to ensure that cells can trigger partial pulsed fusion responses that leave the system capable to respond to future signal inputs. We propose that there is a competition between VAMP8 phosphorylation and SNARE‐mediated fusion, where protein kinase activity decreases and phosphatase activity increases the probability of VAMP8‐mediated vesicle fusion events. This protein kinase‐controlled mechanism to abort secretion provides for a potential new class of therapeutic strategies to inhibit the formation of specific non‐synaptic SNARE complexes to selectively suppress secretion associated with inflammation, hormone release, or cancer progression.
Materials and Methods
Antibodies
VAMP8 (Synaptic Systems #104303), PKCB for Western blotting (Santa Cruz Biotechnology #SC13149), PKCB for immunocytochemistry (Santa Cruz Biotechnology #SC210), and mouse anti‐DNP IgE (Sigma‐Aldrich #D8406).
Cell culture and secretion assay
The rat mast cell line RBL‐2H3 was maintained in DMEM containing 10% FBS. For antigen‐triggered secretion, cells were sensitized by overnight incubation with 0.5 μg/ml monoclonal mouse anti‐DNP IgE (Sigma‐Aldrich #D8406) and secretion was stimulated with antigen (1 μg/ml DNP). Antigen was used to stimulate secretion, except in Fig EV1A where 100 nM ionomycin (EMD Biosciences #407952) together with 100 nM PDBu (Sigma‐Aldrich #P1269) was used to stimulate secretion. Cells were stimulated in extracellular buffer (125 mM NaCl, 5 mM KCl, 20 mM HEPES, 1.5 mM MgCl2, 1.5 mM CaCl2, 10 mM d‐glucose, pH 7.4). Secretion was assessed by measuring release of β‐hexosaminidase with 1.5 mM 4‐methylumbelliferyl N‐acetyl‐β‐d‐glucosaminide (Sigma‐Aldrich #69585) in a fluorescent plate reader, Victor3 (PerkinElmer), at 37°C with RBL cells cultured in plastic 96‐well plates. β‐hexosaminidase levels were calculated by fitting a straight line to 11 measurement points acquired during 15 min. Cells were permeabilized with 0.5% Triton X‐100 to quantify β‐hexosaminidase retained in cells. Mean and standard error of the mean were calculated from multiple wells. In VAMP8 siRNA knockdown experiments, when comparing levels of secretion between stable cell lines expressing different VAMP8 mutants, secretion was normalized to siCtrl in the same stable cell line.
siRNA knockdown and DNA constructs
For siRNA knockdown, cells were electroporated using a custom‐built gold‐plated 96‐well electroporator (siRNAs at 1 μM and 13,500 cells per well) as described previously (Guignet & Meyer, 2008) and cultured for 48–72 h. Pools of four targeting siRNAs were purchased as SMARTpool siGENOME from Dharmacon. siRNA knockdown of VAMP8 was verified with qPCR using TaqMan Gene Expression Cells‐to‐CT Kit (Applied Biosystems #4399002 and #Rn00582868_m1) according to manufacturer's instructions. Lentivirus‐mediated transduction was used for stable overexpression. PKCB1 and PKCB2 were PCR‐amplified from a RBL‐2H3‐derived cDNA library and TOPO‐cloned into pENTR/D‐TOPO. Gateway LR clonase was subsequently used for transfer into a custom‐made lentiviral Gateway destination vector (pLV‐EF1a‐mCitrine‐N‐DEST) to yield PKCB1‐mCitrine and PKCB2‐mCitrine. cDNA sequences encoding wild‐type and mutant versions of VAMP8 were designed to have flanking 25‐bp homologies with a lentiviral vector and purchased from Integrated DNA Technologies. All VAMP8 sequences were siRNA resistant due to silent mutations and expressed without fluorescent tags. Untagged VAMP8 was used since fluorescently tagged VAMP8 had expected cellular localization, but failed to rescue the inhibitory effect of siVAMP8 on secretion. VAMP8 wild‐type, VAMP8Ala (T47A, T53A, S54A), VAMP8Glu (T47E, T53E, S54E), and single amino acid substitutions (VAMP8T47E, VAMP8T53E, VAMP8S54E, VAMP8S61E) were used. VAMP8 sequences were ligated into a custom‐made lentiviral vector (pLV‐EF1a‐MCS‐IRES‐mCitrine) by Gibson assembly (Gibson et al, 2009). Transduced cells expressed untagged VAMP8 variants along with IRES‐driven cytoplasmic mCitrine enabling their isolation by FACS. The sequence for siRNA‐resistant wild‐type VAMP8 with amino acids sequence matching rat is as follows: ATGGAAGCTTCCGGCTCCGCTGGCAACGATAGGGTGCGCAATCTCCAATCCGAAGTCGAAGGCGTGAAAAACATCATGACTCAAAACGTCGAAAGAATTCTCGCTCGCGGCGAAAATCTCGATCACTTGCGCAATAAAACCGAAGATCTCGAGGCTACCAGCGAGCATTTTAAAACCACCAGTCAAAAAGTCGCTAGAAAATTTTGGTGGAAAAACGTCAAAATGATCGTGATTATTTGCGTCATCGTGTTGATTATCTTGATTCTGATTATTTTGTTCGCCACCGGGACTATTCCTACCTGA. Lentiviral particles were generated in HEK‐293 cells by cotransfecting a transfer vector and the packaging plasmids pMDLG/pRRE, pRSV‐rev, and pCMV‐VSVG. Supernatants containing virus were collected 48 and 72 h post‐transfection, sterile‐filtered using 0.22‐μm Steriflip filtration units, and concentrated using Amicon Ultra Centrifugal filters (100K cutoff). RBL‐2H3 cells were infected and transduced cells were selected with FACS. DNA plasmids for VAMP3, VAMP4, and VAMP7 were prepared as described for VAMP8 and matched the amino acid sequence for rat. DNA plasmids used for SNARE reconstitution were human full‐length VAMP8, STX3, and SNAP23. The previously described VAMP8 (Diao et al, 2015) plasmid was mutated using QuickChange site‐directed mutagenesis kit (Stratagene) to create VAMP8Glu (T48E, T54E, S55E, these are the human amino acids that correspond to rat amino acids T47E, T53E, S54E). Full‐length human STX3 fused with a N‐terminal, TEV protease‐cleavable, hexa‐histidine tag in expression vector pJ414 was synthesized (DNA2.0). Full‐length human SNAP23 was a kind gift from Dr. Yeon‐Kyun Shin at Iowa State University. All cysteines in SNAP23 were mutated to serine, using QuickChange site‐directed mutagenesis kit (Stratagene), to facilitate reconstitution.
Genome editing
Transcription activator‐like effector nucleases (TALENs) targeting the first exon of PKCB were assembled following the Golden Gate cloning strategy (Cermak et al, 2011) and transiently expressed, together with an empty mCitrine plasmid, in RBL‐2H3 cells using a custom‐built gold‐plated electroporator (Guignet & Meyer, 2008). Following 48 h of culture, cells were sorted by FACS to enrich the expression of TALENs, then cultured for a week and subsequently subjected to single‐cell sorting into a 96‐well plate. The single‐cell clones were expanded, and aliquots were fixed, and immunostained for PKCB. Clones with low anti‐PKCB signal were selected and the genomic DNA of PKCB was sequenced. A cell clone with deletions in the region of PKCB targeted by the TALENs was identified and the complete knockout was verified by Western blotting.
Proteomics: cell stimulation
RBL‐2H3 cells were incubated overnight with anti‐DNP IgE (0.5 μg/ml), washed with extracellular buffer, and stimulated with antigen (1 μg/ml DNP) for 2 min at 37°C. Cells were then washed in cold PBS, harvested, and snap‐frozen in liquid N2. Three different conditions of stimulation were used: WT cells, PKCB knockout cells, and WT cells treated with 10 μM ruboxistaurin (Sigma‐Aldrich #SML0693). Three biological replicas were performed on three different days with six 15‐cm dishes for each condition (54 dishes in total for all replicas and all conditions).
Proteomics: protein extraction, reduction, alkylation, and digestion
Cell samples were lysed using a lysis buffer (8 M urea in 50 mM NH4HCO3, containing complete mini EDTA‐free cocktail and phosphoSTOP phosphatase inhibitor cocktail), followed by a sonication step for 1 min at 50% cycle in ice to maximize protein extraction. The extracted protein amount was first quantified by a Bradford protein assay; afterward, protein samples were reduced with 2 mM dithiothreitol (DTT) for 60 min at 37°C and alkylated with 4 mM iodoacetamide for 30 min at RT in the dark. DTT was further added to a final concentration of 4 mM to reduce overalkylation and samples further incubated for 30 min at room temperature. Afterward, samples were predigested with a Lys‐C endopeptidase at an enzyme/substrate ratio 1:100 (w/w) by incubating at 37°C for 3 h. Samples were then diluted with 50 mM NH4HCO3 to a final concentration of urea below 2 M (pH 7.5) and trypsin (Promega, Madison, WI, USA) was added to a final enzyme/substrate ratio of 1:100 (w/w). Tryptic digestion was conducted overnight at 37°C. The digestion was quenched by acidification with formic acid (FA) to a final pH < 3. Peptide samples were desalted by solid‐phase extraction. Briefly, samples were loaded onto Sep‐Pak tC18 cartridges (Waters, Milford, MA, USA), desalted by 2 washing steps with water containing 0.1% FA, and eluted with 80% acetonitrile (ACN) containing 6% trifluoroacetic acid (TFA).
Proteomics: phosphopeptide enrichment with TiO2 beads
Peptide samples were subjected to a phosphopeptide enrichment step employing TiO2 material (Titansphere, 5 μm, GL Sciences, Japan), with high selectivity for phosphorylated compounds. The TiO2 beads were weighed in an Eppendorf tube (1 mg of beads per 1 mg of protein digest) and activated with methanol, followed by two conditioning steps with loading buffer (80% ACN, 6% TFA). Peptide samples, already dissolved in the loading buffer, were mixed with the beads and incubated for 1 h, while gently vortexing, at room temperature. Afterward, three sequential washing steps of the phosphopeptide‐bound beads were performed with (i) loading buffer; (ii) 50% ACN, 0.5% TFA, 200 mM NaCl; and (iii) 50% ACN, 0.1% TFA. The bound phosphopeptides were then eluted with 5% ammonia solution (pH > 10). The collected eluate was immediately acidified by adding 100% TFA (to a final pH <3) to prevent hydrolysis of the phospho‐groups. The resulting phosphopeptides were further desalted using C18 MicroSpin Column (The Nest Group, MA), eluted with 80% ACN, 0.1% FA, dried in vacuo, and stored at −80°C for subsequent mass spectrometry analysis.
Proteomics: shotgun phospho‐proteomics analysis
A Q Exactive Plus (Thermo Fisher Scientific) mass spectrometer, equipped with an EASY nanoLC 1000 system (Thermo Fisher Scientific), was employed for shotgun phospho‐proteomics measurement. Peptides were separated on a 40‐cm‐long 75‐μm i.d. in‐house packed column (1.9 μm, ReproSil‐Pur 120 C18‐AQ, Dr. Maisch, Germany) using a 100 min gradient from 5% ACN to 25% ACN. The mass spectrometer was operated in data‐dependent mode, automatically switching between MS and MS/MS. In the Q Exactive, full‐scan MS spectra (from m/z 350 to 1,500) were acquired with a resolution of 70,000 FHMW at 200 m/z after accumulation to target value of 3e6 in the C‐trap (maximum injection time was 64 ms). After the survey scans, the twenty most intense precursor ions at an intensity threshold above 3.6e4 were selected for MS/MS with an isolation width of 1.4 Da after accumulation to a target value of 1e5 (maximum injection time was 55 ms). MS/MS scan resolution was 17,500 FHMW. Peptide fragmentation was carried out by higher‐energy collisional dissociation (HCD), with a normalized collision energy (CE) of 25. MS raw data from the shotgun LC‐MS/MS analyses were processed by MaxQuant (1.4.1.2) searching against a rat database (UniProt), with trypsin digestion allowing 2 missed cleavages, carbamidomethylation (C) as fixed modification and oxidation (M), and phosphorylation (STY) as variable modifications. Main search precursor tolerance was set to 10 ppm and MS/MS to 20 ppm. For quantification, the label‐free quantification module was activated.
Proteomics: data analysis
Data were normalized between runs to have same median intensity. Peptides with intensities close to the noise level were excluded (log2(intensity) < 21). Average values, shown in Fig 1F and Appendix Table S1, were calculated by taking the mean of the 2 highest values. In cases where only 2 measurements existed, those 2 were averaged, and if only one existed, that value was used.
Microscopy
Endogenously expressed VAMP8 was knocked down with siRNA in cells with stable overexpression of VAMP8, VAMP8Ala (T47A, T53A, S54A), or VAMP8Glu (T47E, T53E, S54E). Secretion was stimulated by antigen treatment for 4 min, and cells were then fixed in 4% PFA, followed immunostaining with permeabilization/blocking solution (0.1% Triton X‐100, 10% FBS, 1% BSA, 0.01% NaN3, in PBS). A custom‐built prism‐based total internal reflection fluorescence (TIRF) microscope was used for fluorescent imaging at the plasma membrane with a 594 nm laser, as previously described (Wollman & Meyer, 2012). Vesicles (puncta) were quantified using MATLAB (MathWorks). Briefly, images were background subtracted and top‐hat filtering was used to identify puncta. Puncta intensity was calculated by taking the median of the VAMP8 immunofluorescence signal of each puncta. Relative puncta density was calculated by normalizing number of puncta for each image to cell density, by dividing with the sum of all pixels for the nuclear marker Hoechst 33342, and then normalizing the cell line expressing VAMP8 to 1.0. Images shown in Fig 1G were captured using a custom assembled Yokogawa spinning disk confocal system built around a Zeiss Axiovert 200M microscope with a confocal spinning disk head (Yokogawa CSU22), a QuantEM:512SC EMCCD camera (Photometrics), a 514 nm laser (Ar‐Kr, 400 mW, Melles Griot), a 63× 1.2 NA C‐Apochromat water immersion objective and controlled by μManager (Edelstein et al, 2014). Ca2+ imaging (Fig EV1D and E) and screening for PKCB knockout clones (immunostaining with PKCB antibody) were done using a fully automated fluorescence microscope (ImageXpress Micro XL, Molecular Devices), equipped with a Sola Light Engine (Lumencor), a Zyla 5.5 sCMOS camera (Andor), and a 20× 0.75 NA Plan Apo objective (Nikon). Cells for Ca2+ imaging were loaded with the Ca2+‐sensitive fluorescent indicator Fluo‐3/AM (Invitrogen) at 5 μM for 30 min in full growth media at 37°C and then imaged in extracellular buffer as described previously (Malmersjö et al, 2013).
Bioinformatics
To assess the conservation of phosphorylation sites among different species, we used the standalone versions of CPhos (Zhao et al, 2012) (http://helixweb.nih.gov/CPhos) to calculate a score for each identified phosphorylation site in our phosphoproteomics data. Only phosphorylation sites with a perfect phosphorylation score (phosphorylation site score = 1) for mammals were considered. Using Ingenuity Pathway Analysis (www.ingenuity.com), we searched for genes important for degranulation (259 genes), exocytosis (385 genes), and secretion (730 genes), in total 1,013 unique genes. Out of these 1,013 genes known to be involved in secretion, 545 genes were present in our phosphoproteomics data set. Analysis of the evolutionarily conserved phosphorylation sites in VAMP8 and other v‐SNAREs were performed with a custom script in MATLAB (MathWorks). Briefly, homologs of the different rat v‐SNAREs (R‐SNARE, NCBI cd15843: VAMP1, VAMP2, VAMP3, VAMP4, VAMP5, VAMP7, VAMP8, SEC22B, STXBP5, STXBP6, and YKT6) were identified by NCBI BLAST against all RefSeq for eukaryotes. The BLAST hits were considered homologs if reverse BLAST against rat RefSeq database mapped back to the initial blast query. The SNARE domain of the homolog sequences was then aligned and serine, threonine, and alanine residues were identified. A similar analysis was done for SNARE‐Qa, SNARE‐Qb, and SNARE‐Qc (NCBI cd15840, cd15841, cd15842). Accessible surface area for each amino acid was calculated from the crystal structure of PDB: 4WY4 (Diao et al, 2015) using STRIDE (http://webclu.bio.wzw.tum.de/stride) (Heinig & Frishman, 2004). PyMol was used to visualize the crystal structure.
SNARE reconstitution and proteoliposome preparation for the ensemble lipid‐mixing assay
v‐SNARE vesicles contained reconstituted VAMP8, while t‐SNARE vesicles contained reconstituted STX3 and SNAP23. For v‐SNARE vesicles, the lipid composition was phosphatidylcholine (PC) (78%), phosphatidylserine (PS) (20%), and 1,1′‐dioctadecyl‐3,3,3′,3′‐tetramethylindodicarbocyanine perchlorate (DiD) (2%), and for t‐SNARE vesicles, the lipid composition was phosphatidylcholine (PC) (78%), phosphatidylserine (PS) (20%), and 1,1′‐dioctadecyl‐3,3,3′,3′‐tetramethylindocarbocyanine perchlorate (DiI) (2%) (Molecular Probes). The lipid mixtures PS:PC:DiD or PS:PC:DiI were solubilized in chloroform and then dried to form a lipid film on the wall of a glass tube. The dried lipid film was resuspended in proteoliposome buffer (20 mM HEPES, 90 mM KCl, pH 7.4). After five freeze–thaw cycles, unilamellar proteoliposomes were extruded through polycarbonate filters (100 nm pore size, Avanti Polar Lipids) at least 39 times. For reconstitution, t‐SNAREs were pre‐assembled by mixing STX3 and SNAP23 at the ratio of 1:2 at room temperature for 15 min. The proteins (STX3/SNAP23 or VAMP8) and liposomes were mixed together at the desired lipid to protein (L/P) ratio of 200~500. Then, the mixture containing ~0.8% octyl glucoside (OG) in the buffer was kept at 4°C for 20 min. The mixture was diluted two times with proteoliposome buffer and dialysis in 2 l proteoliposome buffer overnight, causing insertion of proteins into the vesicle membranes by detergent depletion.
SNARE reconstitution and proteoliposome preparation for the ensemble content‐mixing assay
The lipid composition for both v‐SNARE and t‐SNARE vesicles was phosphatidylcholine (PC) (80%) and phosphatidylserine (PS) (20%). The t‐SNARE proteoliposomes were prepared by extrusion as described above for the lipid‐mixing assay. For preparation of the v‐SNARE vesicles, liposomes containing sulforhodamine B (Invitrogen) were initially also prepared by extrusion and then mixed with VAMP8 (at a L/P ratio of 500:1) in proteoliposome buffer with a final concentration of ~0.8% OG and 50 mM sulforhodamine B. Then, this mixture was kept at 4°C for 20 min. Detergent‐free proteoliposome buffer plus 50 mM sulforhodamine B was added to the protein–lipid mixture until the detergent concentration was 0.4% (which is slightly below the critical micelle concentration of ~0.7%), that is, vesicle partially form. The v‐vesicles subsequently reformed during size exclusion chromatography using a Sepharose CL‐4B column, packed under near constant pressure by gravity with a peristaltic pump (GE Healthcare, Uppsala, Sweden) in a 5 ml column with a 2 ml bed volume, that was equilibrated with buffer V (20 mM HEPES, pH 7.4, 90 mM NaCl, 20 μM EGTA, and 0.1% 2‐mercaptoethanol). The eluent was subjected to dialysis in 2 l proteoliposome buffer overnight. We note that for v‐SNARE vesicles, the chromatography equilibration and elution buffers did not contain sulforhodamine B, so the effective sulforhodamine B concentration inside v‐SNARE vesicles is considerably, up to tenfold, lower than 50 mM.
Ensemble lipid‐ and content‐mixing assays
Protein‐reconstituted v‐SNARE and t‐SNARE vesicles were mixed at a molar ratio of 1:1, both at 0.1 mM lipid concentration. The ensemble lipid‐mixing experiments were carried out with DiI donor dye‐ and DiD acceptor dye‐labeled (proteo‐) liposomes as described previously (Su et al, 2008). Protein‐reconstituted t‐SNARE and v‐SNARE proteoliposomes were mixed at a molar ratio of 1:1. Lipid‐mixing is measured as the fluorescent emission (670 nm) of DiD dyes in v‐SNARE vesicles by FRET using 530 nm laser light excitation of the DiI dyes in t‐SNARE vesicles. The fluorescence intensity was monitored in two channels at 570 and 670 nm, respectively. For the ensemble content‐mixing assay, self‐quenched sulforhodamine B molecules encapsulated in the v‐SNARE vesicles were used as a content indicator. Experiments were measured by an increase of fluorescence emission at 570 nm of the sulforhodamine B dyes upon 530 nm excitation that results as the initially self‐quenched dye is diluted upon complete fusion (i.e. content‐mixing) between labeled v‐SNARE vesicles and unlabeled t‐SNARE vesicles. Fluorescence changes were recorded with a Varian Cary Eclipse model fluorescence spectrophotometer using a quartz cell of 100 μl with a 5 mm path length.
SNARE complex formation
SNARE complexes in Fig EV5C were formed by mixing purified VAMP8 (alternatively VAMP8Glu or VAMP8Ala) together with STX3 and SNAP23 at a molar ratio of 1:1:1, in SDS sample buffer, at room temperature for 30 min. Half of the samples were then boiled for 5 min. Proteins were separated using SDS–PAGE followed by Coomassie Blue staining of the gel.
Full‐length VAMP8, STX3, and SNAP23 expression and purification
Human full‐length VAMP8, STX3, and SNAP23 were expressed and purified according to previously reported protocols (Studier, 2005; Diao et al, 2015) with modifications. Briefly, SNAP23 and VAMP8 were expressed as N‐terminal GST fusions in BL21 (DE3) cells. The fusion proteins were bound to glutathione Sepharose 4B (GE Healthcare), washed, and eluted by cleaving the protein from the GST using thrombin in the case of SNAP23 and TEV protease in the case of VAMP8 and VAMP8Glu. n‐octyl glucoside detergent was used in the buffers for SNAP23 and VAMP8 to maintain the solubility of proteins. STX3 was expressed as an N‐terminal 6 His tag fusion protein and purified on nickel NTA agarose (Qiagen) followed by removal of the 6 His tag by TEV protease cleavage and further purification on a MonoQ anion exchange column (GE Healthcare).
Statistical analysis
In all graphs, data are presented as mean values ± SEM. Statistical analysis was performed with MATLAB (MathWorks) or Prism (GraphPad). Bartlett's test was used to check equality of variance. In the case of equal variances, Student's t‐test or one‐way ANOVA with Bonferroni's post hoc test was used, with significance levels *P < 0.05, **P < 0.01, or ***P < 0.001. In the case of unequal variances, data were log‐transformed to achieve equal variances or the nonparametric Mann–Whitney U‐ or Kruskal–Wallis tests were used.
Author contributions
SM and TM conceived the study. SM performed experiments and analyzed data. SDP and BB performed proteomics experiments and data analysis. JD, YL, RAP, and ALW performed the in vitro membrane fusion experiments. SM, MAM, and MP generated PKCB knockout cell line. AH assisted with cloning and advice for other experiments. SM, BB, ATB, and TM, designed the experiments and wrote the manuscript with the help of all authors.
Conflict of interest
The authors declare that they have no conflict of interest.
Supporting information
Appendix
Expanded View Figures PDF
Review Process File
Acknowledgements
We thank members of the Brunger Lab and the Meyer Lab for suggestions and comments on the manuscript. We thank Dr. Yeon‐Kyun Shin for the SNAP23 construct, Carlos Gonzalez for illustrations, Dr. Paul J. Boersema for proteomics support, and the Picotti Lab and Functional Genomics Center Zurich for providing access to their LC‐MS instrumentation. Cell sorting was performed on instruments in the Stanford Shared FACS Facility. This study was supported by NIH grants (GM030179 to T.M. and R37MH63105 to A.T.B.), the Stanford Center for Systems Biology, the Swedish Research Council Fellowship (2009‐546) (S.M.), the Swedish Society for Medical Research Fellowship (S.M.), Transition Postdoc Fellowship from SystemsX.ch (S.D.P.), SNSF Assistant Professorship grant (PP00P3‐144874) (B.B.), a SystemsX PhopshoNetPPM grant (B.B.) and funding from the European Research Council (ERC) under the European Union's Seventh Framework Programme (FP7/2007‐2013)/ERC Grant Agreement no. 336921 (B.B.).
The EMBO Journal (2016) 35: 1810–1821
References
- Bousquet SM, Monet M, Boulay G (2010) Protein kinase C‐dependent phosphorylation of transient receptor potential canonical 6 (TRPC6) on serine 448 causes channel inhibition. J Biol Chem 285: 40534–40543 [DOI] [PMC free article] [PubMed] [Google Scholar]
- Brochetta C, Suzuki R, Vita F, Soranzo MR, Claver J, Madjene LC, Attout T, Vitte J, Varin‐Blank N, Zabucchi G, Rivera J, Blank U (2014) Munc18‐2 and syntaxin 3 control distinct essential steps in mast cell degranulation. J Immunol 192: 41–51 [DOI] [PMC free article] [PubMed] [Google Scholar]
- Cermak T, Doyle EL, Christian M, Wang L, Zhang Y, Schmidt C, Baller JA, Somia NV, Bogdanove AJ, Voytas DF (2011) Efficient design and assembly of custom TALEN and other TAL effector‐based constructs for DNA targeting. Nucleic Acids Res 39: e82 [DOI] [PMC free article] [PubMed] [Google Scholar]
- Diao J, Liu R, Rong Y, Zhao M, Zhang J, Lai Y, Zhou Q, Wilz LM, Li J, Vivona S, Pfuetzner RA, Brunger AT, Zhong Q (2015) ATG14 promotes membrane tethering and fusion of autophagosomes to endolysosomes. Nature 520: 563–566 [DOI] [PMC free article] [PubMed] [Google Scholar]
- Edelstein AD, Tsuchida MA, Amodaj N, Pinkard H, Vale RD, Stuurman N (2014) Advanced methods of microscope control using μManager software. J Biol Methods 1: e10 [DOI] [PMC free article] [PubMed] [Google Scholar]
- Fasshauer D, Sutton RB, Brunger AT, Jahn R (1998) Conserved structural features of the synaptic fusion complex: SNARE proteins reclassified as Q‐ and R‐SNAREs. Proc Natl Acad Sci USA 95: 15781–15786 [DOI] [PMC free article] [PubMed] [Google Scholar]
- Genc O, Kochubey O, Toonen RF, Verhage M, Schneggenburger R (2014) Munc18‐1 is a dynamically regulated PKC target during short‐term enhancement of transmitter release. Elife 3: e01715 [DOI] [PMC free article] [PubMed] [Google Scholar]
- Gibson DG, Young L, Chuang R‐Y, Venter JC, Hutchison CA, Smith HO (2009) Enzymatic assembly of DNA molecules up to several hundred kilobases. Nat Meth 6: 343–345 [DOI] [PubMed] [Google Scholar]
- Guignet EG, Meyer T (2008) Suspended‐drop electroporation for high‐throughput delivery of biomolecules into cells. Nat Meth 5: 393–395 [DOI] [PMC free article] [PubMed] [Google Scholar]
- Heinig M, Frishman D (2004) STRIDE: a web server for secondary structure assignment from known atomic coordinates of proteins. Nucleic Acids Res 32: W500–W502 [DOI] [PMC free article] [PubMed] [Google Scholar]
- Hernandez JM, Stein A, Behrmann E, Riedel D, Cypionka A, Farsi Z, Walla PJ, Raunser S, Jahn R (2012) Membrane fusion intermediates via directional and full assembly of the SNARE complex. Science 336: 1581–1584 [DOI] [PMC free article] [PubMed] [Google Scholar]
- Hirling H, Scheller RH (1996) Phosphorylation of synaptic vesicle proteins: modulation of the alpha SNAP interaction with the core complex. Proc Natl Acad Sci USA 93: 11945–11949 [DOI] [PMC free article] [PubMed] [Google Scholar]
- Hornbeck PV, Zhang B, Murray B, Kornhauser JM, Latham V, Skrzypek E (2015) PhosphoSitePlus, 2014: mutations, PTMs and recalibrations. Nucleic Acids Res 43: D512–D520 [DOI] [PMC free article] [PubMed] [Google Scholar]
- Ishii H, Jirousek MR, Koya D, Takagi C, Xia P, Clermont A, Bursell SE, Kern TS, Ballas LM, Heath WF, Stramm LE, Feener EP, King GL (1996) Amelioration of vascular dysfunctions in diabetic rats by an oral PKC beta inhibitor. Science 272: 728–731 [DOI] [PubMed] [Google Scholar]
- Jahn R, Fasshauer D (2012) Molecular machines governing exocytosis of synaptic vesicles. Nature 490: 201–207 [DOI] [PMC free article] [PubMed] [Google Scholar]
- Kalesnikoff J, Galli SJ (2008) New developments in mast cell biology. Nat Immunol 9: 1215–1223 [DOI] [PMC free article] [PubMed] [Google Scholar]
- Kim D, Kwon Y‐K, Cho K‐H (2008) The biphasic behavior of incoherent feed‐forward loops in biomolecular regulatory networks. BioEssays 30: 1204–1211 [DOI] [PubMed] [Google Scholar]
- Leitges M, Schmedt C, Guinamard R, Davoust J, Schaal S, Stabel S, Tarakhovsky A (1996) Immunodeficiency in protein kinase cbeta‐deficient mice. Science 273: 788–791 [DOI] [PubMed] [Google Scholar]
- Leitges M, Gimborn K, Elis W, Kalesnikoff J, Hughes MR, Krystal G, Huber M (2002) Protein kinase C‐delta is a negative regulator of antigen‐induced mast cell degranulation. Mol Cell Biol 22: 3970–3980 [DOI] [PMC free article] [PubMed] [Google Scholar]
- Li J, Han YR, Plummer MR, Herrup K (2009) Cytoplasmic ATM in neurons modulates synaptic function. Curr Biol 19: 2091–2096 [DOI] [PMC free article] [PubMed] [Google Scholar]
- Lippert U, Ferrari DM, Jahn R (2007) Endobrevin/VAMP8 mediates exocytotic release of hexosaminidase from rat basophilic leukaemia cells. FEBS Lett 581: 3479–3484 [DOI] [PubMed] [Google Scholar]
- Lorentz A, Baumann A, Vitte J, Blank U (2012) The SNARE machinery in mast cell secretion. Front Immunol 3: 143 [DOI] [PMC free article] [PubMed] [Google Scholar]
- Ludowyke RI, Elgundi Z, Kranenburg T, Stehn JR, Schmitz‐Peiffer C, Hughes WE, Biden TJ (2006) Phosphorylation of nonmuscle myosin heavy chain IIA on Ser 1917 is mediated by protein kinase C beta II and coincides with the onset of stimulated degranulation of RBL‐2H3 mast cells. J Immunol 177: 1492–1499 [DOI] [PubMed] [Google Scholar]
- Ma W, Trusina A, El‐Samad H, Lim WA, Tang C (2009) Defining network topologies that can achieve biochemical adaptation. Cell 138: 760–773 [DOI] [PMC free article] [PubMed] [Google Scholar]
- Malmersjö S, Rebellato P, Smedler E, Planert H, Kanatani S, Liste I, Nanou E, Sunner H, Abdelhady S, Zhang S, Andäng M, El Manira A, Silberberg G, Arenas E, Uhlén P (2013) Neural progenitors organize in small‐world networks to promote cell proliferation. Proc Natl Acad Sci USA 110: E1524–E1532 [DOI] [PMC free article] [PubMed] [Google Scholar]
- Mangan S, Alon U (2003) Structure and function of the feed‐forward loop network motif. Proc Natl Acad Sci USA 100: 11980–11985 [DOI] [PMC free article] [PubMed] [Google Scholar]
- McHugh D, Sharp EM, Scheuer T, Catterall WA (2000) Inhibition of cardiac L‐type calcium channels by protein kinase C phosphorylation of two sites in the N‐terminal domain. Proc Natl Acad Sci USA 97: 12334–12338 [DOI] [PMC free article] [PubMed] [Google Scholar]
- Nagy G, Matti U, Nehring RB, Binz T, Rettig J, Neher E, Sørensen JB (2002) Protein kinase C‐dependent phosphorylation of synaptosome‐associated protein of 25 kDa at Ser187 potentiates vesicle recruitment. J Neurosci 22: 9278–9286 [DOI] [PMC free article] [PubMed] [Google Scholar]
- Nechushtan H, Leitges M, Cohen C, Kay G, Razin E (2000) Inhibition of degranulation and interleukin‐6 production in mast cells derived from mice deficient in protein kinase Cbeta. Blood 95: 1752–1757 [PubMed] [Google Scholar]
- Newton AC (2010) Protein kinase C: poised to signal. Am J Physiol Endocrinol Metab 298: E395–E402 [DOI] [PMC free article] [PubMed] [Google Scholar]
- Nishizuka Y (1986) Studies and perspectives of protein kinase C. Science 233: 305–312 [DOI] [PubMed] [Google Scholar]
- Oancea E, Meyer T (1998) Protein kinase C as a molecular machine for decoding calcium and diacylglycerol signals. Cell 95: 307–318 [DOI] [PubMed] [Google Scholar]
- Polgár J, Lane WS, Chung S‐H, Houng AK, Reed GL (2003) Phosphorylation of SNAP‐23 in activated human platelets. J Biol Chem 278: 44369–44376 [DOI] [PubMed] [Google Scholar]
- Pozo‐Guisado E, Campbell DG, Deak M, Alvarez‐Barrientos A, Morrice NA, Alvarez IS, Alessi DR, Martín‐Romero FJ (2010) Phosphorylation of STIM1 at ERK1/2 target sites modulates store‐operated calcium entry. J Cell Sci 123: 3084–3093 [DOI] [PubMed] [Google Scholar]
- Puri N, Roche PA (2008) Mast cells possess distinct secretory granule subsets whose exocytosis is regulated by different SNARE isoforms. Proc Natl Acad Sci USA 105: 2580–2585 [DOI] [PMC free article] [PubMed] [Google Scholar]
- Sakiyama H, Tadokoro S, Nakanishi M, Hirashima N (2009) Membrane fusion between liposomes containing SNARE proteins involved in mast cell exocytosis. Inflamm Res 58: 139–142 [DOI] [PubMed] [Google Scholar]
- Shimazaki Y, Nishiki T, Omori A, Sekiguchi M, Kamata Y, Kozaki S, Takahashi M (1996) Phosphorylation of 25‐kDa synaptosome‐associated protein. Possible involvement in protein kinase C‐mediated regulation of neurotransmitter release. J Biol Chem 271: 14548–14553 [DOI] [PubMed] [Google Scholar]
- Shu Y, Liu X, Yang Y, Takahashi M, Gillis KD (2008) Phosphorylation of SNAP‐25 at Ser187 mediates enhancement of exocytosis by a phorbol ester in INS‐1 cells. J Neurosci 28: 21–30 [DOI] [PMC free article] [PubMed] [Google Scholar]
- Studier FW (2005) Protein production by auto‐induction in high density shaking cultures. Protein Expr Purif 41: 207–234 [DOI] [PubMed] [Google Scholar]
- Su Z, Ishitsuka Y, Ha T, Shin Y‐K (2008) The SNARE complex from yeast is partially unstructured on the membrane. Structure 16: 1138–1146 [DOI] [PMC free article] [PubMed] [Google Scholar]
- Südhof TC, Rothman JE (2009) Membrane fusion: grappling with SNARE and SM proteins. Science 323: 474–477 [DOI] [PMC free article] [PubMed] [Google Scholar]
- Südhof TC (2013) Neurotransmitter release: the last millisecond in the life of a synaptic vesicle. Neuron 80: 675–690 [DOI] [PMC free article] [PubMed] [Google Scholar]
- Sutton RB, Fasshauer D, Jahn R, Brunger AT (1998) Crystal structure of a SNARE complex involved in synaptic exocytosis at 2.4 A resolution. Nature 395: 347–353 [DOI] [PubMed] [Google Scholar]
- Tiwari N, Wang C‐C, Brochetta C, Ke G, Vita F, Qi Z, Rivera J, Soranzo MR, Zabucchi G, Hong W, Blank U (2008) VAMP‐8 segregates mast cell‐preformed mediator exocytosis from cytokine trafficking pathways. Blood 111: 3665–3674 [DOI] [PubMed] [Google Scholar]
- Tsai F‐C, Seki A, Yang HW, Hayer A, Carrasco S, Malmersjö S, Meyer T (2014) A polarized Ca2+, diacylglycerol and STIM1 signalling system regulates directed cell migration. Nat Cell Biol 16: 133–144 [DOI] [PMC free article] [PubMed] [Google Scholar]
- Wickner W, Schekman R (2008) Membrane fusion. Nat Struct Mol Biol 15: 658–664 [DOI] [PMC free article] [PubMed] [Google Scholar]
- Wollman R, Meyer T (2012) Coordinated oscillations in cortical actin and Ca2+ correlate with cycles of vesicle secretion. Nat Cell Biol 14: 1261–1269 [DOI] [PMC free article] [PubMed] [Google Scholar]
- Zhao B, Pisitkun T, Hoffert JD, Knepper MA, Saeed F (2012) CPhos: a program to calculate and visualize evolutionarily conserved functional phosphorylation sites. Proteomics 12: 3299–3303 [DOI] [PMC free article] [PubMed] [Google Scholar]
Associated Data
This section collects any data citations, data availability statements, or supplementary materials included in this article.
Supplementary Materials
Appendix
Expanded View Figures PDF
Review Process File