

Abstract
Mitochondrial dynamics and functionality are linked to the autophagic degradative pathway under several stress conditions. However, the interplay between mitochondria and autophagy upon cell death signalling remains unclear. The T‐cell receptor pathway signals the so‐called activation‐induced cell death (AICD) essential for immune tolerance regulation. Here, we show that this apoptotic pathway requires the inhibition of macroautophagy. Protein kinase‐A activation downstream of T‐cell receptor signalling inhibits macroautophagy upon AICD induction. This leads to the accumulation of damaged mitochondria, which are fragmented, display remodelled cristae and release cytochrome c, thereby driving apoptosis. Autophagy‐forced reactivation that clears the Parkin‐decorated mitochondria is as effective in inhibiting apoptosis as genetic interference with cristae remodelling and cytochrome c release. Thus, upon AICD induction regulation of macroautophagy, rather than selective mitophagy, ensures apoptotic progression.
Keywords: AICD, autophagy, mitochondrial dynamics, T cells
Subject Categories: Autophagy & Cell Death, Immunology
Introduction
Most forms of apoptosis induced by intrinsic stimuli are amplified by mitochondria, which release cytochrome c and other factors to activate the program of cell demise. Apoptosis amplification is one of the many essential mitochondrial functions, which also include biosynthetic and metabolic pathways, ATP production, calcium buffering and redox homeostasis (Ernster & Schatz, 1981; Rizzuto et al, 2000; Scorrano, 2009). The functional variety is paralleled by the dynamic nature of these organelles, whose morphology is regulated by a set of so‐called mitochondria‐shaping proteins (Bereiter‐Hahn & Voth, 1994). Among these, the dynamin‐related GTPases MFN1, MFN2 and OPA1 are the main regulators of mitochondrial fusion, while DRP1, FIS1 and MFF control fragmentation (Chan, 2012). Mitochondrial fragmentation and cristae remodelling have been associated with cell death in many models (Scorrano et al, 2002; Olichon et al, 2003; Arnoult et al, 2005; Frezza et al, 2006). In addition, mitochondrial fragmentation and dysfunction mark mitochondria for degradation in the selective autophagic process called mitophagy. Indeed, once damaged and committed to degradation, mitochondria fragment to sterically allow their selective engulfment in autophagosomes. The removal of dysfunctional mitochondria through a selective autophagy, which normally proceeds through a pathway dependent on mitochondrial membrane depolarization and involving PINK1 and Parkin (Narendra et al, 2008, 2010; Kane et al, 2014; Lazarou et al, 2015), acts as a cell pro‐survival mechanism (Choi et al, 2013). Indeed, if mitophagy could not occur, damaged mitochondria will pile up, making pro‐apoptotic proteins available. On the other hand, if mitophagy is in place, damaged mitochondria will be cleared and will not contribute pro‐apoptotic molecules. The latter scenario is clearly in conflict with the requirement for mitochondria‐derived pro‐apoptotic molecules during the progression of cell death. The importance of fragmentation for mitophagy is substantiated by the discovery that, conversely, during macroautophagy (a non‐selective autophagic process, active in basal or nutrient‐depleted conditions to ensure a proper metabolic recycling (Cecconi & Levine, 2008); hereafter “autophagy”), mitochondria elongate and are excluded from autophagosomes in order to maintain ATP production and sustain cell viability (Gomes & Scorrano, 2013). Since during apoptosis mitochondria are fragmented and dysfunctional, but not degraded, mitophagy should be inhibited.
An added complication in the study of the relationship between mitophagy and apoptosis is intrinsic in the models used to study them, thus involving chemicals and toxins, which likely unspecifically affect multiple cellular functions. However, a model of physiological apoptosis where mitochondria have been shown to be essential exists: the so‐called activation‐induced cell death (AICD) of T lymphocytes.
Development, activation, expansion and death of T cells are tightly regulated processes to balance an effective immune response with the avoidance of autoimmunity. Apoptosis occurs so as to establish immune tolerance in the thymus by removing autoreactive cells, or to provoke peripheral tolerance by deleting the expanded T‐cell clones after resolution of inflammation in the process of AICD (Smith et al, 1989; Shi et al, 1991; Dhein et al, 1995). Mechanistically, in AICD, signals generated by the TCR lead to CD95/FAS ligand (CD95/FASL) expression and autocrine activation (Latinis et al, 1997; Brenner et al, 2005), with the engagement of the caspase‐8‐dependent extrinsic pathway of cell death (Brunner et al, 1995; Dhein et al, 1995). Mitochondria participate at every stage of AICD. The kinase PKCθ‐ and DRP1‐dependent mitochondria‐derived ROS are necessary for CD95L expression and AICD (Villalba et al, 1999; Kaminski et al, 2007, 2012; Roth et al, 2014); caspase‐independent release of AIF from mitochondria is also crucial for AICD (Chhabra et al, 2006). Despite mounting evidence for a role of mitochondrial dynamics in other T‐cell functions, such as immune synapse establishment and migration (Campello et al, 2006; Contento et al, 2010), how the organelle shaping is involved in AICD is still not completely understood. A simple prediction would be that they do not fragment, so that they could be spared from mitophagy ultimately enabling them to supply the molecules required for apoptosis progression. However, DRP1‐dependent mitochondrial fission has been shown to support AICD by ROS production (Roth et al, 2014).
Here, we set out to investigate whether and how mitochondria, mitophagy and autophagy crosstalk in AICD, a physiological form of cell death. Our results indicate that an early and massive fragmentation of mitochondria is counterbalanced not by the expected and specific inhibition of selective mitophagy, but by a generalized blockage in autophagy. If this block is released, mitochondria are eliminated and the apoptotic circuitry is interrupted. Thus, in a physiological cell death setting, to ensure apoptosis, macroautophagy needs to be inhibited.
Results
TCR reactivation causes mitochondrial fragmentation and cristae remodelling
Upon AICD induction in human peripheral blood T (hPB T) cells, cell death started ~30 min (Fig 1A) and it reached a plateau soon after. The 40% of cells still alive after 32–48 h most likely represent subpopulations of hPB T cells differentially sensitive to AICD (Krammer et al, 2007; Julia et al, 2009). Indeed, TCR restimulation killed, albeit more slowly, the totality of clonal Jurkat cells, a T‐cell line phenotypically comparable to pre‐activated and expanded lymphocytes, and widely used in AICD studies (Fig 1B) (Dhein et al, 1995). We therefore monitored mitochondrial morphology around or before the time of cell death in primary T (30 min) and Jurkat (24 h) cells. The elongated mitochondrial network, clearly visible in resting cells, underwent massive fragmentation (Fig 1C–F). Interestingly, the fragmentation appeared before the onset of cell death (starting around 16 h after TCR engagement in Jurkat, not shown), thus being at variance with what has been observed in other models of apoptosis (Frank et al, 2001). Notably, mitochondrial fragmentation was accompanied by ultrastructural rearrangements, as demonstrated by transmission electron microscopy (EM) analysis. Indeed, AICD stimulation induced cristae remodelling, with increased cristae maximal width in treated cells compared to the tight structures observed in control hPB T and Jurkat cells (Fig 1G and H). In addition, matrix of hPB T cells undergoing AICD was electron dense, likely mirroring a different metabolic state of their mitochondria during apoptosis (Fig 1G). A co‐localization analysis also confirmed that cytochrome c release accompanied the observed mitochondrial fragmentation (Fig 1I–L). In summary, mitochondrial fragmentation and cristae remodelling correlate with cytochrome c release during AICD.
Figure 1. TCR activation results in mitochondrial fragmentation and cristae remodelling in T cells.
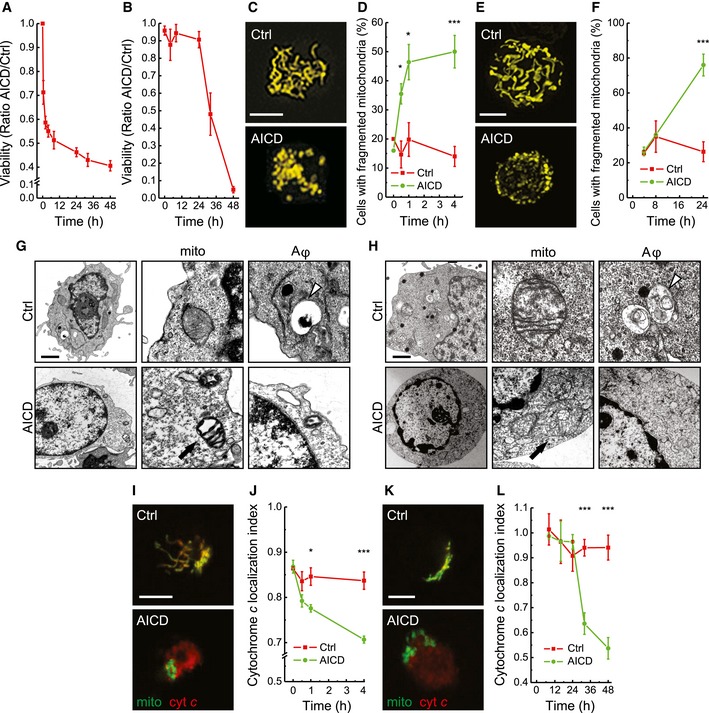
- AICD was induced in hPB T as described in Materials and Methods. Apoptotic cells were detected at the indicated times after AICD induction by flow cytometry as Annexin‐V/PI double‐positive cells and the ratio between AICD and Ctrl values obtained are shown. Data represent mean ± SE of six independent experiments.
- AICD was induced in Jurkat cells as described in Materials and Methods. Apoptotic cells were detected as in (A). Data represent mean ± SE of five independent experiments.
- hPB Ts were transfected with mtYFP, and after 24 h, AICD was induced. Representative reconstructions of confocal z‐stacks of the mtYFP fluorescence 30 min after AICD induction are shown. Scale bar, 5 μm.
- Morphometric analysis of mitochondrial shape of cells treated as in (B). Data represent mean ± SE of five independent experiments (n = 30 cells per condition in each experiment).
- Jurkat cells were transfected with mtYFP, and 24 h after AICD induction, cells were fixed. Representative reconstructions of confocal z‐stacks of the mtYFP fluorescence 24 h after AICD induction are shown. Scale bar, 5 μm.
- Morphometric analysis of mitochondrial shape in cells treated as in (E) is shown. Data represent mean ± SE of five independent experiments (n = 30 cells per condition in each experiment).
- Representative electron micrographs of hPB T treated as indicated; 30 min after AICD induction, cells were fixed and processed for electron microscopy. Scale bar, 2 μm.
- Twenty‐four hours after AICD induction, Jurkat cells were fixed and processed for electron microscopy. Representative electron micrographs of cells treated as indicated are shown. In EM images, white arrowheads point to autophagic vesicles (late autophagosomes or most likely autophagolysosomes, Aφ); black arrows point to mitochondria (mito) with remodelled cristae, specifically touching a representative disorganized crista. Scale bar, 2 μm.
- Representative confocal images of hPB T transfected with mtYFP, fixed 30 min after AICD induction and immunostained with an anti‐cytochrome c antibody (red). Scale bar, 5 μm.
- Cytochrome c localization index was calculated from 30 randomly selected cells treated as in (I). Data represent mean ± SE of three independent experiments.
- Representative confocal images of Jurkat cells transfected with mtYFP, fixed at 32 h after AICD induction and immunostained with an anti‐cytochrome c antibody. Scale bar, 5 μm.
- Cytochrome c localization index was calculated from 30 randomly selected images per condition. Data represent mean ± SE of five independent experiments.
Inhibition of cristae remodelling protects from AICD
In order to characterize the molecular mechanisms behind mitochondrial fragmentation and cristae remodelling, we addressed whether levels of the mitochondria‐shaping proteins changed during AICD. Long OPA1 forms were processed and DRP1 levels were slightly increased, while the other mitochondria‐shaping proteins remained unaffected (Fig 2A), suggesting a role for OPA1 and DRP1 in AICD. Indeed, when we overexpressed MFN1, MFN2, a dominant‐negative mutant of DRP1 (DRP1K38A) and OPA1 in Jurkat cells, we found that only DRP1K38A and OPA1 were able to protect from AICD (Fig 2B), similar to what observed in other cell death models (Frank et al, 2001; Frezza et al, 2006; Cassidy‐Stone et al, 2008). DRP1K38A and OPA1 overexpression inhibited mitochondrial fragmentation (Fig 2C and D), cristae remodelling (Fig 2E and F) and cytochrome c release (Fig 2G and H). Conversely, MFN1 overexpression, which was unable to protect from AICD, counteracted mitochondrial fragmentation but had no effect on cristae disorganization and cytochrome c release (unpublished data, from M. Corrado and S. Campello). Mechanistically, we could correlate AICD‐associated mitochondrial fragmentation to calcineurin‐dependent DRP1 translocation to mitochondria (Cereghetti et al, 2008). Indeed, when we buffered intracellular Ca2+ using the calcium chelator BAPTA to counteract the early rise in intracellular Ca2+ concentration following TCR engagement (Quintana et al, 2005; Srikanth & Gwack, 2013), mitochondrial fragmentation, as well as cell death, was inhibited (Fig EV1A–C). Moreover, genetic inhibition of calcineurin (∆CnAH151Q) or of DRP1 translocation (DRP1S637D) recapitulated these data (Fig EV1D–F), demonstrating that calcium‐dependent modulation of mitochondrial fragmentation and cristae structure amplifies AICD. In sum, our data indicate that mitochondrial cristae remodelling is a crucial aspect for AICD progression.
Figure 2. AICD depends on mitochondrial fragmentation and cristae remodelling which are rescued by DRP1K38A and OPA1.
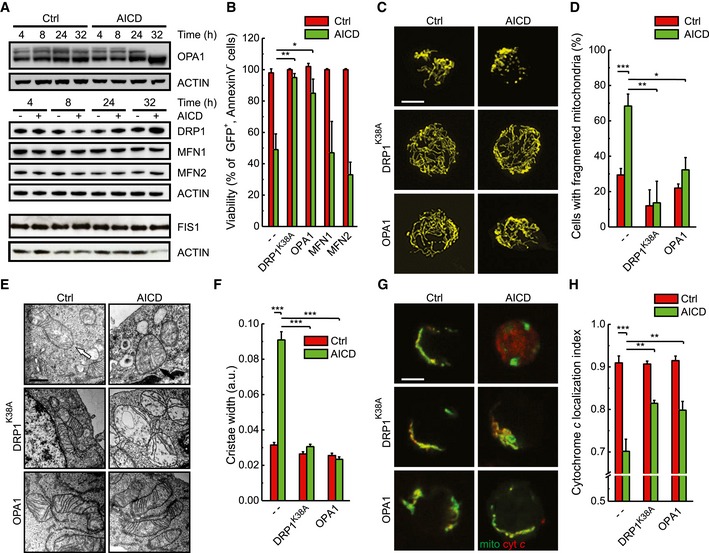
- Protein samples (20 μg) from Jurkat cells treated as indicated were separated by SDS–PAGE and immunoblotted with the indicated antibodies. WBs are representative of at least three independent experiments.
- Jurkat cells were transfected with pE‐GFP and the indicated plasmids; 32 h after AICD induction, viability was determined cytofluorimetrically as the percentage of GFP‐positive, Annexin‐V‐PE‐negative cells. Data represent mean ± SE of five independent experiments.
- Jurkat cells were transfected as indicated. Representative reconstructions of confocal z‐stacks of the mtYFP fluorescence 24 h after AICD induction are shown. Scale bar, 5 μm.
- Morphometric analysis of mitochondrial shape of cells transfected as in (C) is shown. Data represent mean ± SE of five independent experiments (n = 30 cells per condition in each experiment).
- AICD was induced in Jurkat cells overexpressing pE‐GFP and the indicated plasmids and sorted for GFP‐positive fluorescence; 24 h after AICD induction, cells were fixed and processed for electron microscopy. Representative electron micrographs of randomly selected mitochondria from cells treated as indicated are shown. White arrow points to tight cristae structure, and black arrow points to remodelled cristae and to a swollen cristae junction. Scale bar, 0.2 μm.
- Morphometric analysis of cristae width in cells transfected as in (E). Data represent mean ± SE of three independent experiments (n = 30 cells per condition in each experiment).
- Representative confocal images of cells transfected as indicated, fixed 32 h after AICD induction and immunostained with an anti‐cytochrome c antibody (red). Scale bar, 5 μm.
- Cytochrome c localization index was calculated from 30 randomly selected cells (per condition) transfected as in (G). Data represent mean ± SE of five independent experiments.
Figure EV1. Ca2+–calcineurin regulate mitochondrial fragmentation and AICD modulation through DRP1.
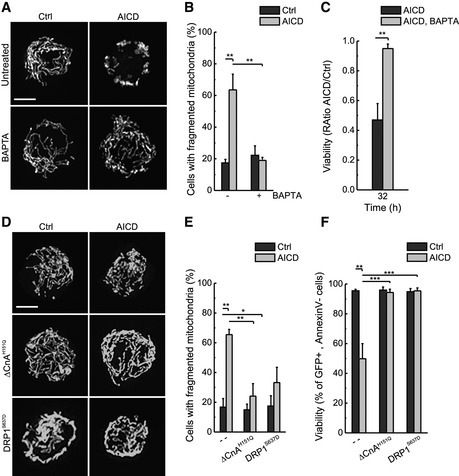
- Jurkat cells were transfected with mtYFP and pre‐treated with BAPTA‐AM before inducing AICD. Representative reconstructions of confocal z‐stacks of the mtYFP fluorescence 24 h after AICD induction are shown. Scale bar, 5 μm.
- Morphometric analysis of mitochondrial shape of cells treated as in (A) is shown. Data represent mean ± SE of three independent experiments (n = 30 cells per condition in each experiment).
- AICD and BAPTA pre‐treatment were performed as previously described. Viability was determined cytofluorimetrically as Annexin‐V/PI double‐negative cells. Data represent mean ± SE of three independent experiments.
- Jurkat cells were co‐transfected with mtYFP or mtRFP, the dominant‐negative form of calmodulin (DCnAH151Q) or the mutant form of DRP1 (DRP1S637D). Representative reconstructions of confocal z‐stacks of the mtYFP or mtRFP fluorescence 24 h after AICD induction are shown.
- Morphometric analysis of mitochondrial shape of cells transfected as in (D) is shown. Data represent mean ± SE of three independent experiments (n = 30 cells per condition in each experiment).
- Jurkat cells were transfected as indicated and 32 h after AICD induction viability was determined cytofluorimetrically. Data represent mean ± SE of three independent experiments.
TCR activation actively inhibits autophagy
Our data raise the question of why the fragmented, dysfunctional mitochondria of AICD‐primed cells are not targeted to mitophagy and sustain cytochrome c release. We therefore decided to verify whether the mitophagic and autophagic machineries were competent upon AICD. When we went back to our ultrastructural analysis of primary cells undergoing AICD, we noticed that autophagic structures disappeared after TCR reactivation (Fig 1G and H). Conversely, translocation of Parkin, a ubiquitin E3 ligase whose mitochondrial translocation is required for their degradation through selective mitophagy, to fragmented and remodelled Jurkat mitochondria upon AICD was normal (Fig 3A and B, and Appendix Fig S1A). However, the capacity of LC3 to be recruited and co‐localize with Parkin to mitochondria during AICD was reduced (see Fig 3A and C). Indeed, an impaired autophagy in hPB T cells was further substantiated, on time course, by the finding that as early as 30 min upon AICD induction LC3‐Cherry‐positive puncta, indicative of active autophagy (Klionsky et al, 2012), were absent in the population of dying cells (Fig 3D and E, and Appendix Fig S1B). In Jurkat cells, GFP‐LC3 relocalization as well as processing was similarly inhibited in the early stages of AICD, even before mitochondria fragmentation (Fig 3F–H). Notably, knocking down Parkin increased cell sensibility to AICD (Fig EV2A) by increasing mitochondrial depolarization and decreasing the total and the long OPA1 form levels (Fig EV2B–E). The latter observations indicate that, in resting—non‐AICD‐stimulated—conditions, a basal turnover of mitochondria is assured by Parkin in Jurkat cells, confirming that subpopulations of polarized and depolarized mitochondria coexist within the cells (see also Fig EV5E upper left panel) and that basal clearance of depolarized organelles is functional to maintain cell survival (Twig & Shirihai, 2011). Our results show that during AICD the pathways responsible for Parkin translocation to mitochondria are functional and activated, but bulk autophagy is early inhibited, thereby impeding the progression of mitophagy and so allowing the accumulation of dysfunctional, fragmented mitochondria that can sustain cytochrome c release.
Figure 3. TCR activation results in early inhibition of autophagy.
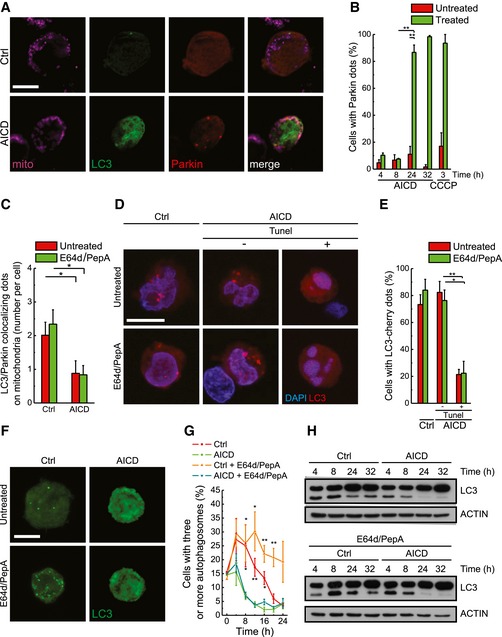
- Representative confocal images of cells transfected with GFP‐LC3 and Parkin‐Cherry, treated as indicated, fixed 24 h after AICD induction and immunostained with anti‐TOM20 antibody are shown. Scale bar, 5 μm.
- Statistical analysis of Parkin localization in cells subjected to AICD or to 10 μM CCCP for the indicated times is shown. Data represent mean ± SE of three independent experiments (n = 30 cells per condition in each experiment).
- Cells were treated as in (A). Where indicated, lysosomal protease inhibitors E64D and PepA were added. LC3‐Parkin‐mitochondria co‐localization was calculated from 30 randomly selected cells per condition. Data represent mean ± SE of three independent experiments.
- hPB T cells were transfected with LC3‐Cherry and treated as indicated; 30 min after AICD induction, cells were fixed and stained with TUNEL and DAPI. Representative reconstructions of confocal z‐stacks of the LC3‐Cherry fluorescence and single stacks for DAPI are shown. Scale bar, 5 μm.
- Statistical analysis of the autophagy in cells treated as in (D) is shown. Data represent mean ± SE of three independent experiments (n = 20 cells per condition in each experiment).
- Jurkat cells were transfected with GFP‐LC3 and treated as indicated. Representative reconstructions of confocal z‐stacks of the GFP‐LC3 fluorescence 16 h after AICD induction are shown. Scale bar, 5 μm.
- Statistical analysis of the autophagic flux in cells treated as in (F) is shown. Data represent mean ± SE of three independent experiments (n = 30 cells per condition in each experiment).
- Protein samples (20 μg) from Jurkat cells treated as indicated were separated by SDS–PAGE and immunoblotted with the indicated antibodies. Where indicated, lysosomal protease inhibitors E64D and PepA were added. WBs are representative of at least three independent experiments.
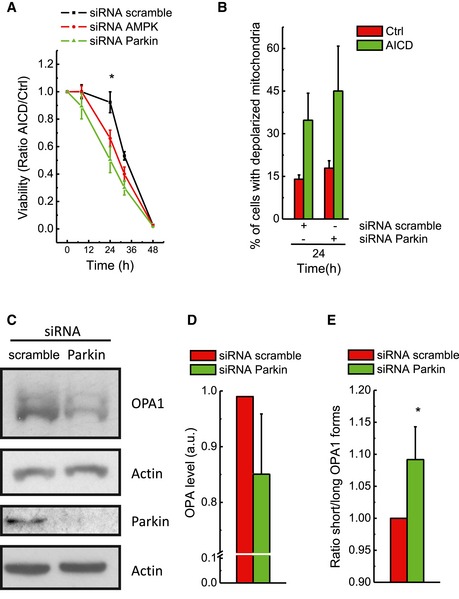
Figure EV2. Parkin knock‐down‐dependent detrimental effect on AICD depends on increased depolarization of mitochondria and OPA1 long to short forms' conversion.
-
AJurkat cells were transfected with scramble, AMPK or Parkin siRNA 24 h before AICD induction. Viability was determined cytofluorimetrically as Annexin‐V/PI double‐negative cells. Data represent mean ± SE of three independent experiments.
-
BMitochondrial depolarization upon AICD induction was analysed as indicated in cells transfected with scramble and Parkin siRNA. Data represent mean ± SE of three independent experiments.
-
CJurkat cells were transfected as in (B); 24 h after transfection, protein samples (20 μg) were separated by SDS–PAGE and immunoblotted with the indicated antibodies. WBs are representative of at least four independent experiments.
-
D, EJurkat cells were transfected as in (B). OPA1 total level and the ratio between short and long OPA1 isoforms are shown. Data represent mean ± SE of four independent experiments.
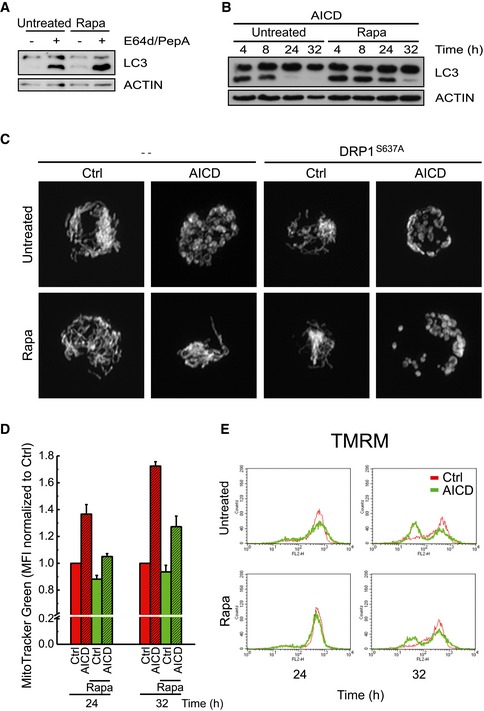
Figure EV5. Rapamycin induces autophagy in activated hPB T and Jurkat cells and reduces the number of cells with depolarized mitochondria.
-
AActivated hPB T cells were pre‐treated with 100 nM rapamycin before protein samples were prepared. Protein samples (20 μg) from cells treated as described were separated by SDS–PAGE and immunoblotted with the indicated antibodies.
-
BJurkat cells were treated with 100 nM rapamycin during AICD. Protein samples (20 μg) from cells treated as described were separated by SDS–PAGE and immunoblotted with the indicated antibodies.
-
CJurkat cells were co‐transfected with mtRFP and the mutant form of DRP1 (DRP1S637A) and treated as indicated. Representative reconstructions of confocal z‐stacks of the mtRFP fluorescence 24 h after AICD induction are shown.
-
D, EAICD induction and rapamycin treatment were carried out as previously described, except that at the indicated times cells were incubated with 100 nM MitoTracker Green (D) or 2 nM TMRM (E). MitoTracker Green and TMRM fluorescence changes were analysed cytofluorimetrically. Mean fluorescent intensity of MitoTracker Green (D), and images of TMRM‐stained (E) Jurkat cells are shown. Data represent mean ± SE of three independent experiments.
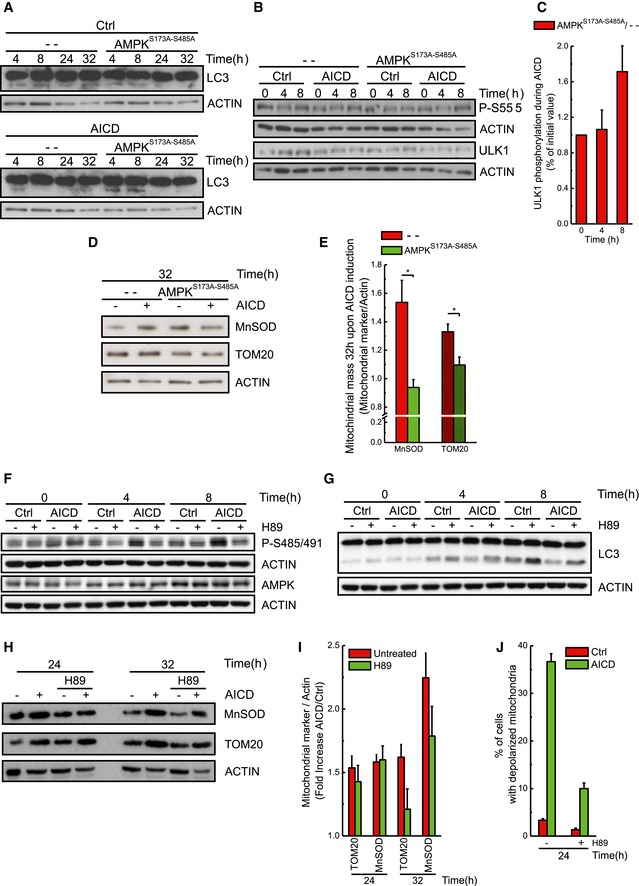
PKA activation signals autophagy inhibition upon AICD induction
Upon TCR engagement, the pleiotropic protein kinase‐A (PKA) known to specifically target several autophagy players (Stephan et al, 2009) is activated (Mosenden & Tasken, 2011). Among those players lies AMPK, a central autophagy regulator acting via a complex crosstalk with other autophagic factors (Egan et al, 2011). PKA phosphorylates AMPK on Ser485/491, counteracting its pro‐autophagic phosphorylation on Thr172 (Hurley et al, 2006), and therefore inhibiting autophagy (Pulinilkunnil et al, 2011). Moreover, in adipocytes, AMPK was shown to be specifically phosphorylated by PKA on two other serines together with Ser485/491: Ser173 and Ser497—the additional phosphorylation on Ser173 being crucial for the inhibitory effect on Thr172, and thus for AMPK activity (Djouder et al, 2010). Interestingly, upon AICD induction we observed increased phosphorylation of AMPK Ser485/491 and Ser173, while Thr172 phosphorylation levels were unchanged, suggesting a PKA‐mediated inhibition of AMPK (Figs 4A and B, and EV3A and B). We further verified whether AMPK activity was inhibited during AICD by checking the AMPK‐dependent phosphorylation of its downstream target ULK1 on Ser555. ULK1‐relative phosphorylation diminished concomitantly with the inhibitory AMPK phosphorylation early upon TCR restimulation (Fig EV3C and D), as eventually did the ULK1‐dependent Ser318 phosphorylation of ATG13 (Fig EV3E and F). A long‐term adaptation to medium condition could explain the reduction in ULK1 phosphorylation at late time points, also in control conditions. Nonetheless, this adaptation happens when the inhibition of autophagy is already established. Moreover, the difference observed in ULK1, at late time points, is not paralleled by a difference in the phosphorylation status of the downstream effector and direct ULK1‐substrate ATG13, in control conditions (Fig EV3E and F). Besides AMPK, autophagy is also regulated by the mammalian target of rapamycin (mTOR). A complex regulatory phosphorylation network among mTOR, AMPK and the downstream autophagic effectors is known (Alers et al, 2012). With this premise, we also analysed the phosphorylation status of mTOR during AICD, and it remained unchanged (Fig EV3G and H), suggesting that the mTOR kinase does not play a central role in TCR‐dependent autophagy inhibition.
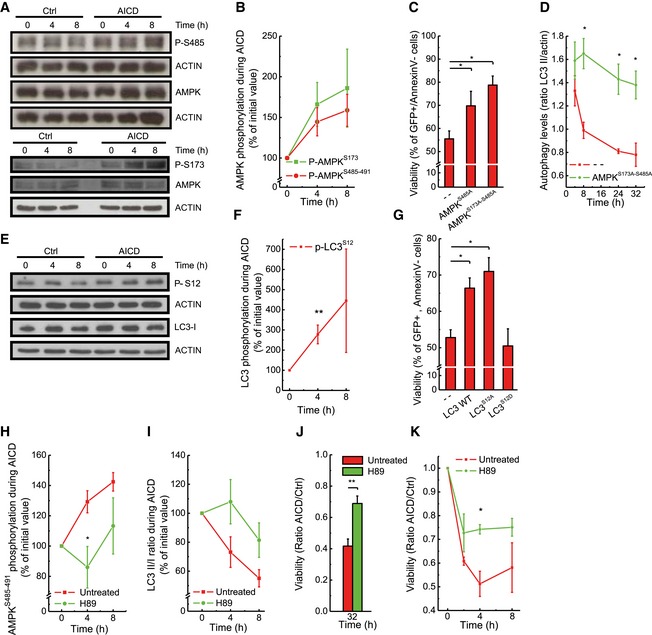
Figure 4. Autophagy is inhibited upon AICD induction through PKA activation.
-
A, BProtein samples (20 μg) from Jurkat cells treated as indicated were separated by SDS–PAGE and immunoblotted with the indicated antibodies. Wb are representative of at least four independent experiments. Levels of proteins and phosphorylation status of AMPK were quantified and analysed as shown. In these panels, “Time” stands for time (hours) after AICD treatment and indicates at which time upon AICD induction samples have been collected.
-
CJurkat cells were transfected with the indicated plasmids; 32 h after AICD induction, viability was determined cytofluorimetrically as the percentage of GFP‐positive, Annexin‐V‐PE‐negative cells. Data represent mean ± SE of three independent experiments.
-
DProtein samples from Jurkat cells overexpressing empty vector or AMPKS173A‐S485A were immunoblotted for LC3 and LC3‐II/actin ratio was quantified and analysed as shown. Data represent mean ± SE of three independent experiments.
-
E, FProtein samples (20 μg) from Jurkat cells treated as indicated were separated by SDS–PAGE and immunoblotted with the indicated antibodies. WBs are representative of at least three independent experiments. Levels of proteins and phosphorylation status of LC3 were quantified and analysed as shown.
-
GJurkat cells were transfected with the indicated plasmids; 32 h after AICD induction, viability was determined cytofluorimetrically as in (C). Data represent mean ± SE of three independent experiments.
-
H, ICells were treated as in (A), and where indicated, 10 μM H89 was added. Quantitative analysis of P‐AMPK Ser485‐491 phosphorylation (H) and of LC3‐II/LC3‐I ratio (I) during AICD is shown. Data represent mean ± SE of four independent experiments.
-
J, KAICD was induced in Jurkat cells (J) and in hPB T (K) in the presence of 10 μM H89. At the indicated time points (hours) after AICD induction, apoptotic cells were detected by flow cytometry as Annexin‐V/PI double‐positive cells and the ratio between AICD and Ctrl values obtained is shown. Data represent mean ± SE of three independent experiments.
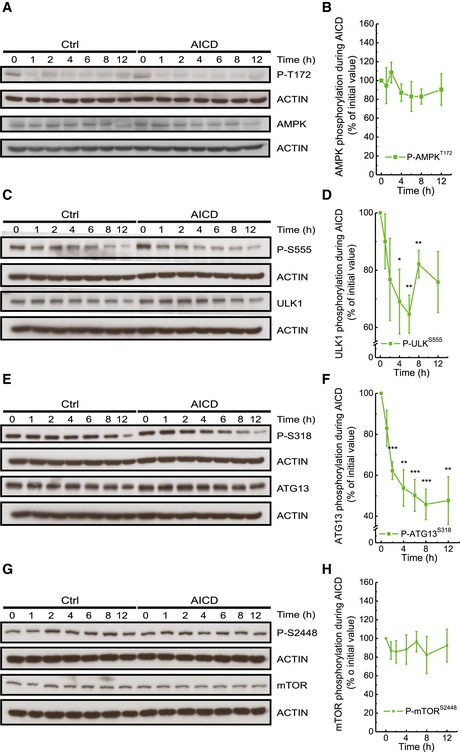
Figure EV3. AMPK inhibition leads to inactivation of its downstream autophagic effectors ULK1 and ATG13.
-
A–HProtein samples (20 μg) from Jurkat cells treated as indicated were separated by SDS–PAGE and immunoblotted with the indicated antibodies. WBs are representative of at least four independent experiments. Levels of proteins and phosphorylation status of AMPK (P‐T172) (A, B), ULK1 (P‐S555) (C, D), ATG13 (P‐S318) (E, F) and mTOR (P‐S2448) (G, H) were quantified and analysed as shown. Signals referring to both phosphorylated and total proteins have been normalized to actin before being compared, to normalize for loading errors during the WBs. Data represent mean ± SE of four independent experiments.
Given that PKA‐mediated phosphorylation inhibits AMPK during AICD, we decided to verify whether AICD was effective in cells overexpressing specific phospho‐silencing mutants only on Ser485/491 (S485/491A) or on both Ser485/491 and Ser173 (S173A‐S485/491A). While the single mutant S485/491A partially inhibited AICD, the double S173A‐S485/491A mutant showed a stronger inhibitory effect on apoptosis progression (Fig 4C), through restoration of AMPK pro‐autophagic activity, as confirmed by the analysis of LC3 processing and AMPK‐dependent ULK1 phosphorylation (Figs 4D and EV4A–C). Moreover, the double mutant consequently reduced the mitochondrial markers accumulation (Fig EV4D and E). Conversely, AMPK silencing in Jurkat cells significantly accelerated AICD (Fig EV2A). In sum, our data indicate that the PKA–AMPK axis downstream of the TCR modulates autophagy inhibition during AICD.
Figure EV4. Inhibition of PKA results in reduced AMPKS485/491 phosphorylation and increased LC3‐I/LC3‐II conversion.
-
A–CProtein samples (20 μg) from Jurkat cells overexpressing empty vector or AMPKS173A‐S485A were subjected to AICD. At the indicated time points, protein samples were prepared and immunoblotted with the indicated antibodies. (A) LC3‐I/LC3‐II conversion during AICD is shown. (B‐C) Levels of proteins and phosphorylation status of ULK1 (P‐S555) were quantified and analysed as shown. Data represent mean ± SE of three independent experiments.
-
D, ELevels of mitochondrial markers and quantitative analysis of the ratio between the protein levels of mitochondrial markers and actin during AICD are shown. Data represent mean ± SE of four independent experiments.
-
F, GJurkat cells were subjected to AICD and, where indicated, 10 μM H89 was added. At selected times, protein samples (20 μg) were separated by SDS–PAGE and immunoblotted with the indicated antibodies. Phosphorylation status of AMPKS485/491 and LC3‐I/LC3‐II conversion during AICD in the presence of 10 μM H89 is shown. WBs are representative of at least four independent experiments.
-
HProtein samples (20 μg) from Jurkat cells treated as indicated were separated by SDS–PAGE and immunoblotted with the indicated antibodies. WBs are representative of at least three independent experiments.
-
IQuantitative analysis of the ratio between the protein levels of mitochondrial markers and actin during AICD is shown. Data represent mean ± SE of three independent experiments.
-
JMitochondrial depolarization upon AICD induction was analysed in cells treated as indicated. Data represent mean ± SE of three independent experiments.
PKA also controls the activity of the autophagic key player LC3 by phosphorylating its Ser12, a post‐translational modification that inhibits LC3 processing and ultimately blocks autophagy (Cherra et al, 2010). Interestingly, Ser12 LC3 phosphorylation also increased during AICD (Fig 4E and F) and the expression of a wild type, as well as of the non‐phosphorylable S12A LC3 mutant, protected Jurkat cells from AICD (Fig 4F and G) at variance with its phospho‐mimetic LC3‐S12D mutant form, whose transfection does not alter cell viability (Fig 4G). Thus, upon TCR engagement, PKA inhibits autophagy also via the direct regulation of LC3 activation.
We finally wished to test the upstream role of PKA in AICD‐induced autophagy inhibition. When PKA was pharmacologically inhibited during AICD, AMPK Ser485/491 phosphorylation was reduced (Figs 4H and EV4F), autophagy inhibition was delayed and LC3 activation was increased—although not significantly (Figs 4I and EV4G). The reactivation of autophagy leads, ultimately, to reduction in cell death (Fig 4J), also in primary T cells (Fig 4K), through the removal of damaged mitochondria as indicated by the reduction in mitochondrial marker accumulation and of depolarized mitochondria upon PKA pharmacological inhibition (Fig EV4H–J). In sum, our results indicate that PKA inhibits ULK1‐mediated autophagy, responsible for the clearance of the dysfunctional mitochondria, through a double action on AMPK and LC3.
Pharmacological autophagy induction removes damaged mitochondria and inhibits AICD
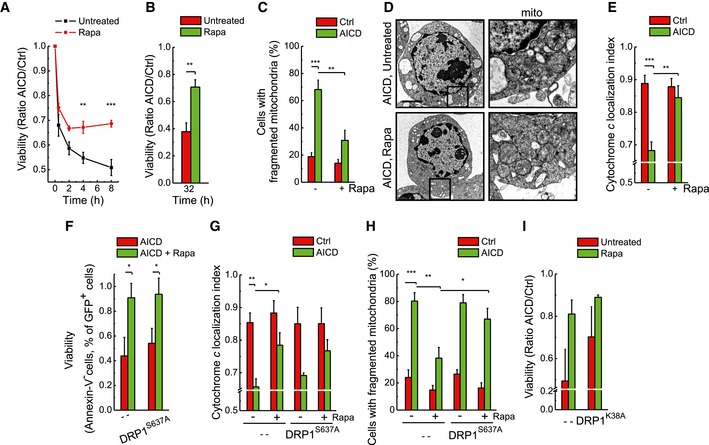
We next reasoned that if autophagy (and not selective mitophagy) inhibition allowed AICD progression, its pharmacological induction would inhibit cell death. The mTOR inhibitor rapamycin, specifically chosen among the autophagy pharmacological inducers because it acts through a pathway alternative to the AMPK axis, was indeed effective in blunting AICD in hPB T cells (Fig 5A) and in Jurkat cells (Fig 5B) through autophagy restoration (Fig EV5A and B). Rapamycin not only—as expected—induced mitochondrial elongation (Gomes et al, 2011) (Fig 5C), but also recovered cristae structure (Fig 5D) and reduced cytochrome c release (Fig 5E).
Figure 5. Pharmacological induction of autophagy during AICD results in cell death inhibition independently from DRP1‐dependent mitochondrial shape changes.
-
AApoptotic cells were detected at the indicated time points after AICD induction in hPB T cells by flow cytometry as Annexin‐V/PI double‐positive cells. Where indicated, hPB T cells were pre‐incubated with 100 nM rapamycin for 24 h before AICD induction. Data represent mean ± SE of six independent experiments.
-
BAICD was induced in Jurkat cells, and where indicated, 100 nM rapamycin was added at time 0 h of AICD induction. Apoptotic cell death analysis was carried out as in (A), except that cells were analysed 32 h after AICD induction. Data represent mean ± SE of six independent experiments.
-
CMorphometric analysis of mitochondrial shape 24 h after AICD induction. Jurkat cells were transfected with mtYFP 24 h before AICD induction and, where indicated, 100 nM rapamycin was added. Data represent mean ± SE of four independent experiments (n = 30 cells per condition in each experiment).
-
DRepresentative electron micrographs of cells subjected to AICD untreated (upper panel) or treated with 100 nM rapamycin (lower panel); 24 h after AICD induction, cells were fixed and processed for electron microscopy, Scale bar, 2 μm.
-
EJurkat cells were transfected with mtYFP and treated as indicated; 32 h after AICD induction, cells were fixed and immunostained with an anti‐cytochrome c antibody. Cytochrome c localization index was calculated from 30 randomly selected images per condition. Data represent mean ± SE of four independent experiments.
-
FJurkat cells were transfected with DRP1S637A‐GFP; 24 h after transfection, AICD was induced. Thirty‐two hours after AICD induction viability was determined cytofluorimetrically as the percentage of GFP‐positive, Annexin‐V‐PE‐negative cells. Data represent mean ± SE of three independent experiments.
-
G, HJurkat cells were co‐transfected with mt‐RFP and the indicated plasmids; 32 h after AICD induction, cells were fixed and immunostained with an anti‐cytochrome c antibody. Cytochrome c localization index (G) and mitochondrial morphology (H) were calculated from 30 randomly selected images. Data represent mean ± SE of three independent experiments.
-
IJurkat cells were transfected with DRP1K38A; 24 h after transfection, AICD was induced. Thirty‐two hours after AICD induction, viability was determined cytofluorimetrically as the percentage Annexin‐V/PI double‐negative cells. Data represent mean ± SE of three independent experiments.
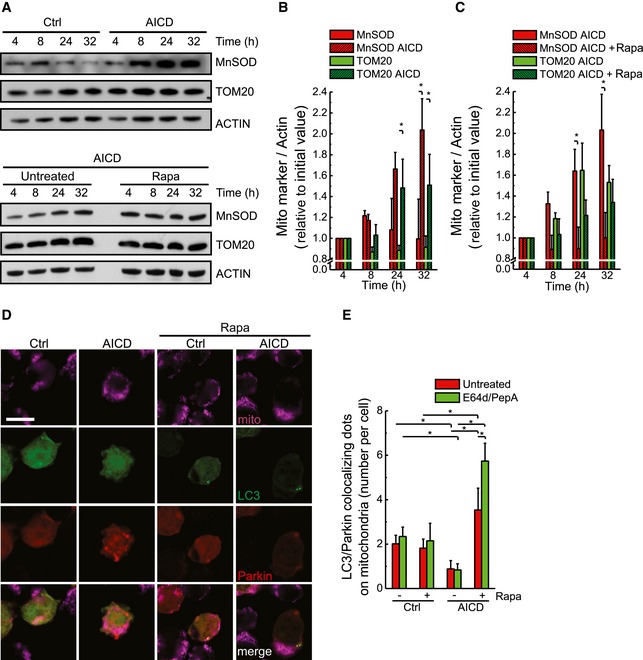
In principle, the amelioration of the mitochondrial population parameters by rapamycin could result from degrading the unhealthy, ultrastructurally and morphologically compromised mitochondria releasing cytochrome c, or by triggering DRP1‐dependent mitochondrial elongation (Gomes et al, 2011). Two sets of experiments let us lean towards the first hypothesis. First, rapamycin was also effective in inhibiting AICD (Fig 5F) and cytochrome c release (Fig 5G) in Jurkat cells expressing a DRP1 mutant (DRP1S637A) that cannot be phosphorylated and constitutively localizes on mitochondria, thus retaining fragmentation irrespective of autophagy induction (Figs 5H and EV5C). Moreover, the expression of the dominant‐negative DRP1K38A mutant was additive to rapamycin in reducing cell death (Fig 5I), suggesting that mitochondrial structural changes and autophagy inhibition are parallel pathways that amplify cell death upon AICD stimulation. Second, while autophagy physiological inhibition during AICD leads to mitochondrial accumulation, its reactivation by rapamycin allowed clearance of mitochondria (Figs 6A–C and EV5D). Notably, at a molecular level, MnSOD accumulation during AICD is higher compared to TOM20. This could be explained by the different mitochondrial sub‐localization of the two proteins examined. Indeed, TOM20 similar to other outer mitochondrial membrane proteins could be ubiquitylated and removed also via the proteasome. Eventually, autophagy restoration—by rapamycin treatment—was able to clear Parkin‐decorated mitochondria, as suggested by the increased co‐localization of Parkin and LC3 puncta on mitochondria during AICD in the presence of rapamycin (Fig 6D and E), favouring the purification towards a population of healthier, non‐depolarized mitochondria (Fig EV5E). Obviously, we cannot rule out that other relevant autophagy cargoes contribute to AICD regulation.
Figure 6. Pharmacological induction of autophagy during AICD removes dysfunctional mitochondria decorated by LC3 and Parkin.
-
AProtein samples (20 μg) from Jurkat cells treated as indicated were separated by SDS–PAGE and immunoblotted with the indicated antibodies. WBs are representative of at least three independent experiments.
-
B, CQuantitative analysis of the ratio between the protein levels of mitochondrial markers and actin during AICD is shown. Data represent mean ± SE of three independent experiments.
-
DJurkat cells were co‐transfected with GFP‐LC3 and Parkin‐Cherry; 32 h after AICD induction, cells were fixed and immunostained with an anti‐TOM20 antibody. Representative images for each condition are presented. Scale bar, 5 μm.
-
ELC3‐Parkin‐mitochondria co‐localization was calculated from 30 randomly selected images. Data represent mean ± SE of three independent experiments. Data referring to Ctrl and AICD‐stimulated cells without rapamycin correspond to the ones presented in Fig 3C.
Interestingly, mTOR‐independent reactivation of autophagy through PKA inhibition was also effective in reducing accumulation of mitochondria and mitochondrial depolarization during AICD (Fig EV4H–J). The expression of OPA1 and DRP1K38A did not seem, instead, to reduce mitochondrial mass during AICD (Appendix Fig S2A and B), confirming that amelioration of mitochondrial structure and function and removal of dysfunctional mitochondria are separated processes.
We can thus conclude that autophagy reactivation inhibits AICD by degrading damaged Parkin‐decorated mitochondria.
Autophagy limits AICD in vivo
Our in vitro results predict that autophagy, rather than selective mitophagy, is a core mechanism regulating the extent of AICD by controlling the mitochondrial units capable of cytochrome c release. If this model held true in vivo, AICD should be increased in mouse models of reduced autophagy. To test this hypothesis, we took advantage of two mouse models where autophagy is genetically impaired. In the first one, a single allele of Ambra1—a signalling protein‐activating autophagy via Beclin 1—is deleted, thus reducing the levels of basal autophagy and response to autophagic stimuli (Fimia et al, 2007; Vazquez et al, 2012; Cianfanelli et al, 2015). Of note, splenocytes isolated from 6‐month Ambra1 gt/+ mice were more sensitive to AICD than their wild‐type littermate T cells (Fig 7A). The second model that we used consists in an Atg7 flox/flox mouse, by which autophagy progression can be inactivated (Komatsu et al, 2005). T cells isolated from wild‐type and Atg7 flox/flox animals were infected with retroviral vectors expressing the CRE recombinase, thus resulting in the deletion of the ATG7 protein. Similar to the AMBRA1 model, also Atg7‐depleted cells were more sensitive to AICD, when compared to wild‐type counterparts (Fig 7B). Interestingly, in contrast to what observed in wt cells, rapamycin was not able to rescue Atg7‐deficient cells from AICD (Fig 7B). Knocking‐down ATG7 in Jurkat cells recapitulated the ex vivo data (Fig 7C). Moreover, rapamycin was able to reduce the number of cells with depolarized mitochondria and the accumulation of dysfunctional mitochondria during AICD only in wt T cells (Fig 7D–F).
Figure 7. Autophagy limits AICD in vivo .
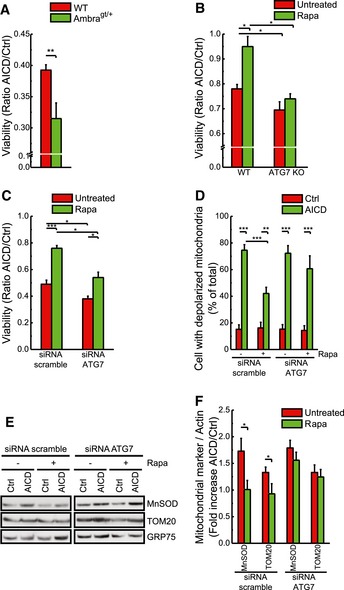
- Splenocytes were isolated from Ambragt/+ and wt C57BL/6 mice and activated as indicated in Materials and Methods. At day 7 after activation, AICD was induced with 0.1 μg/ml of plate‐bound anti‐mCD3 (clone 17A2). Apoptotic cells were detected 12 h after AICD induction by flow cytometry as Annexin‐V/PI double‐positive cells. Data represent mean ± SE. Experiments were performed with n = 3 animals per genotype.
- Splenocytes were isolated from ATG7fl/fl and wt C57BL/6 mice. Activation of splenocytes and AICD were performed as previously described. At day 5 after activation, cells were infected with retroviral constructs expressing CRE recombinase. Where indicated, cells were pre‐incubated with 100 nM rapamycin for 24 h before AICD induction. Apoptotic cells were detected 2 h after AICD induction by flow cytometry as Annexin‐V/PI double‐positive cells. Data represent mean ± SE. Experiments were performed with n = 3 animals per genotype.
- Jurkat cells were transfected with scramble or ATG7 siRNA 24 h before AICD induction. AICD was induced as described in Materials and Methods. Where indicated, 100 nM rapamycin was added at time 0 h of AICD induction. Apoptotic cell death analysis was carried out as in (A), except that cells were analysed 32 h after AICD induction. Data represent mean ± SE of five independent experiments.
- Mitochondrial depolarization upon AICD induction was analysed in cells treated as indicated. Data represent mean ± SE of five independent experiments.
- Protein samples (20 μg) from Jurkat cells treated as indicated were separated by SDS–PAGE and immunoblotted with the indicated antibodies. WBs are representative of three independent experiments.
- Quantitative analysis of the ratio between the protein levels of mitochondrial markers and GRP75 during AICD is shown. Data represent mean ± SE of three independent experiments.
Altogether, our data show that AICD is modulated by autophagy also in vivo and corroborate the pro‐survival role of autophagy in limiting AICD through the amelioration of mitochondrial phenotype.
Discussion
How mitochondrial morphology, mitophagy and macroautophagy crosstalk to define cell survival upon relevant forms of apoptosis is unclear. Our data demonstrate that macroautophagy rather than a selective mitophagy downregulation allows the progression of AICD (Fig 8). In particular, our data show that inhibition of autophagy precedes and allows the accumulation of fragmented and dysfunctional mitochondria, probably together with other organelles or bulk materials, which unopposedly release pro‐apoptotic factors, thus amplifying and effecting AICD (Fig 8).
Figure 8. Schematic representation of the mechanism underlying autophagy inhibition and amplification of cell death upon AICD induction.
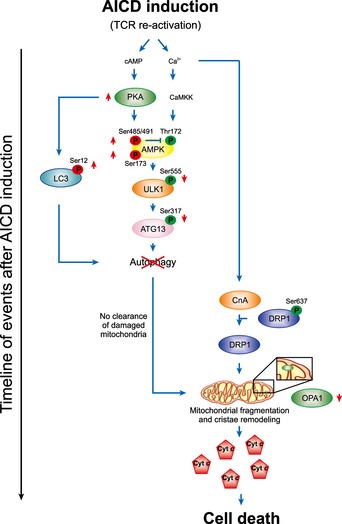
The diagram depicts the cascade of inhibition of autophagy and mitochondrial fragmentation triggered by restimulation of the T‐cell receptor during AICD. Early after AICD induction PKA activation induces inhibition of AMPK/ULK1‐dependent autophagy as well as a direct block of LC3. Subsequently, mitochondria fragment in a calcineurin‐/DRP1‐dependent manner. The lack of the removal of mitochondria results in accumulation of dysfunctional and damaged organelles releasing cytochrome c, thus amplifying cell death signals.
Further, our data indicate that AICD, a physiological death process modulating T‐cell homeostasis through reactivation of the T‐cell receptor, is characterized not only by mitochondrial fragmentation before the onset of apoptosis but also by cristae remodelling. Several other reports show that mitochondrial morphology and ultrastructure vary during apoptosis with DRP1‐dependent organelle fragmentation and OPA1‐dependent remodelling of the cristae, both controlling the rate and extent of cytochrome c release (Scorrano, 2009). The role of cristae remodelling, originally described in isolated mitochondria and intact cells (Scorrano et al, 2002), was observed only in models of intrinsic pharmacologically or artificially induced cell death (Yamaguchi et al, 2008; Landes et al, 2010). Indeed, our data provide the first evidence for cristae remodelling in a physiological relevant form of cell death, essential to define the immune response.
Mitochondria were already known to be involved in AICD progression: TCR engagement leads to cleavage of the pro‐apoptotic factor Bim, its translocation to the organelle being crucial for the induction of the intrinsic apoptotic pathway (Hughes et al, 2008; Snow et al, 2008). Moreover, recent findings point to an amplification feedback control in AICD, by which the apoptosome may induce cleavage of anti‐apoptotic factors, such as Bcl‐2 and Bcl‐XL (Guerrero et al, 2013). Finally, mitochondria are linked to AICD by the fact that mitochondrially produced reactive oxygen species are master regulators of this cell death, through Ca2+‐dependent modulation of CD95L transcription and expression, and hence induction of the extrinsic apoptotic pathway (Krammer et al, 2007; Roth et al, 2014). However, all these events take place and become crucial in late phases of AICD, representing an amplification and probable stabilization of the process. By contrast, we highlight here events that engage mitochondria during the early steps of AICD, when apparently the cell fate is already determined. Indeed, organelle fragmentation as well as cytochrome c release is detectable just a few minutes after TCR induction in T lymphocytes, before any possible transcriptional change and of course much earlier than apoptosome recruitment.
Given the deleterious effects of TCR reactivation, it comes with no surprise that the strength of TCR activation is tightly controlled at the level of TCR molecules (Holst et al, 2008). Our data suggest that autophagy emerges as a second line of defence against TCR re‐ensuing signals, a routine that is inhibited by the signal emanating from the receptor. Indeed, autophagy inhibition represents another important early response to TCR engagement. The catabolic process of autophagy, besides its key role as a cytosolic clearance system to prevent cell damage in basal condition, often represents an initial and effective cell response to a number of stress stimuli, ranging from hypoxia, to nutrient starvation or to DNA damage (Kroemer et al, 2010). This first autophagic “barrier” is able in many instances to slow down or stop the apoptotic process.
A number of key factors, often kinases, tightly regulate the autophagy onset or progression, by sensing the stimulus and activating or inhibiting the autophagy signalling network. Among the upstream autophagy signalling, molecules regulating this response are the master metabolic regulators AMPK and mTOR, the former having been identified very recently as a regulator of the effector T‐cell metabolic homeostasis (Blagih et al, 2015). Downstream, together with the key autophagosome‐shaping molecule LC3, the main targets of this regulation are the autophagy kinase ULK1 and its substrates Ambra1, ATG13 and FIP200 (Mizushima & Komatsu, 2011). Of note, even though many natural or synthetic compounds such as rapamycin or torin1 can induce autophagy, little is known about specific conditions or factors triggering autophagy downregulation in response to specific stimuli. Two examples are the two Beclin 1‐interacting proteins Rubicon and Bcl‐2, both of which impair the assembly and function of the autophagy nucleation complex (Zhong et al, 2009; He et al, 2012) and actively inhibit autophagy. Later on in the process, pro‐autophagic factors can be cleaved by caspases (e.g. Beclin 1, Ambra1 and Atg5) (Gordy & He, 2012; Pagliarini et al, 2012) to soften the autophagy response and unleash the apoptotic program. Our work identifies a molecular axis, involving AMPK, ULK1 and ATG13, that is early downregulated in the context of the TCR response, together with a direct inhibition of LC3 processing. These inhibitions both depend on PKA and slow down or even prevent the removal of damaged and fragmented mitochondria (Fig 7).
Our work contributes to dissect the role of mitophagy versus that of macroautophagy in apoptosis: macroautophagy inhibition instead of specific mitophagy inhibition prevents the mitochondria releasing cytochrome c to be cleared from cells committed to AICD. It will be interesting to investigate the differential role of mitophagy versus autophagy in the amplification of different forms of apoptosis and of cell death in general. The involvement of the macroautophagy upstream signalling network in AICD (see above) points to a faster protection from mitochondria removal, before mitochondrial damage could be signalled through specific mitophagy cargoes and translated into a specific activation of mitophagy. Also, downregulation of ULK1 function leads in general to a lack of activation of its downstream targets, including Ambra1 and Beclin 1. These factors are in part mitochondria resident, and Ambra1 has been postulated to be a key factor in Parkin recruitment to the organelles (Van Humbeeck et al, 2011). This would explain the urge in AICD signalling for a macroautophagy inhibition, thus preceding activation of Parkin (or other mitophagy cargoes) translocation and clearance of mitochondria. Not by chance, we observed that T cells from Ambra1‐deficient mice and Atg7‐deficient T cells are more sensitive to AICD. Second, in our experiments we pharmacologically rescued autophagy with rapamycin, often used as an immune suppressor. However, a dose‐dependent paradoxical effect of this drug has been recently demonstrated in primary T cells. At low doses, rapamycin increases the reactive lymphocyte population and decreases AICD in the inflammatory eye disease uveitis, through a mechanism still unclear to the authors (Zhang et al, 2012). We can hypothesize that rapamycin treatment actively protects the cells by removing damaged mitochondria and, in addition, by increasing the levels of anti‐apoptotic proteins (some of them, indeed, reside on mitochondria and are known regulators of autophagy). We could thus speculate that rapamycin treatment gives rise to a population of cells more resistant to AICD for which additional, or higher, TCR stimulation is probably necessary.
Moreover, our in vivo data in Ambra1‐deficient mice and Atg7‐deficient cells prompt us to speculate that, in cellular models of genetic ablation of autophagy, mitochondrial quality control could be compromised. This could result, in turn, in the accumulation over time of damaged mitochondria, thus contributing to cellular dysfunction and, at the organism level, to ageing or development of different pathologies. Finally, our results on autophagy inhibition in AICD may reveal a potential therapeutic strategy whenever AICD modulation is beneficial. For example, autoimmune diseases, such as type 1 diabetes mellitus, have been related to defects in central and peripheral tolerance, and thus to AICD (Gronski & Weinem, 2006) and AICD is a crucial pathogenic feature of other autoimmune diseases, such as multiple sclerosis (Waiczies et al, 2002; Julia et al, 2009).
Materials and Methods
Cells
Human PB T cells were sorted by negative selection using a RosetteSep kit (StemCell Technologies Inc.). Mouse spleens were harvested from Ambra1 +/gt (Fimia et al, 2007), wt C57BL/6 or ATG7 flox/flox (Komatsu et al, 2005) mice to isolate mouse splenocytes. Jurkat E6.1 and primary T cells were cultured in RPMI 1640 medium (GIBCO Life Technologies) supplemented with 10% FCS, 2 mM L‐glutamine, sodium pyruvate 1 mM (GIBCO Life Tecn.), non‐essential amino acids (GIBCO Life Tecn.), 100 U/ml penicillin and 100 μg/ml streptomycin. In addition, primary T‐cell medium was supplemented with 100 μg/ml gentamycin. Primary T cells were activated by PHA (Biochrom AG) 1.2 μg/ml for 16 h. After that, the cells were washed in PBS and resuspended in medium supplemented with IL‐2 (Roche) 25 U/ml for 6 days before being used for experiments at day 7. Every 48 h, after wash with PBS, new IL‐2 was added to the medium. Infections were performed at day 5 after activation. Blood from healthy donors was provided by the University Hospital (Hôpitaux Universitaires de Genève, Genève, Switzerland), which approved the use of donor blood for laboratory experiments and obtained informed consent from all subjects.
AICD induction and treatments
AICD was induced in human PB T cells by cross‐linking of the TCR complex with a mouse anti‐hCD3 antibody (OKT3 clone, eBioscience) 5 μg/ml, 30 min on ice, followed by incubation with biotin–anti‐mouse antibody, 1:50, at 37°C. For Jurkat cell activation, the anti‐hCD3 antibody used was 0.5 μg/ml, while in mouse splenocytes AICD was induced by coating 96‐well plates with anti‐mCD3 antibody (17A2 clone, eBioscience) 1 μg/ml. AICD was induced in cells cultured in RPMI 1640 medium, as described above, with the only difference that 1% FCS was supplemented. Eight hours after AICD induction, an isovolume of complete medium (10% FCS) was added. In the results paragraph, as well as in figures, time is intended as time upon AICD induction.
Where indicated, cells were incubated with the following: BAPTA‐AM (Invitrogen) (after 30 min of pre‐incubation with BAPTA‐AM 10 μM at 37°C in RPMI serum free, cells were washed and AICD was induced as detailed); H89 (Sigma) 10 μM and rapamycin (Sigma) 100 nM for the entire time of the experiment (in addition, hPB T cells were also pre‐incubated with rapamycin 100 nM 24 h before AICD induction); E64d (Sigma) and pepstatin A (Sigma) both 10 μg/ml for 2 h before lysis or fixation; CCCP (Sigma) 10 μM, MitoTracker Green (100 nM 1‐h incubation at 37°C).
Constructs and transfections
The empty pcDNA3.1 and pMSCV were obtained from BD‐Clontech. mtRFP, mtYFP, pE‐GFP, pMSCV‐OPA1, pCB6‐MYC‐MFN1 and pCB6‐MYC‐MFN2 plasmids were previously described (Cipolat et al, 2004). pcDNA3.1‐HA‐K38A‐DRP1 was from Dr. A van der Bliek (University of California, Los Angeles, CA). pLPCX‐GFP‐LC3 and pCLPCX‐mCherry‐LC3 were previously described (Fimia et al, 2007; Di Bartolomeo et al, 2010). pECFP‐C1‐GFP‐FLAG‐Parkin and the mCherry‐C1‐Parkin were gently provided by E. Ziviani. pcDNA 3.1/Zeo‐H151Q‐∆CnA, DRP1‐YFP‐S637A and DRP1‐YFP‐S637D were previously described (Cereghetti et al, 2008). pE‐GFP‐AMPK (S485/491A and S173A‐S485/491A) was generated by cloning AMPK cDNA into the KpnI–XhoI sites of pE‐GFP‐C2 (Clonetech). pE‐GFP‐LC3 (wt, S12D and S12A mutants) constructs were gently provided by Charleen T. Chu. pMSCV‐CRE was obtained from AddGene. siRNA oligoribonucleotides corresponding to the human AMPKα1, Parkin and Atg7 cDNAs were purchased from Ambion‐Life Technologies.
Transfections of Jurkat and hPB T cells were performed using Neon Transfection System (Invitrogen) according to manufacturer's guidelines. In co‐transfections, carrier versus plasmid of interest was used in 1:3 ratio. The specific combination of plasmids transfected in each experiment is indicated in the figure legends; 24–48 h after transfection, cells were used for experiments except for DRP1K38A: 30 μg of DNA was used for each transfection and cells were used 72 h after transfection.
Analysis of cell death
Cells treated as indicated for AICD induction were incubated with Annexin‐V‐FITC and propidium iodide (PI) (Bender MedSystem) according to the manufacturer's protocol. When cells were transfected with pE‐GFP, the incubation was done only with Annexin‐V‐PE (Bender MedSystem). Cell viability was measured by flow cytometry (FACSCalibur) as the percentage of Annexin‐V‐negative, PI‐negative cells or as the percentage of Annexin‐V‐negative events in the GFP‐positive population for untransfected and transfected cells, respectively.
Data are graphed as percentage of the initial value for comparative reasons.
Imaging
For confocal images, microscope slides were placed on the stage of a LSM510 Zeiss confocal imaging system using a Plan Apochromat 63× 1.4 Oil DIC objective or on a Nikon A1r microscope using a 40× CFI Plan APO VC 1.4 DT:0.13mm objective. Digital images were processed using the National Institutes of Health ImageJ 1.44o software.
For mitochondria morphometric analysis, stacks of images separated by 0.4 μm along the z‐axis were acquired. Then, three‐dimensional reconstruction of the mitochondrial stacks was performed with National Institutes of Health ImageJ 1.44o software. Images of single cells expressing mitochondrially targeted yellow‐ or red‐fluorescent protein (mtYFP or mtRFP) were thresholded as follows: after measurement of the major axis length, cells were scored with fragmented mitochondria when > 70% of the organelles displayed a major axis smaller than 2 μm for Jurkat cells and 1 μm for primary T cells. Image analysis was performed blind to the treatment conditions. The quantification was performed as calculation of the percentage of cells with each phenotype, after each experiment, and the related quantitative graphs show the average percentage ± SE.
For cytochrome c immunolocalization, cells were transfected with mtYFP and after 24 h AICD was induced as detailed. At the indicated times, immunostaining for cytochrome c was performed using a mouse anti‐cyt c antibody (BD Bioscience) and an anti‐mouse TRICT (Sigma). For mtYFP and cytochrome c detection, green and red channel images were acquired sequentially using two separate colour channels on the detector assembly of a LSM510 Zeiss confocal imaging system. The localization index was calculated as described in Petronilli et al (2001).
For LC3 localization analysis, cells were transfected with LC3‐GFP or mCherry‐LC3 and after 24 h AICD was induced as detailed. At the indicated time points, cells were fixed and stacks of images were acquired as described above. After z‐reconstruction, presence and number of LC3‐dots were analysed. GFP‐positive dots were counted on the images by using identical brightness and contrast settings. Then, the phenotypes classification was as follows: cells with more or < 3 autophagosomes, considering three autophagosomes as the threshold for autophagy positivity.
For the Parkin‐positive dot count, cells were co‐transfected with mtRFP and pECFP‐C1‐GFP‐FLAG‐Parkin, and after 24 h, AICD was induced as described. At the indicated time points, cells were fixed and stacks of images were acquired as described above. After z‐reconstruction of the stacks, the presence of Parkin dots was analysed.
For the study of LC3 and Parkin co‐localization in mitochondria, cells were transfected with mCherry‐C1‐Parkin and LC3‐GFP, and after 24 h, AICD was induced as described. At the indicated time points, cells were fixed and immunostained with TOM20 antibody. Stacks of images separated by 0.4 μm along the z‐axis were acquired in the three channels and localization was analysed as described.
For each experimental condition, at least 30 confocal single‐cell images were randomly chosen from different wells of the microscope slides.
Mitochondrial membrane potential measurements
The mitochondrial membrane potential of Jurkat cells was performed as previously described (Scorrano et al, 2003). In brief, 106 cells were resuspended in Krebs Ringer buffer (125 mM NaCl, 5 mM KCl, 1 mM Na2PO4, 1 mM MgSO4, 20 mM Hepes, pH 7.4) in the presence of 2 nM tetramethylrhodamine methyl ester (TMRM, Invitrogen) and 2 μM cyclosporin H (CsH, Alexis Biochemicals). After a 30‐min incubation at 37°C, TMRM fluorescence intensity was estimated by flow cytometry on a FACSCalibur before and after addition of 10 μM carbonyl cyanide 4‐(trifluoro‐methoxy)phenylhydrazone (CCCP, Sigma‐Aldrich) to the samples.
Transmission electron microscopy
Cells were fixed for 20 min at 25°C using glutaraldehyde at a final concentration of 2.5% (v/v) in PBS. Embedding and staining were performed as described in Scorrano et al (2002). Thin sections were imaged on a Tecnai‐20 electron microscope (Philips‐FEI).
Immunoblotting
Cell lysate preparation and immunoblotting assays were performed as described in Cipolat et al (2004). The following antibodies were employed: anti‐LC3 (Nanotools and Cell Signalling), anti‐P‐LC3 (Abgent), anti‐actin (Millipore), anti‐AMPK (Cell Signaling), anti‐P‐AMPK Ser485/491 (Cell Signaling), anti‐P‐AMPK Thr172 (Cell Signaling), anti‐P‐AMPK Ser173 (Abcam), anti‐ULK1 (Santa Cruz), anti‐P‐ULK1 Ser555 (Cell Signaling), anti‐ATG13 (Sigma), anti‐P‐ATG13 Ser317 (Rockland Immunochemicals), anti‐Catalase (Abcam), anti‐MnSOD (Assay Design), anti‐TOM20 (Santa Cruz), anti‐OPA1 (BD Bioscience), anti‐DRP1 (BD Bioscience), anti‐MFN1 (Santa Cruz), anti‐MFN2 (Abnova), anti‐FIS1 (Alexis). Densitometric quantification of Western blot was performed using the National Institutes of Health ImageJ 1.44o software. The intensity comparison between AICD‐treated and untreated cells, at different time points, was made from the same Western blot. In the signalling pathway experiments, the comparison between total and phosphorylated levels of each protein was performed from two different blots developed in parallel, after the due normalization to actin levels.
Statistical analysis
For all experiments shown, n is indicated in the figure legends. All data are expressed as means ± SE from at least three independent experiments unless specified otherwise (Microsoft Office Excel and Origin 7.0 Professional). Statistical significance was measured by an unpaired t‐test, and P‐values are specifically indicated in the figure legends.
Author contributions
MC did the majority of the experiments, wrote the paper, participated in the experimental conceiving and design and contributed to all data analyses; FRM contributed to the identification of the molecular pathway regulating autophagy by performing crucial experiments; LTr performed the majority of WBs that allowed the identification of the molecular pathway modulating autophagy inhibition; LTa performed the experiments related to Ca2+‐dependent modulation of mitochondria morphology; FN provided technical support for molecular biology, produced some key mutant constructs used on the molecular pathway identification and gave intellectual contribution also to critical revision of the paper; VC contributed materials and analysis tools, involved in interpretation, gave intellectual contribution also to critically reviewing of the paper and performed autophagy detection experiments on Ambra1 heterozygous mice, crucial on addressing some reviewers' concerns; MES helped with the mtDNA detection experiments crucial on addressing important reviewers' concerns; ES provided technical expertise and produced the material for viral infections; FC contributed with materials and expertise for the autophagy experiments, and for the data analysis. And also he gave an important intellectual contribution to critically revise the paper; LS contributed with materials and expertise for the mitochondrial dynamics part, analysis, elaboration, intellectual contribution, and critical revision of the paper; SC performed some experiments related to the mitochondria ultrastructure changes (including EM), designed and supervised the study and wrote the manuscript. All authors critically read and commented on the manuscript.
Conflict of interest
The authors declare that they have no conflict of interest.
Supporting information
Appendix
Expanded View Figures PDF
Review Process File
Source Data for Figure 2
Source Data for Figure 3
Source Data for Figure 4
Source Data for Figure 6
Source Data for Figure 7
Acknowledgements
We thank G.M. Fimia for kindly providing us with the GFP‐LC3 and LC3‐Cherry constructs, C.T. Chu for kindly providing us with the pE‐GFP‐LC3 wt, S12D and S12A constructs, M. Sandri for kindly providing us with some Atg7flox/flox mice and L. Battistini for technical help. LS is a senior scientist of the Dulbecco‐Telethon Institute. This work was funded by the European Commission 7th Framework Programme (FP7‐PEOPLE‐IEF‐2008 n. 235595), Italian Ministry of Health (GR‐2011‐02351643) and the AIRC Program MyFAG (MFAG‐12120) (to SC), the Swiss National Foundation (31‐118171), European Research Council, the European Commission 7th Framework Programme (CRISTOPA), Telethon Foundation (GGP12162, GGP15198, and TCR02016), the Italian Ministry of Health (GR 09.021) (to LS). FC Lab is supported by grants from KBVU (R72‐A4408), The Lundbeck Foundation (R167‐2013‐16100), The Novo Nordisk Foundation (7559), AIRC (IG2013), and in part from FISM 2013, Fondazione Telethon (GGP14202), the Italian Ministry of University and Research (FIRB Accordi di Programma 2011). FC Lab in Copenhagen is part of the newly established Center of Excellence in Autophagy, Recycling and Disease (CARd), funded by the Danish National Research Foundation.
The EMBO Journal (2016) 35: 1793–1809
References
- Alers S, Loffler AS, Wesselborg S, Stork B (2012) Role of AMPK‐mTOR‐Ulk1/2 in the regulation of autophagy: cross talk, shortcuts, and feedbacks. Mol Cell Biol 32: 2–11 [DOI] [PMC free article] [PubMed] [Google Scholar]
- Arnoult D, Grodet A, Lee YJ, Estaquier J, Blackstone C (2005) Release of OPA1 during apoptosis participates in the rapid and complete release of cytochrome c and subsequent mitochondrial fragmentation. J Biol Chem 280: 35742–35750 [DOI] [PubMed] [Google Scholar]
- Bereiter‐Hahn J, Voth M (1994) Dynamics of mitochondria in living cells: shape changes, dislocations, fusion, and fission of mitochondria. Microsc Res Tech 27: 198–219 [DOI] [PubMed] [Google Scholar]
- Blagih J, Coulombe F, Vincent EE, Dupuy F, Galicia‐Vazquez G, Yurchenko E, Raissi TC, van der Windt GJ, Viollet B, Pearce EL, Pelletier J, Piccirillo CA, Krawczyk CM, Divangahi M, Jones RG (2015) The energy sensor AMPK regulates T cell metabolic adaptation and effector responses in vivo . Immunity 42: 41–54 [DOI] [PubMed] [Google Scholar]
- Brenner D, Golks A, Kiefer F, Krammer PH, Arnold R (2005) Activation or suppression of NFkappaB by HPK1 determines sensitivity to activation‐induced cell death. EMBO J 24: 4279–4290 [DOI] [PMC free article] [PubMed] [Google Scholar]
- Brunner T, Mogil RJ, LaFace D, Yoo NJ, Mahboubi A, Echeverri F, Martin SJ, Force WR, Lynch DH, Ware CF, Green DR (1995) Cell‐autonomous Fas (CD95)/Fas‐ligand interaction mediates activation‐induced apoptosis in T‐cell hybridomas. Nature 373: 441–444 [DOI] [PubMed] [Google Scholar]
- Campello S, Lacalle RA, Bettella M, Manes S, Scorrano L, Viola A (2006) Orchestration of lymphocyte chemotaxis by mitochondrial dynamics. J Exp Med 203: 2879–2886 [DOI] [PMC free article] [PubMed] [Google Scholar]
- Cassidy‐Stone A, Chipuk JE, Ingerman E, Song C, Yoo C, Kuwana T, Kurth MJ, Shaw JT, Hinshaw JE, Green DR, Nunnari J (2008) Chemical inhibition of the mitochondrial division dynamin reveals its role in Bax/Bak‐dependent mitochondrial outer membrane permeabilization. Dev Cell 14: 193–204 [DOI] [PMC free article] [PubMed] [Google Scholar]
- Cecconi F, Levine B (2008) The role of autophagy in mammalian development: cell makeover rather than cell death. Dev Cell 15: 344–357 [DOI] [PMC free article] [PubMed] [Google Scholar]
- Cereghetti GM, Stangherlin A, Martins de Brito O, Chang CR, Blackstone C, Bernardi P, Scorrano L (2008) Dephosphorylation by calcineurin regulates translocation of Drp1 to mitochondria. Proc Natl Acad Sci USA 105: 15803–15808 [DOI] [PMC free article] [PubMed] [Google Scholar]
- Chan DC (2012) Fusion and fission: interlinked processes critical for mitochondrial health. Annu Rev Genet 46: 265–287 [DOI] [PubMed] [Google Scholar]
- Cherra S Jr, Kulich SM, Uechi G, Balasubramani M, Mountzouris J, Day BW, Chu CT (2010) Regulation of the autophagy protein LC3 by phosphorylation. J Cell Biol 190: 533–539 [DOI] [PMC free article] [PubMed] [Google Scholar]
- Chhabra A, Mehrotra S, Chakraborty NG, Dorsky DI, Mukherji B (2006) Activation‐induced cell death of human melanoma specific cytotoxic T lymphocytes is mediated by apoptosis‐inducing factor. Eur J Immunol 36: 3167–3174 [DOI] [PubMed] [Google Scholar]
- Choi AM, Ryter SW, Levine B (2013) Autophagy in human health and disease. N Engl J Med 368: 651–662 [DOI] [PubMed] [Google Scholar]
- Cianfanelli V, Fuoco C, Lorente M, Salazar M, Quondamatteo F, Gherardini PF, De Zio D, Nazio F, Antonioli M, D'Orazio M, Skobo T, Bordi M, Rohde M, Dalla Valle L, Helmer‐Citterich M, Gretzmeier C, Dengjel J, Fimia GM, Piacentini M, Di Bartolomeo S et al (2015) AMBRA1 links autophagy to cell proliferation and tumorigenesis by promoting c‐Myc dephosphorylation and degradation. Nat Cell Biol 17: 706 [DOI] [PubMed] [Google Scholar]
- Cipolat S, Martins de Brito O, Dal Zilio B, Scorrano L (2004) OPA1 requires mitofusin 1 to promote mitochondrial fusion. Proc Natl Acad Sci USA 101: 15927–15932 [DOI] [PMC free article] [PubMed] [Google Scholar]
- Contento RL, Campello S, Trovato AE, Magrini E, Anselmi F, Viola A (2010) Adhesion shapes T cells for prompt and sustained T‐cell receptor signalling. EMBO J 29: 4035–4047 [DOI] [PMC free article] [PubMed] [Google Scholar]
- Dhein J, Walczak H, Baumler C, Debatin KM, Krammer PH (1995) Autocrine T‐cell suicide mediated by APO‐1/(Fas/CD95). Nature 373: 438–441 [DOI] [PubMed] [Google Scholar]
- Di Bartolomeo S, Corazzari M, Nazio F, Oliverio S, Lisi G, Antonioli M, Pagliarini V, Matteoni S, Fuoco C, Giunta L, D'Amelio M, Nardacci R, Romagnoli A, Piacentini M, Cecconi F, Fimia GM (2010) The dynamic interaction of AMBRA1 with the dynein motor complex regulates mammalian autophagy. J Cell Biol 191: 155–168 [DOI] [PMC free article] [PubMed] [Google Scholar]
- Djouder N, Tuerk RD, Suter M, Salvioni P, Thali RF, Scholz R, Vaahtomeri K, Auchli Y, Rechsteiner H, Brunisholz RA, Viollet B, Makela TP, Wallimann T, Neumann D, Krek W (2010) PKA phosphorylates and inactivates AMPKalpha to promote efficient lipolysis. EMBO J 29: 469–481 [DOI] [PMC free article] [PubMed] [Google Scholar]
- Egan DF, Shackelford DB, Mihaylova MM, Gelino S, Kohnz RA, Mair W, Vasquez DS, Joshi A, Gwinn DM, Taylor R, Asara JM, Fitzpatrick J, Dillin A, Viollet B, Kundu M, Hansen M, Shaw RJ (2011) Phosphorylation of ULK1 (hATG1) by AMP‐activated protein kinase connects energy sensing to mitophagy. Science 331: 456–461 [DOI] [PMC free article] [PubMed] [Google Scholar]
- Ernster L, Schatz G (1981) Mitochondria: a historical review. J Cell Biol 91: 227s–255s [DOI] [PMC free article] [PubMed] [Google Scholar]
- Fimia GM, Stoykova A, Romagnoli A, Giunta L, Di Bartolomeo S, Nardacci R, Corazzari M, Fuoco C, Ucar A, Schwartz P, Gruss P, Piacentini M, Chowdhury K, Cecconi F (2007) Ambra1 regulates autophagy and development of the nervous system. Nature 447: 1121–1125 [DOI] [PubMed] [Google Scholar]
- Frank S, Gaume B, Bergmann‐Leitner ES, Leitner WW, Robert EG, Catez F, Smith CL, Youle RJ (2001) The role of dynamin‐related protein 1, a mediator of mitochondrial fission, in apoptosis. Dev Cell 1: 515–525 [DOI] [PubMed] [Google Scholar]
- Frezza C, Cipolat S, Martins de Brito O, Micaroni M, Beznoussenko GV, Rudka T, Bartoli D, Polishuck RS, Danial NN, De Strooper B, Scorrano L (2006) OPA1 controls apoptotic cristae remodeling independently from mitochondrial fusion. Cell 126: 177–189 [DOI] [PubMed] [Google Scholar]
- Gomes LC, Di Benedetto G, Scorrano L (2011) During autophagy mitochondria elongate, are spared from degradation and sustain cell viability. Nat Cell Biol 13: 589–598 [DOI] [PMC free article] [PubMed] [Google Scholar]
- Gomes LC, Scorrano L (2013) Mitochondrial morphology in mitophagy and macroautophagy. Biochim Biophys Acta 1833: 205–212 [DOI] [PubMed] [Google Scholar]
- Gordy C, He YW (2012) The crosstalk between autophagy and apoptosis: where does this lead? Protein Cell 3: 17–27 [DOI] [PMC free article] [PubMed] [Google Scholar]
- Gronski MA, Weinem M (2006) Death pathways in T cell homeostasis and their role in autoimmune diabetes. Rev Diabet Stud 3: 88–95 [DOI] [PMC free article] [PubMed] [Google Scholar]
- Guerrero AD, Welschhans RL, Chen M, Wang J (2013) Cleavage of anti‐apoptotic Bcl‐2 family members after TCR stimulation contributes to the decision between T cell activation and apoptosis. J Immunol 190: 168–173 [DOI] [PMC free article] [PubMed] [Google Scholar]
- He C, Bassik MC, Moresi V, Sun K, Wei Y, Zou Z, An Z, Loh J, Fisher J, Sun Q, Korsmeyer S, Packer M, May HI, Hill JA, Virgin HW, Gilpin C, Xiao G, Bassel‐Duby R, Scherer PE, Levine B (2012) Exercise‐induced BCL2‐regulated autophagy is required for muscle glucose homeostasis. Nature 481: 511–515 [DOI] [PMC free article] [PubMed] [Google Scholar]
- Holst J, Wang H, Eder KD, Workman CJ, Boyd KL, Baquet Z, Singh H, Forbes K, Chruscinski A, Smeyne R, van Oers NS, Utz PJ, Vignali DA (2008) Scalable signaling mediated by T cell antigen receptor‐CD3 ITAMs ensures effective negative selection and prevents autoimmunity. Nat Immunol 9: 658–666 [DOI] [PubMed] [Google Scholar]
- Hughes PD, Belz GT, Fortner KA, Budd RC, Strasser A, Bouillet P (2008) Apoptosis regulators Fas and Bim cooperate in shutdown of chronic immune responses and prevention of autoimmunity. Immunity 28: 197–205 [DOI] [PMC free article] [PubMed] [Google Scholar]
- Hurley RL, Barre LK, Wood SD, Anderson KA, Kemp BE, Means AR, Witters LA (2006) Regulation of AMP‐activated protein kinase by multisite phosphorylation in response to agents that elevate cellular cAMP. J Biol Chem 281: 36662–36672 [DOI] [PubMed] [Google Scholar]
- Julia E, Edo MC, Horga A, Montalban X, Comabella M (2009) Differential susceptibility to apoptosis of CD4+ T cells expressing CCR5 and CXCR3 in patients with MS. Clin Immunol 133: 364–374 [DOI] [PubMed] [Google Scholar]
- Kaminski M, Kiessling M, Suss D, Krammer PH, Gulow K (2007) Novel role for mitochondria: protein kinase Ctheta‐dependent oxidative signaling organelles in activation‐induced T‐cell death. Mol Cell Biol 27: 3625–3639 [DOI] [PMC free article] [PubMed] [Google Scholar]
- Kaminski MM, Roth D, Sass S, Sauer SW, Krammer PH, Gulow K (2012) Manganese superoxide dismutase: a regulator of T cell activation‐induced oxidative signaling and cell death. Biochim Biophys Acta 1823: 1041–1052 [DOI] [PubMed] [Google Scholar]
- Kane LA, Lazarou M, Fogel AI, Li Y, Yamano K, Sarraf SA, Banerjee S, Youle RJ (2014) PINK1 phosphorylates ubiquitin to activate Parkin E3 ubiquitin ligase activity. J Cell Biol 205: 143–153 [DOI] [PMC free article] [PubMed] [Google Scholar]
- Klionsky DJ, Abdalla FC, Abeliovich H, Abraham RT, Acevedo‐Arozena A, Adeli K, Agholme L, Agnello M, Agostinis P, Aguirre‐Ghiso JA, Ahn HJ, Ait‐Mohamed O, Ait‐Si‐Ali S, Akematsu T, Akira S, Al‐Younes HM, Al‐Zeer MA, Albert ML, Albin RL, Alegre‐Abarrategui J et al (2012) Guidelines for the use and interpretation of assays for monitoring autophagy. Autophagy 8: 445–544 [DOI] [PMC free article] [PubMed] [Google Scholar]
- Komatsu M, Waguri S, Ueno T, Iwata J, Murata S, Tanida I, Ezaki J, Mizushima N, Ohsumi Y, Uchiyama Y, Kominami E, Tanaka K, Chiba T (2005) Impairment of starvation‐induced and constitutive autophagy in Atg7‐deficient mice. J Cell Biol 169: 425–434 [DOI] [PMC free article] [PubMed] [Google Scholar]
- Krammer PH, Arnold R, Lavrik IN (2007) Life and death in peripheral T cells. Nat Rev Immunol 7: 532–542 [DOI] [PubMed] [Google Scholar]
- Kroemer G, Marino G, Levine B (2010) Autophagy and the integrated stress response. Mol Cell 40: 280–293 [DOI] [PMC free article] [PubMed] [Google Scholar]
- Landes T, Emorine LJ, Courilleau D, Rojo M, Belenguer P, Arnaune‐Pelloquin L (2010) The BH3‐only Bnip3 binds to the dynamin Opa1 to promote mitochondrial fragmentation and apoptosis by distinct mechanisms. EMBO Rep 11: 459–465 [DOI] [PMC free article] [PubMed] [Google Scholar]
- Latinis KM, Norian LA, Eliason SL, Koretzky GA (1997) Two NFAT transcription factor binding sites participate in the regulation of CD95 (Fas) ligand expression in activated human T cells. J Biol Chem 272: 31427–31434 [DOI] [PubMed] [Google Scholar]
- Lazarou M, Sliter DA, Kane LA, Sarraf SA, Wang C, Burman JL, Sideris DP, Fogel AI, Youle RJ (2015) The ubiquitin kinase PINK1 recruits autophagy receptors to induce mitophagy. Nature 524: 309–314 [DOI] [PMC free article] [PubMed] [Google Scholar]
- Mizushima N, Komatsu M (2011) Autophagy: renovation of cells and tissues. Cell 147: 728–741 [DOI] [PubMed] [Google Scholar]
- Mosenden R, Tasken K (2011) Cyclic AMP‐mediated immune regulation–overview of mechanisms of action in T cells. Cell Signal 23: 1009–1016 [DOI] [PubMed] [Google Scholar]
- Narendra D, Tanaka A, Suen DF, Youle RJ (2008) Parkin is recruited selectively to impaired mitochondria and promotes their autophagy. J Cell Biol 183: 795–803 [DOI] [PMC free article] [PubMed] [Google Scholar]
- Narendra DP, Jin SM, Tanaka A, Suen DF, Gautier CA, Shen J, Cookson MR, Youle RJ (2010) PINK1 is selectively stabilized on impaired mitochondria to activate Parkin. PLoS Biol 8: e1000298 [DOI] [PMC free article] [PubMed] [Google Scholar]
- Olichon A, Baricault L, Gas N, Guillou E, Valette A, Belenguer P, Lenaers G (2003) Loss of OPA1 perturbates the mitochondrial inner membrane structure and integrity, leading to cytochrome c release and apoptosis. J Biol Chem 278: 7743–7746 [DOI] [PubMed] [Google Scholar]
- Pagliarini V, Wirawan E, Romagnoli A, Ciccosanti F, Lisi G, Lippens S, Cecconi F, Fimia GM, Vandenabeele P, Corazzari M, Piacentini M (2012) Proteolysis of Ambra1 during apoptosis has a role in the inhibition of the autophagic pro‐survival response. Cell Death Differ 19: 1495–1504 [DOI] [PMC free article] [PubMed] [Google Scholar]
- Petronilli V, Penzo D, Scorrano L, Bernardi P, Di Lisa F (2001) The mitochondrial permeability transition, release of cytochrome c and cell death. Correlation with the duration of pore openings in situ . J Biol Chem 276: 12030–12034 [DOI] [PubMed] [Google Scholar]
- Pulinilkunnil T, He H, Kong D, Asakura K, Peroni OD, Lee A, Kahn BB (2011) Adrenergic regulation of AMP‐activated protein kinase in brown adipose tissue in vivo . J Biol Chem 286: 8798–8809 [DOI] [PMC free article] [PubMed] [Google Scholar]
- Quintana A, Griesemer D, Schwarz EC, Hoth M (2005) Calcium‐dependent activation of T‐lymphocytes. Pflugers Arch 450: 1–12 [DOI] [PubMed] [Google Scholar]
- Rizzuto R, Bernardi P, Pozzan T (2000) Mitochondria as all‐round players of the calcium game. J Physiol 529(Pt 1): 37–47 [DOI] [PMC free article] [PubMed] [Google Scholar]
- Roth D, Krammer PH, Gulow K (2014) Dynamin related protein 1‐dependent mitochondrial fission regulates oxidative signalling in T cells. FEBS Lett 588: 1749–1754 [DOI] [PubMed] [Google Scholar]
- Scorrano L, Ashiya M, Buttle K, Weiler S, Oakes SA, Mannella CA, Korsmeyer SJ (2002) A distinct pathway remodels mitochondrial cristae and mobilizes cytochrome c during apoptosis. Dev Cell 2: 55–67 [DOI] [PubMed] [Google Scholar]
- Scorrano L, Oakes SA, Opferman JT, Cheng EH, Sorcinelli MD, Pozzan T, Korsmeyer SJ (2003) BAX and BAK regulation of endoplasmic reticulum Ca2+: a control point for apoptosis. Science 300: 135–139 [DOI] [PubMed] [Google Scholar]
- Scorrano L (2009) Opening the doors to cytochrome c: changes in mitochondrial shape and apoptosis. Int J Biochem Cell Biol 41: 1875–1883 [DOI] [PubMed] [Google Scholar]
- Shi YF, Bissonnette RP, Parfrey N, Szalay M, Kubo RT, Green DR (1991) In vivo administration of monoclonal antibodies to the CD3 T cell receptor complex induces cell death (apoptosis) in immature thymocytes. J Immunol 146: 3340–3346 [PubMed] [Google Scholar]
- Smith CA, Williams GT, Kingston R, Jenkinson EJ, Owen JJ (1989) Antibodies to CD3/T‐cell receptor complex induce death by apoptosis in immature T cells in thymic cultures. Nature 337: 181–184 [DOI] [PubMed] [Google Scholar]
- Snow AL, Oliveira JB, Zheng L, Dale JK, Fleisher TA, Lenardo MJ (2008) Critical role for BIM in T cell receptor restimulation‐induced death. Biol Direct 3: 34 [DOI] [PMC free article] [PubMed] [Google Scholar]
- Srikanth S, Gwack Y (2013) Orai1‐NFAT signalling pathway triggered by T cell receptor stimulation. Mol Cells 35: 182–194 [DOI] [PMC free article] [PubMed] [Google Scholar]
- Stephan JS, Yeh YY, Ramachandran V, Deminoff SJ, Herman PK (2009) The Tor and PKA signaling pathways independently target the Atg1/Atg13 protein kinase complex to control autophagy. Proc Natl Acad Sci USA 106: 17049–17054 [DOI] [PMC free article] [PubMed] [Google Scholar]
- Twig G, Shirihai OS (2011) The interplay between mitochondrial dynamics and mitophagy. Antioxid Redox Signal 14: 1939–1951 [DOI] [PMC free article] [PubMed] [Google Scholar]
- Van Humbeeck C, Cornelissen T, Hofkens H, Mandemakers W, Gevaert K, De Strooper B, Vandenberghe W (2011) Parkin interacts with Ambra1 to induce mitophagy. J Neurosci 31: 10249–10261 [DOI] [PMC free article] [PubMed] [Google Scholar]
- Vazquez P, Arroba AI, Cecconi F, de la Rosa EJ, Boya P, de Pablo F (2012) Atg5 and Ambra1 differentially modulate neurogenesis in neural stem cells. Autophagy 8: 187–199 [DOI] [PubMed] [Google Scholar]
- Villalba M, Kasibhatla S, Genestier L, Mahboubi A, Green DR, Altman A (1999) Protein kinase ctheta cooperates with calcineurin to induce Fas ligand expression during activation‐induced T cell death. J Immunol 163: 5813–5819 [PubMed] [Google Scholar]
- Waiczies S, Weber A, Lunemann JD, Aktas O, Zschenderlein R, Zipp F (2002) Elevated Bcl‐X(L) levels correlate with T cell survival in multiple sclerosis. J Neuroimmunol 126: 213–220 [DOI] [PubMed] [Google Scholar]
- Yamaguchi R, Lartigue L, Perkins G, Scott RT, Dixit A, Kushnareva Y, Kuwana T, Ellisman MH, Newmeyer DD (2008) Opa1‐mediated cristae opening is Bax/Bak and BH3 dependent, required for apoptosis, and independent of Bak oligomerization. Mol Cell 31: 557–569 [DOI] [PMC free article] [PubMed] [Google Scholar]
- Zhang Z, Wu X, Duan J, Hinrichs D, Wegmann K, Zhang GL, Hall M, Rosenbaum JT (2012) Low dose rapamycin exacerbates autoimmune experimental uveitis. PLoS ONE 7: e36589 [DOI] [PMC free article] [PubMed] [Google Scholar]
- Zhong Y, Wang QJ, Li X, Yan Y, Backer JM, Chait BT, Heintz N, Yue Z (2009) Distinct regulation of autophagic activity by Atg14L and Rubicon associated with Beclin 1‐phosphatidylinositol‐3‐kinase complex. Nat Cell Biol 11: 468–476 [DOI] [PMC free article] [PubMed] [Google Scholar]
Associated Data
This section collects any data citations, data availability statements, or supplementary materials included in this article.
Supplementary Materials
Appendix
Expanded View Figures PDF
Review Process File
Source Data for Figure 2
Source Data for Figure 3
Source Data for Figure 4
Source Data for Figure 6
Source Data for Figure 7