

Abstract
Fish are an important source of nutrients including omega-3 fatty acids, which may reduce risk of adverse health outcomes such as cardiovascular disease; however, fish may also contain significant amounts of environmental pollutants. The Wisconsin Departments of Health Services and Natural Resources developed a survey instrument, along with a strategy to collect human biological samples to assess the risks and benefits associated with long-term fish consumption among older male anglers in Wisconsin. The target population was men aged 50 years and older, who fish Wisconsin waters and live in the state of Wisconsin. Participants provided blood and hair samples and completed a detailed (paper) questionnaire, which included questions on basic demographics, health status, location of catch and species of fish caught/eaten, consumption of locally caught and commercially purchased fish, and awareness and source of information for local and statewide consumption guidelines. Biological samples were used to assess levels of docosahexaenoic acid (DHA), docosapentaenoic acid (DPA), eicosapentaenoic acid (EPA); vitamin D; and selenium in blood. Quantile regression analysis was used to investigate the associations between biomarker levels and self-reported consumption of fish from the Great Lakes and other areas of concern, other locally caught fish, and commercially purchased fish (meals per year). Respondents were largely non-Hispanic white men in their 60’s with at least some college education, and about half were retired. Fish consumption was high (median of 54.5 meals per year), with most fish meals coming from locally-caught fish. Multivariate regression models showed that the effect of supplement use was much greater than that of fish consumption, on nutrient levels, although consumption of fish from the Great Lakes and areas of concern was significantly associated with higher levels of vitamin D even after controlling for supplement usage.
Keywords: Fish consumption, Great Lakes, fatty acids, selenium, vitamin D
Introduction
Fish represent a dietary source of lean protein and important nutrients, including omega-3 fatty acids, selenium, and vitamin D (NIH 2015, NIH 2015, NIH 2015). Increased consumption of fatty acids may reduce the risk of adverse health outcomes including diabetes (Zhang, Picard-Deland et al. 2013), cerebrovascular disease (Chowdhury, Stevens et al. 2012) and cardiovascular disease (Joensen, Schmidt et al. 2010, Levitan, Wolk et al. 2010, Wilk, Tsai et al. 2012). Selenium has also been hypothesized as beneficial to health due to its antioxidant activity (Rayman 2000, Tinggi 2008, Rayman 2012, Rees, Hartley et al. 2013, Roman, Jitaru et al. 2014); although the evidence is mixed for cardiovascular health (Rees, Hartley et al. 2013), studies have found that inadequate selenium is associated with poorer cognition and immune function, as well as overall mortality (Rayman 2012). Vitamin D has been shown to reduce risk of cardiovascular disease (Wang, Pencina et al. 2008, Vacek, Vanga et al. 2012), and there is some evidence for decreased risk of overall mortality (Bjelakovic, Gluud et al. 2014) and certain types of cancer (Bjelakovic, Gluud et al. 2014). Although vitamin D is produced endogenously during exposure to sunlight (NIH 2015), individuals living in northern climates with a long, cold season may be at particular risk for vitamin D deficiency. Few foods are naturally rich in vitamin D, but fish is a natural source to combat the seasonal decline in vitamin D levels. Consequently, fish consumption is thus particularly encouraged for populations at high risk of these adverse health outcomes, including older men. However, certain types of fish may also contain high levels of contaminants such as mercury. Consequently, advice regarding fish consumption may be unclear or contradictory depending upon the source of the advice (e.g., state agencies, healthcare providers, popular media), goal of the advice (focus on health benefits or avoidance of contaminants), target population, and other factors.
To balance the risks and benefits of consuming fish, fish consumption guidelines issued by Great Lakes states are designed to encourage consumption of fish that are high in nutrients yet low in contaminants. In Wisconsin, such guidelines were first issued in 1976 by the Departments of Health Services (DHS) and Natural Resources (DNR) and provide more restrictive advice for women of childbearing age (under age 50) and children under age 15. While older men are not specifically targeted by Wisconsin’s consumption advisories, they may particularly benefit from consumption of fish due to increased risk of stroke and heart disease (Salonen, Seppanen et al. 1995, He, Rimm et al. 2002, de Goede, Verschuren et al. 2012). Older men also may have higher body burden of contaminants perhaps due in part to lifelong bioaccumulation and consumption patterns (Knobeloch, Steenport et al. 2006, Knobeloch, Turyk et al. 2009, Turyk, Bhavsar et al. 2012).
In order to assess the risks and benefits associated with long-term fish consumption among this subpopulation, the Wisconsin DHS’ WI Fish Consumption Advisory Program (WFCAP) developed a survey instrument, along with a strategy to collect human biological samples to assess the risks and benefits associated with long-term fish consumption among older male anglers in Wisconsin. While there have been some studies of nutrient content in Great Lakes basin fish (as noted by (Turyk, Bhavsar et al. 2012, Neff, Bhavsar et al. 2014)), there are few which have been able to directly link reported fish consumption habits with biomarkers. Herein, we focus on the association between fish consumption and biomarker levels of nutrients in this angler cohort. Findings from this analysis will aid DHS and DNR in crafting and communicating appropriate fish consumption guidelines to this potentially vulnerable population of older male anglers.
Materials and Methods
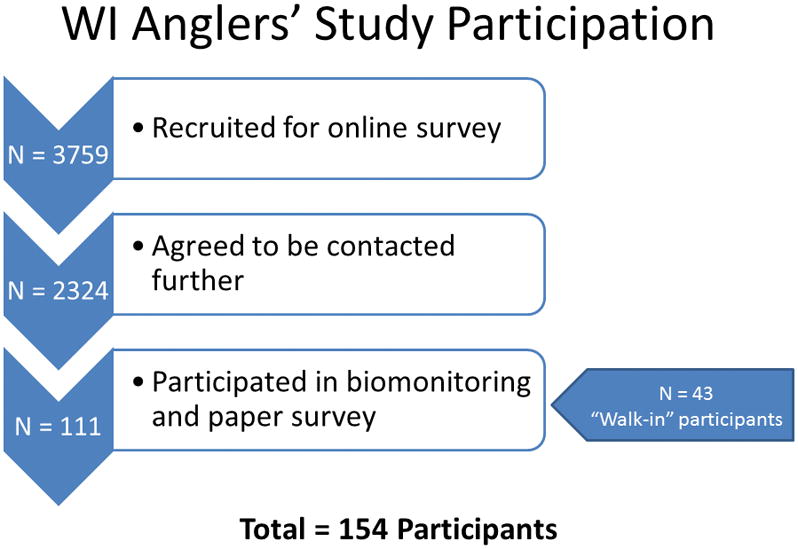
Study participants were recruited from those who previously participated in an online survey administered by the DHS, and had indicated when completing this survey, that they would be interested in future studies (Imm, Anderson et al. 2013). An additional 43 persons (who had not participated in the online survey) were recruited via flyers and other methods (Figure 1).
Figure 1.
As with the original online survey, the target population was men aged 50 years and older, who fish Wisconsin waters and live in the state of Wisconsin. Participants provided blood and hair samples and completed a detailed (paper) questionnaire, which included questions on basic demographics, health status, location of catch and species of fish caught/eaten, consumption of locally caught and commercially purchased fish, and awareness and source of information for local and statewide consumption guidelines. Hair samples were used to evaluate mercury body burden (not reported here). The Survey of the Health of Wisconsin program conducted follow-up phone calls and coordinated bio-sample collection in the homes of study participants (Nieto, Peppard et al. 2010). The study was reviewed by the University of Wisconsin Human Subjects Review Board and determined to be exempt, as it was conducted for the purpose of public health research.
Biological Samples
Biological samples were used to assess levels of lipids (cholesterol and triglycerides) and nutrients (omega-3 fatty acids including Docosahexaenoic acid (DHA), Docosapentaenoic acid (DPA), Eicosapentaenoic acid (EPA); vitamin D as the sum of 25-hydroxyvitamin D2 and 25-hydroxyvitamin D3; and selenium, in blood. Each participant provided 47 mLs of whole blood; all blood collection vials were frozen immediately at −20 degrees, with the exception of the vial for fatty acids analysis (frozen at −80 degrees in vertical position) and the vial for lipids analysis (refrigerated in vertical position for no longer than one week). The Wisconsin State Laboratory of Hygiene (WSLH) analyzed the serum collected from whole blood samples for selenium and fatty acids. WSLH determined selenium in plasma following the WSHL Environmental Health Division’s’ CLIN TOX Method 12 CT/Clinical Blood Mercury by Inductively Coupled Plasma-Mass Spectrometry. For fatty acids analysis, WSLH validated and analyzed human serum using NuChek’s 455 fatty acids standards mixture (NuChek 2015). Technical assistance from the Minnesota Health Department was requested to successfully transfer this methodology from their laboratory. Frozen plasma samples were thawed, extracted, and derivatized with acetyl chloride and butylated hydroxytoluene to form fatty acid methyl esters (FAMEs) and were reconstituted in hexane. FAME fatty acid derivatives were injected onto a capillary gas chromatographic (GC) column with flame ionization detection (FID; Agilent 6890; Santa Clara, CA). Sixteen fatty acids (4 saturated-, 1 monounsaturated-, and 11 polyunsaturated) were quantified by FID detector. Reporting limits for 16 n-3, n-6 and n-9 fatty acids ranged from 0.85 – 3.1 mg/L. NuChek’s fatty acid calibration standard mixture and extraction blanks are used for each batch of 10 samples (NuChek 2015). A five-point calibration curve was performed at the start of the sample set. The quantification standard included all the fatty acids reported. The calibration curves were used to quantify the corresponding compound with the sample matrix. The quantification standards were spiked in the plasma, extracted and then derivitized prior to injecting on the GC/FID. Check standards, blanks and duplicates were run with each sample set. Check standards were run to validate the calibration curve and on regular intervals to monitor the stability of the instrument and reproducibility of the method. The check standard was passed if the individual compound was with 50–125%. Duplicate samples were run at least every 10 samples analyzed and or if enough sample volume was available. All compounds within the calibration curve achieved 0.990 correlation coefficient or greater. All blanks associated with this project were below reporting limit concentrations.
Marshfield Laboratory analyzed serum samples for triglycerides and cholesterol. For both tests, an enzymatic/timed endpoint method was performed on a Beckman DXC analyzer. Serum lipids were used as an adjustment factor in multivariate models.
Data Analysis
All analyses were performed using SAS/STAT software version 9.31. The biomarker data were analyzed to determine distribution among study participants, and associations between and among nutrient levels, blood lipids, and reported fish consumption. Consumption was based on questions regarding the number of times participants reported having eaten any fish or shellfish from any source in the past 30 days (total consumption), and the number of times they had eaten fish from specific sources, over the past 12 months (specific sources included the Great Lakes, other areas of concern [Menominee River, Fox River/Lower Green Bay, Sheboygan River, St. Louis River and Bay, or the Milwaukee Estuary, including the lower Milwaukee and inner harbor, Kinnickinnic, and Menomonee Rivers and harbor], other locally caught fish, and fish purchased at a restaurant, or store/market). The frequency was assumed to translate to number of meals eaten during the time periods specified, and the consumption levels for all fish and all shellfish were converted to a yearly basis (i.e., number of meals consumed per year). A priori, the decision was made to focus the analysis on fish consumption (rather than shellfish) as the main predictor. As with many biomarkers, most of the nutrients examined were not normally distributed (both untransformed and after natural logarithm transformation). Additionally, it is possible that the effects of the predictor variables may be different depending on the level of the outcome – for example, eating more fish could have a greater or lesser effect on selenium levels at the lower end of the distribution of selenium compared to the higher end of the distribution. This possibility is particularly important in nutritional public health when examining risk factors for clinically depressed or elevated nutrient levels. One approach to examine the possibility of differing predictor effects at different response levels, is quantile regression (Koenker and Bassett 1978, Dong, Jim et al. 2015). With this approach, the response being modeled is the conditional quantile (rather than the mean) of the outcome; rather than estimating a single slope, multiple slopes are estimated for different (conditional) levels of the outcome, providing a more complete picture of the effect of exposure on different levels of the outcome of interest. In order to capture a good representation of the exposure-response relationships, conditional quantile regression modeling results (beta coefficients) are presented for the conditional 10th, 50th, and 90th percentile of each outcome. As a way to evaluate the fit of each model, a likelihood ratio test for the joint effect of all model covariates was conducted for each of the three quantiles examined. Quantile regression modeling was performed using the PROC QUANTREG procedure in SAS.
Results
Demographic characteristics of respondents are shown in Table 1. Respondents were largely non-Hispanic white men in their 60’s, with nearly full life residence in the state of Wisconsin. Most had at least some college education, and about half were working, and half retired. Nearly all respondents were classified as either overweight (42.2%) or obese (46.8%) according to their height and weight.
Table 1.
Demographic characteristics of study participants
| Total n | 154 | |
| Mean (SD) | Median (IQR) | |
| Agea | 61.7 (7.7) | 60.5 (56, 67) |
| Years living in Wisconsin | 54.8 (15.2) | 58 (50, 64) |
| Total Cholesterol (mg/dL) | 190.7 (36.3) | 192 (172, 215) |
| Triglycerides (mg/dL) | 235.2 (143.9) | 197 (138, 278) |
| Percent (n) | ||
| Race/Ethnicity | ||
| Identification as Hispanic/Latino | 0.7 (1) | |
| Identification as White (alone or in combination) | 98.7 (152) | |
| Educational Attainment | ||
| High school or less | 31.2 (39) | |
| Some college or two-year degree | 14.4 (18) | |
| College degree (four-year) or more | 54.4 (68) | |
| Missing | (29) | |
| Employment Status | ||
| Working (full or part-time, or self-employed) | 50.0 (77) | |
| Retired | 46.1 (71) | |
| Other | 3.9 (6) | |
| Marital Status | ||
| Married (or marriage-like relationship) | 85.7 (132) | |
| Other | 14.3 (22) | |
| Household Income | ||
| (Missing) | (6) | |
| <$14,999 | 2.0 (3) | |
| $15,000 – $34,999 | 16.2 (24) | |
| $35,000 – $49,999 | 16.9 (25) | |
| $50,000 – $74,999 | 25.7 (38) | |
| ≥$75,000 | 38.5 (57) | |
| Not answered | 0.7 (1) | |
| Smoked at least 100 cigarettes in lifetime | 58.8 (90) | |
| Smoke cigarettes daily | 12.6 (12) | |
| BMI Categoryb | ||
| Underweight (<18.5) | 0 (0) | |
| Normal (18.5 – 25) | 11.0 (17) | |
| Overweight (25 – 30) | 42.2 (65) | |
| Obese (≥30) | 46.8 (72) | |
| Total Cholesterol (mg/dL) Category | ||
| Desirable (<200) | 59.1 (91) | |
| Borderline (200–239) | 33.8 (52) | |
| High (≥240) | 7.1 (11) | |
| Triglycerides Category | ||
| Desirable (<150) | 29.2 (45) | |
| Borderline (150–199) | 21.4 (33) | |
| High (200–499) | 44.2 (68) | |
| Very High (≥500) | 5.2 (8) | |
For percentages, calculations exclude missing values
Two individuals were missing date of birth; these were set to the median value in the study population
One individual was missing weight; this was set to the median value in the study population. One individual gave height in feet as ‘2;’ height was set to the median value in the study population.
When comparing the individuals who were recruited from the online survey (n=111) and ‘walk-in’ participants (n=43), there were no differences by age, employment status, or length of residence in Wisconsin. Walk-in participants were slightly less likely to be married (76.7% compared with 89.2% of online survey participants) and had lower educational attainment (26.9% with a college degree or more, compared with 61.6% of online survey participants).
Reported levels of fish and shellfish consumption, and biomarker levels of nutrients and contaminants, are displayed in Table 2 (see also, Christensen et al., submitted for publication). On average, participants consumed a median of 66.5 fish and shellfish meals per year, with the majority of this coming from fish, and specifically from locally caught (rather than commercially purchased) fish. For comparison, information on fish consumption was also gathered from two additional populations. First, data from the 2011–2012 cycle of the National Health and Nutrition Examination Survey (CDC 2014) was used to provide information on fish consumption for a nationally representative sample of the general US population. For non-Hispanic white men aged 50 and older, the median consumption of fish was 33 meals per year, compared with a median of 54.5 meals per year among the angler study population. Similarly, the median consumption of combined fish and shellfish was approximately 50 meals per year among US men, compared to a median of 66.5 among the anglers. Second, data from a random sample of fishing license holders in Great Lakes states showed that even this population had lower consumption compared with this angler population – for the random sample (which included both men and women of all ages), the average number of fish meals eaten in the past year was 20.5, comprising 5.9 sport-caught fish meals and 15.1 purchased fish meals (Connelly, Lauber et al. 2012).
Table 2.
Fish consumption and biomarker levels of nutrients among study participants, and among NHANES participants.
| Median (IQR) | ||
|---|---|---|
| Anglers (This study) | NHANES, non-Hispanic white men aged ≥50 yearsb | |
| Fish and shellfish consumption (meals per year) | ||
| Total fish and shellfish | 66.5 (47, 114) | 50.4 (23.9, 96.8) |
| Total fish | 54.5 (36, 93) | 33.3 (16.9, 64.6) |
| Fish from Great Lakes | 7 (2, 24) | -- |
| Fish from areas of concerna | 0 (0, 3) | -- |
| Other locally caught fish | 12 (6, 36) | -- |
| Fish from restaurant | 10 (4, 20) | -- |
| Fish from store | 4.5 (0, 12) | -- |
| Total shellfish | 9 (4, 18) | 23.1 (12.2, 47.9) |
| Shellfish from restaurant | 4 (1, 6) | -- |
| Shellfish from store | 4 (1, 10) | -- |
| Nutrients | ||
| Docosahexaenoic acid, mg/L (DHA; n=153) | 57 (44, 74) | 39.9 (30.9, 56.4) |
| Docosapentaenoic acid, mg/L (DPA; n=153) | 19 (15, 25) | 14.2 (11.8, 18.2) |
| Eicosapentaenoic acid, mg/L (EPA; n=153) | 22 (13, 32) | 14.2 (9.9, 20.4) |
| Selenium, mg/L (n=153) | 141.4 (132.8, 153.2) | 199.9 (179.6, 218.8) |
| Vitamin D, ng/mL (sum of 25-hydroxyvitamin D2 and 25-hydroxyvitamin D3) | 28.3 (23.1, 36.4) | 24.0 (18.2, 29.2) |
Areas of concern include: Menominee River, Fox River/Lower Green Bay, St. Louis River and Bay, Sheboygan River, Milwaukee Estuary (including the lower Milwaukee and inner harbor, Kinnickinnic, and Menomonee Rivers and harbor)
For NHANES participants, all results are adjusted for survey sampling and design. Fish and shellfish consumption values are taken from the 2011–2012 cycle; consumption was ascertained for the previous 30 days, thus yearly consumption was calculated by multiplying by (365.25/30). For nutrient levels, values are taken from the 2003–2004 (fatty acids), 2005–2006 (vitamin D) and 2011–2012 (selenium) cycles of the NHANES.
Wisconsin anglers had higher levels of DHA, DPA, EPA, and vitamin D, compared with the US general population, while median levels of selenium were lower.
The distribution of fish and shellfish consumption by source is shown in Supplemental Table 1; results are shown for the median, 25th and 75th percentiles of consumption. Shellfish consumption among anglers was also significantly lower than shellfish consumption nationally. Across all consumption groups, the number of fish meals per year was much greater than the number of shellfish meals per year. The highest proportion of fish meals came from ‘other locally caught fish,’ followed by fish from a restaurant and Great Lakes fish. Shellfish meals were relatively evenly distributed between those from restaurants versus stores. The proportion of fish meals represented by Great Lakes fish increased with increasing (overall) fish consumption, unlike the other types of fish or shellfish.
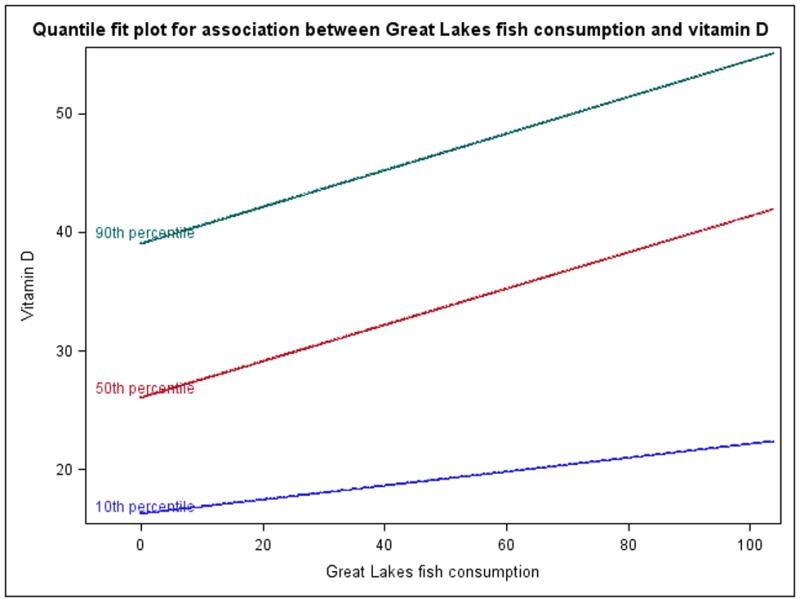
The univariate (i.e., unadjusted) quantile regression modeling results for the association between fish consumption, and each nutrient are included in Supplemental Table 2. Results are interpreted as follows, using the example of ‘Great Lakes fish’ and DHA: increasing consumption of Great Lakes Fish by one unit (one meal per year) results in a 0.125 mg/L increase in DHA, at the conditional 90th percentile of DHA. In many cases, the beta coefficients at the different quantiles were not significantly different from each other – for example, as shown by overlapping confidence intervals of the beta coefficients for vitamin D and Great Lakes fish between quantiles. In these cases, a straightforward linear regression may have led to similar conclusions, but would mask potential non-linearity that, although not statistically significant, may be important to understand the exposure-response relationship. Statistically significant associations were found between Great Lakes fish consumption, and both selenium and vitamin D level. For these two relationships, the effect of Great Lakes fish consumption generally increased with increasing quantile, while in other cases non-linear patterns across quantiles were common; see Figure 2 for the association between Great Lakes fish consumption and vitamin D level as an example where the response appeared to be more nonlinear, with a smaller and non-significant association at the 10th percentile of vitamin D (beta coefficient of 0.059, 95% CI: −0.139, 0.235), compared with significant and nearly equivalent associations at the 50th and 90th percentiles (beta coefficients of 0.153 [95% CI: 0.131, 0.280] and 0.154 [95% CI: 0.038, 0.599], respectively). In addition, fish purchased from a store was associated with higher DHA levels at the highest quantile examined.
Figure 2.
While many associations between fish consumption and nutrient levels were identified in the unadjusted modeling, for multivariate modeling the correlation among the various consumption parameters is important to consider. Spearman correlation coefficients are displayed in Supplemental Table 3. Correlations between consumption of locally caught fish from different sources (Great Lakes, Areas Of Concern, other locally caught fish) were low, indicating these could likely be included as independent predictors for multivariate modeling. However, in multivariate modeling, locally caught fish from areas of concern was not included as a separate predictor – due to the small range of this variable, inclusion caused notable model instability. Instead, a combined variable was created as the sum of locally-caught fish from areas of concern and from the Great Lakes, since these two groupings of water bodies share common attributes with respect to fish types and distribution. There was also a statistically significant correlation between fish purchased from a store and fish purchased from a restaurant, which we addressed for modeling by creating a combined variable (sum) of ‘all commercial fish.’
A concern when examining association with nutrients, is that use of dietary supplements or fortified food/beverages may have a large effect on observed levels, which may outweigh any contribution from fish consumption. For this reason, participants were asked about their use of such supplements and foods/beverages, as shown in Table 3. The most commonly reported supplements were vitamin D or a multivitamin with vitamin D (61.7%), and fish oil (40.3%). About one quarter of respondents reported taking supplements including selenium and/or omega-3 fatty acids, while very few respondents (<10%) reported taking flaxseed oil, or cod liver oil. Thus, information on reported supplement usage was also added to multivariate regression models as an independent predictor of nutrient levels.
Table 3.
Supplement usage and consumption of certain foods by study participants
| Percent (n) | |||||
|---|---|---|---|---|---|
| How often do you take, eat or drink the following items? | Daily | 2–6 times/week | Once/week | 1–3 times/month | Rarely or never |
| Supplements | |||||
| Fish oil | 27.9 (43) | 5.8 (9) | 3.3 (5) | 3.3 (5) | 59.7 (92) |
| Flaxseed oil | 3.9 (6) | 1.3 (2) | 1.3 (2) | 1.3 (2) | 92.2 (142) |
| Cod liver oil | 1.3 (2) | 0 (0) | 0.7 (1) | 0.7 (1) | 97.4 (149) |
| Any supplement that includes omega-3 fatty acids | 17.5 (27) | 3.3 (5) | 2.6 (4) | 3.3 (5) | 73.4 (113) |
| Selenium supplement or multi-vitamin with Selenium added | 20.8 (32) | 2.0 (3) | 0.7 (1) | 0.7 (1) | 76.0 (117) |
| Vitamin D supplement or multi-vitamin with Vitamin D included | 44.8 (69) | 6.5 (10) | 4.6 (7) | 5.8 (9) | 38.3 (59) |
| Food and Beverage Items | |||||
| Omega-3 fortified food or drink such as orange juice, milk or eggs fortified with omega-3 fatty acids | 9.1 (14) | 7.8 (12) | 7.8 (12) | 11.7 (18) | 63.6 (98) |
| Vitamin D fortified milk | 32.5 (50) | 24.7 (38) | 7.1 (11) | 5.8 (9) | 29.9 (46) |
| Vitamin D fortified food or drink (NOT including Vitamin D fortified milk) such as orange juice, cereal or yogurt fortified with Vitamin D | 10.4 (16) | 18.8 (29) | 14.3 (22) | 14.9 (23) | 41.6 (64) |
Information on serum lipids (total cholesterol and triglycerides) was also collected from study participants. Serum lipids may be related to both fish/shellfish consumption and with nutrient levels (von Lossonczy, Ruiter et al. 1978, Fehily, Burr et al. 1983, Harris 1989). Therefore, total serum lipids were included as an additional predictor along with fish consumption and supplement usage, in the quantile regression models (Table 4). In all cases, the effect of supplement use was much greater than that of the various fish consumption or lipid variables. However, consumption of fish from the Great Lakes and areas of concern was still significantly associated with higher levels of vitamin D even after controlling for supplement usage.
Table 4.
Multivariate associations between fish consumption (meals per year) and levels of nutrients, modeled using a quantile regression model for the 10th, 50th, and 90th percentiles.
| Beta (95% CI) | ||||
|---|---|---|---|---|
| Predictor | Response | 10th percentile | 50th percentile | 90th percentile |
| All commercially purchased fish (store, restaurant) | DHA | 0.063 (−0.136, 0.152) | 0.173 (−0.116, 0.353) | 0.531 (−0.022, 1.548) |
| Locally-caught fish – Great Lakes and AOCs | 0.033 (−0.480, 0.195) | 0.025 (−0.128, 0.277) | 0.430 (−0.253, 0.840) | |
| Locally-caught fish – other water bodies | −0.003 (−0.392, 0.066) | −0.071 (−0.210, 0.090) | −0.034 (−0.185, 0.688) | |
| Total lipids | 0.027 (0.002, 0.034) | 0.038 (0.002, 0.061) | 0.045 (−0.002, 0.159) | |
| Supplement (fish oil, cod liver oil, flaxseed oil, or other supplement including omega 3 fatty acids) | 6.084 (−1.029, 14.394) | 10.756 (2.912, 21.203) | 29.557 (8.170, 64.418) | |
| All commercially purchased fish (store, restaurant) | DPA | 0.009 (−0.226, 0.025) | −0.011 (−0.060, 0.033) | 0.008 (−0.059, 0.035) |
| Locally-caught fish – Great Lakes and AOCs | −0.017 (−0.083, 0.051) | 0.033 (−0.011, 0.052) | 0.014 (−0.039, 0.141) | |
| Locally-caught fish – other water bodies | −0.015 (−0.152, 0.016) | −0.006 (−0.062, 0.049) | −0.001 (−0.052, 0.076) | |
| Total lipids | 0.016 (0.005, 0.026) | 0.024 (0.017, 0.032) | 0.027 (0.022, 0.046) | |
| Supplement (fish oil, cod liver oil, flaxseed oil, or other supplement including omega 3 fatty acids) | 1.080 (−3.023, 3.483) | 3.632 (0.226, 5.528) | 5.593 (1.486, 8.416) | |
| All commercially purchased fish (store, restaurant) | EPA | −0.022 (−0.214, 0.087) | 0.019 (−0.051, 0.080) | 0.166 (−0.098, 0.700) |
| Locally-caught fish – Great Lakes and AOCs | 0.040 (−0.065, 0.046) | 0.047 (−0.067, 0.164) | 0.039 (−0.148, 0.370) | |
| Locally-caught fish – other water bodies | −0.002 (−0.134, 0.053) | 0.032 (−0.056, 0.097) | −0.057 (−0.147, 0.322) | |
| Total lipids | 0.005 (0.000, 0.016) | 0.010 (0.000, 0.026) | 0.036 (−0.010, 0.088) | |
| Supplement (fish oil, cod liver oil, flaxseed oil, or other supplement including omega 3 fatty acids) | 2.415 (−0.086, 7.673) | 10.012 (5.982, 13.776) | 23.510 (9.477, 39.661) | |
| All commercially purchased fish (store, restaurant) | Selenium | −0.100 (−0.219, 0.088) | −0.018 (−0.122, 0.134) | 0.058 (−0.059, 0.578) |
| Locally-caught fish – Great Lakes and AOCs | −0.040 (−0.172, 0.075) | 0.029 (−0.102, 0.112) | 0.141 (−0.119, 0.534) | |
| Locally-caught fish – other water bodies | −0.061 (−0.194, 0.059) | −0.039 (−0.231, 0.046) | −0.105 (−0.159, 0.461) | |
| Total lipids | 0.005 (−0.003, 0.033) | 0.020 (0.001, 0.030) | 0.020 (−0.007, 0.051) | |
| Selenium supplement or multi-vitamin with selenium added | 2.557 (−3.480, 7.507) | 5.430 (−7.074, 13.236) | 10.620 (6.782, 32.668) | |
| All commercially purchased fish (store, restaurant) | Vitamin D | 0.029 (−0.264, 0.059) | −0.025 (−0.069, 0.065) | 0.051 (−0.139, 0.289) |
| Locally-caught fish – Great Lakes and AOCs | 0.013 (−0.033, 0.104) | 0.109 (0.028, 0.196) | 0.161 (−0.005, 0.361) | |
| Locally-caught fish – other water bodies | 0.027 (−0.207, 0.040) | 0.008 (−0.041, 0.085) | −0.004 (−0.109, 0.183) | |
| Total lipids | 0.004 (−0.019, 0.012) | −0.003 (−0.009, 0.008) | −0.004 (−0.019, 0.015) | |
| Vitamin D supplement or multi-vitamin with Vitamin D included | 5.879 (1.255, 9.962) | 4.296 (0.896, 7.329) | 4.819 (−2.039, 14.480) | |
Supplement usage is modeled as ‘rarely/never’ versus all other frequencies of usage (1–3 times a month, once a week, 2–6 times a week, or daily). Bold font indicates an association that is statistically significant at the p<0.05 level. Total serum lipids estimated as: (2.27 * total cholesterol) + (triglycerides) + (62.3).
A likelihood ratio test was used to evaluate the joint effect of the model covariates. For the three fatty acids (DPA, EPA, DHA) the inclusion of the covariates significantly improved model fit. For selenium, the likelihood ratio test was significant at the 90th percentile (indicating that covariates improved model fit) but marginal at the 10th and 50th percentiles (p=0.16 and 0.15, respectively). Similarly for vitamin D, the likelihood ratio test was significant at the 50th percentile but marginal at the 10th (p=0.07) and 90th (p=0.19) percentiles. These results indicate that for selenium and vitamin D, the model did not necessarily explain a great deal of the variation at certain points in the distribution of these two nutrients.
Discussion
We evaluated fish consumption patterns and levels of nutrients and lipids in blood samples collected from Wisconsin male anglers aged 50 years and older. In this population, higher consumption of locally-caught fish from the Great Lakes and areas of concern was associated with increased vitamin D at the 50th percentile of vitamin D. This association was significant even when controlling for supplement usage, although in general the magnitude of the association for fish consumption variables was smaller than that for supplement usage variables.
The anglers in this study had relatively high fish consumption, specifically locally caught fish. Consumption was higher in this population compared with both the US general population (overall and for older non-Hispanic white men, (CDC 2014)), and with a random sample of anglers in fishing license holders in Great Lakes states (Connelly, Lauber et al. 2012). Nutrient levels among the random sample of fishing license holders were not available, but in comparison with the US general population, the anglers in this study had higher levels of fatty acids and vitamin D, and lower levels of selenium. These differences may be due to both the higher fish consumption among anglers, as well as differences in exposure routes and sources, including other dietary sources aside from fish and supplement usage. About half of the anglers in this study reported taking supplements containing vitamin D (62%) or fish oil (40%), while a smaller number reported taking supplements containing selenium or omega-3 fatty acids.
There were some limitations to this study. First, the study’s cross-sectional design means that only ‘point-in-time’ associations can be evaluated, rather than cause-effect relationships. There may also be error in self-reported characteristics, including self-reported fish and shellfish consumption. This type of error should not be different based on nutrient levels however—such non-differential error would generally have the effect of biasing effect estimates toward the null. The sample size of 154 participants was relatively small, which in some cases led to unstable model estimates and limited our ability to perform extensive multivariate analyses. Regarding nutrient levels, one factor which is both a strength as well as a limitation, is that measured biomarker levels are aggregated over all sources and routes. A strength of this approach is that no sources or routes are ‘missed’ but a limitation is that exposure can not be traced back to any one factor (such as fish). Regarding analytical methods, nutrient biomarker levels were measured in serum, a decision made based upon study/laboratory resources and the desire to compare results with those from other Great Lakes states research on levels of nutrients both in fish consumers, and in the fish themselves. There has been some research evaluating the utility of fatty acids measured in erythrocytes compared with serum, which indicates that measurements made in erythrocytes may be more closely correlated with self-reported fatty acid intake, and more accurately reflect longer-term fatty acid intake due to a longer residence time (~120 days) (Katan, Deslypere et al. 1997, Sun, Ma et al. 2007). In contrast, fatty acids measured in serum may more accurately reflect short-term intake, on the order of weeks rather than months (Katan, Deslypere et al. 1997). However, measurements in serum tend to be highly correlated with measurements in erythrocytes (average Spearman correlation coefficient of 0.7 (Sun, Ma et al. 2007)), which indicates that serum measurements may still be a reasonable proxy for reported fatty acid intake. Finally, the analyses shown here may not account for all potential confounders, as fish consumption and biomarker levels may be influenced by additional factors such as seasonality (i.e., if fish consumption varied by season, and if nutrient levels varied by season for reasons other than varying consumption of fish, such as variations in exposure to sunlight affecting anglers’ vitamin D levels). Use of a likelihood ratio test for the joint effect of covariates indicated that this may be an issue for certain portions of the distributions of both selenium and vitamin D. As a sensitivity analysis, the multivariate quantile regression models were extended to include either month or season of data collection. In these models, certain months or seasons were significantly associated with nutrient levels, but in most cases estimates were unstable, with confidence bounds including infinity. However, there was some evidence that collection of blood samples during the fall, spring or summer was associated with lower levels of the three fatty acids (DHA, DPA, EPA) and selenium, compared with sample collection during winter. In contrast, data collection during the summer was associated with higher levels of vitamin D compared with data collection during winter; this latter finding makes sense given the influence of sun exposure on vitamin D levels. An additional factor for this cohort is body size; > 80% of study participants had high BMI, and it is possible that the beneficial effects of the nutrients examined may be lessened or confounded by adverse effects of obesity or other correlated lifestyle factors. Strengths of this study include the fact that a variety of biomarkers measured, including multiple fatty acids, vitamin D and selenium. The study population was restricted to male anglers aged 50 years and older, and there was relatively little variation in demographic characteristics (e.g., race, socio-economic status) which should limit residual confounding and confounding by unmeasured or uncontrolled factors.
In conclusion, this analysis shows that fish consumption—namely Great Lakes fish and fish from areas of concern—is associated with higher levels of vitamin D. However, increased consumption may also lead to increased exposure to contaminants present in fish, such as mercury and polychlorinated biphenyls, and subsequent adverse health effects. Thus, the risks and benefits of fish consumption must be balanced when evaluating guidelines for older male anglers.
Supplementary Material
Acknowledgments
Funding/Support: The Research described in this article has been funded by the US Environmental Protection Agency Great Lakes National Program Office under Assistance no. GL-00E00452-0. It has not been subjected to the Agency’s required peer and policy review and therefore does not necessarily reflect the views of the Agency and no official endorsement should be inferred.
The authors would like to thank the University of Wisconsin-Madison Survey Center for their work with setting up and managing the online survey, as well as all the survey participants. We would also like to thank our partners including the Survey of the Health of Wisconsin (SHOW) program, in particular Christine McWilliams who served as the ancillary study coordinator for this project along with Susan Wright who assisted in overseeing field data collection. SHOW is funded by the Wisconsin Partnership Program PERC Award (233 PRJ 25DJ), the National Institutes of Health’s Clinical and Translational Science Award (5UL 1RR025011), and the National Heart Lung and Blood Institute (1 RC2 HL101468).
Footnotes
SAS/STAT software, Version 9.3 of the SAS System for Windows. Copyright © 2013 Institute Inc. SAS and all other SAS Institute Inc. product or service names are registered trademarks or trademarks of SAS Institute Inc., Cary, NC, USA
Review: The study was reviewed by the University of Wisconsin Human Subjects Review Board and determined to be exempt, as it was conducted for the purpose of public health research.
References
- Bjelakovic G, Gluud L, Nikolova D, Whitfield K, Krstic G, Wetterslev J, Gluud C. Vitamin D supplementation for prevention of cancer in adults. Cochrane Database of Systematic Reviews 2014. 2014;(6) doi: 10.1002/14651858.CD007469.pub2. Art. No.: CD007469. [DOI] [PMC free article] [PubMed] [Google Scholar]
- Bjelakovic G, Gluud L, Nikolova D, Whitfield K, Wetterslev J, Simonetti RG, Bjelakovic M, Gluud C. Vitamin D supplementation for prevention of mortality in adults. Cochrane Database of Systematic Reviews 2014. 2014;(1) doi: 10.1002/14651858.CD007470.pub3. Art. No.: CD007470. [DOI] [PMC free article] [PubMed] [Google Scholar]
- CDC. National Health and Nutrition Examination Survey Data. Hyattsville, MD: U.S. Department of Health and Human Services, Centers for Disease Control and Prevention; 2014. Centers for Disease Control and Prevention (CDC). National Center for Health Statistics (NCHS) 2011–2012. [Google Scholar]
- Chowdhury R, Stevens S, Gorman D, Pan A, Warnakula S, Chowdhury S, Ward H, Johnson L, Crowe F, Hu FB, Franco OH. Association between fish consumption, long chain omega 3 fatty acids, and risk of cerebrovascular disease: systematic review and meta-analysis. Bmj. 2012;345:e6698. doi: 10.1136/bmj.e6698. [DOI] [PMC free article] [PubMed] [Google Scholar]
- Connelly NA, Lauber TB, Niederdeppe J, Knuth BA. Factors Affecting Fish Consumption among Licensed Anglers Living in the Great Lakes Region. Dept of Nat. Resour., N.Y.S. Coll. Agric. And Life Sci., Cornell Univ; Ithaca, N.Y: 2012. p. 78. HDRU Publ. No. 12-3. Available at: http://www2.dnr.cornell.edu/hdru/pubs/fishpubs.html#risk. [Google Scholar]
- de Goede J, Verschuren WM, Boer JM, Kromhout D, Geleijnse JM. Gender-specific associations of marine n-3 fatty acids and fish consumption with 10-year incidence of stroke. PLoS One. 2012;7(4):e33866. doi: 10.1371/journal.pone.0033866. [DOI] [PMC free article] [PubMed] [Google Scholar]
- Dong Z, Jim RC, Hatley EL, Backus ASN, Shine JP, Spengler JD, Schaider LA. A longitudinal study of mercury exposure associated with consumption of freshwater fish from a reservoir in rural south central USA. Environmental Research. 2015;136:155–162. doi: 10.1016/j.envres.2014.09.029. [DOI] [PMC free article] [PubMed] [Google Scholar]
- Fehily AM, Burr ML, Phillips KM, Deadman NM. The effect of fatty fish on plasma lipid and lipoprotein concentrations. Am J Clin Nutr. 1983;38(3):349–351. doi: 10.1093/ajcn/38.3.349. [DOI] [PubMed] [Google Scholar]
- Harris WS. Fish oils and plasma lipid and lipoprotein metabolism in humans: a critical review. J Lipid Res. 1989;30:785–807. [PubMed] [Google Scholar]
- He K, Rimm EB, Merchant A, Rosner BA, Stampfer MJ, Willett WC, Ascherio A. Fish consumption and risk of stroke in men. JAMA. 2002;288(24):3130–3136. doi: 10.1001/jama.288.24.3130. [DOI] [PubMed] [Google Scholar]
- Imm P, Anderson HA, Schrank C, Knobeloch L. Fish consumption and advisory awareness among older Wisconsin fishermen. WMJ. 2013;112(3):111–116. [PubMed] [Google Scholar]
- Joensen AM, Schmidt EB, Dethlefsen C, Johnsen SP, Tjonneland A, Rasmussen LH, Overvad K. Dietary intake of total marine n-3 polyunsaturated fatty acids, eicosapentaenoic acid, docosahexaenoic acid and docosapentaenoic acid and the risk of acute coronary syndrome - a cohort study. Br J Nutr. 2010;103(4):602–607. doi: 10.1017/S0007114509992170. [DOI] [PubMed] [Google Scholar]
- Katan MB, Deslypere JP, van Birgelen AP, Penders M, Zegwaard M. Kinetics of the incorporation of dietary fatty acids into serum cholesteryl esters, erythrocyte membranes, and adipose tissue: an 18-month controlled study. J Lipid Res. 1997;38(10):2012–2022. [PubMed] [Google Scholar]
- Knobeloch L, Steenport D, Schrank C, Anderson H. Methylmercury exposure in Wisconsin: A case study series. Environ Res. 2006;101(1):113–122. doi: 10.1016/j.envres.2005.07.008. [DOI] [PubMed] [Google Scholar]
- Knobeloch L, Turyk M, Imm P, Schrank C, Anderson H. Temporal changes in PCB and DDE levels among a cohort of frequent and infrequent consumers of Great Lakes sportfish. Environ Res. 2009;109(1):66–72. doi: 10.1016/j.envres.2008.08.010. [DOI] [PubMed] [Google Scholar]
- Koenker R, Bassett G. Regression quantiles. Econometrica. 1978;46:33–50. [Google Scholar]
- Levitan EB, Wolk A, Mittleman MA. Fatty fish, marine omega-3 fatty acids and incidence of heart failure. Eur J Clin Nutr. 2010;64(6):587–594. doi: 10.1038/ejcn.2010.50. [DOI] [PMC free article] [PubMed] [Google Scholar]
- Neff MR, Bhavsar SP, Ni FJ, Carpenter DO, Drouillard K, Fisk AT, Arts MT. Risk-benefit of consuming Lake Erie fish. Environ Res. 2014;134:57–65. doi: 10.1016/j.envres.2014.05.025. [DOI] [PubMed] [Google Scholar]
- Nieto FJ, Peppard PE, Engelman CD, McElroy JA, Galvao LW, Friedman EM, Bersch AJ, Malecki KC. The Survey of the Health of Wisconsin (SHOW), a novel infrastructure for population health research: rationale and methods. BMC Public Health. 2010;10:785. doi: 10.1186/1471-2458-10-785. [DOI] [PMC free article] [PubMed] [Google Scholar]
- NIH. Dietary supplement fact sheet: Selenium. National Institutes of Health; Office of Dietary Supplements; 2015. Available at: https://ods.od.nih.gov/factsheets/Selenium-HealthProfessional/ [Google Scholar]
- NIH. Dietary supplement fact sheet: Vitamin D. National Institutes of Health; Office of Dietary Supplements; 2015. Available at: https://ods.od.nih.gov/factsheets/VitaminD-HealthProfessional/ [Google Scholar]
- NIH. Omega 3 Fatty Acids and Health Fact Sheet. National Institutes of Health; Office of Dietary Supplements; 2015. Available at: https://ods.od.nih.gov/factsheets/Omega3FattyAcidsandHealth-HealthProfessional/ [Google Scholar]
- NuChek. NuChek. 2015 Retrieved July 16, 2015, from http://www.nu-chekprep.com/home.htm.
- Rayman MP. The importance of selenium to human health. Lancet. 2000;356(9225):233–241. doi: 10.1016/S0140-6736(00)02490-9. [DOI] [PubMed] [Google Scholar]
- Rayman MP. Selenium and human health. Lancet. 2012;379(9822):1256–1268. doi: 10.1016/S0140-6736(11)61452-9. [DOI] [PubMed] [Google Scholar]
- Rees K, Hartley L, Day C, Flowers N, Clarke A, Stranges S. Selenium supplementation for the primary prevention of cardiovascular disease. Cochrane Database Syst Rev. 2013;1:CD009671. doi: 10.1002/14651858.CD009671.pub2. [DOI] [PMC free article] [PubMed] [Google Scholar]
- Roman M, Jitaru P, Barbante C. Selenium biochemistry and its role for human health. Metallomics. 2014;6(1):25–54. doi: 10.1039/c3mt00185g. [DOI] [PubMed] [Google Scholar]
- Salonen JT, Seppanen K, Nyyssonen K, Korpela H, Kauhanen J, Kantola M, Tuomilehto J, Esterbauer H, Tatzber F, Salonen R. Intake of mercury from fish, lipid peroxidation, and the risk of myocardial infarction and coronary, cardiovascular, and any death in eastern Finnish men. Circulation. 1995;91(3):645–655. doi: 10.1161/01.cir.91.3.645. [DOI] [PubMed] [Google Scholar]
- Sun Q, Ma J, Campos H, Hankinson SE, Hu FB. Comparison between plasma and erythrocyte fatty acid content as biomarkers of fatty acid intake in US women. Am J Clin Nutr. 2007;86(1):74–81. doi: 10.1093/ajcn/86.1.74. [DOI] [PubMed] [Google Scholar]
- Tinggi U. Selenium: its role as antioxidant in human health. Environ Health Prev Med. 2008;13(2):102–108. doi: 10.1007/s12199-007-0019-4. [DOI] [PMC free article] [PubMed] [Google Scholar]
- Turyk ME, Bhavsar SP, Bowerman W, Boysen E, Clark M, Diamond M, Mergler D, Pantazopoulos P, Schantz S, Carpenter DO. Risks and benefits of consumption of Great Lakes fish. Environ Health Perspect. 2012;120(1):11–18. doi: 10.1289/ehp.1003396. [DOI] [PMC free article] [PubMed] [Google Scholar]
- Vacek JL, Vanga SR, Good M, Lai SM, Lakkireddy D, Howard PA. Vitamin D deficiency and supplementation and relation to cardiovascular health. Am J Cardiol. 2012;109(3):359–363. doi: 10.1016/j.amjcard.2011.09.020. [DOI] [PubMed] [Google Scholar]
- von Lossonczy TO, Ruiter A, Bronsgeest-Schoute HC, van Gent CM, Hermus RJ. The effect of a fish diet on serum lipids in healthy human subjects. Am J Clin Nutr. 1978;31(8):1340–1346. doi: 10.1093/ajcn/31.8.1340. [DOI] [PubMed] [Google Scholar]
- Wang TJ, Pencina MJ, Booth SL, Jacques PF, Ingelsson E, Lanier K, Benjamin EJ, D’Agostino RB, Wolf M, Vasan RS. Vitamin D deficiency and risk of cardiovascular disease. Circulation. 2008;117(4):503–511. doi: 10.1161/CIRCULATIONAHA.107.706127. [DOI] [PMC free article] [PubMed] [Google Scholar]
- Wilk JB, Tsai MY, Hanson NQ, Gaziano JM, Djousse L. Plasma and dietary omega-3 fatty acids, fish intake, and heart failure risk in the Physicians’ Health Study. Am J Clin Nutr. 2012;96(4):882–888. doi: 10.3945/ajcn.112.042671. [DOI] [PMC free article] [PubMed] [Google Scholar]
- Zhang M, Picard-Deland E, Marette A. Fish and marine omega-3 polyunsatured Fatty Acid consumption and incidence of type 2 diabetes: a systematic review and meta-analysis. Int J Endocrinol. 2013;2013:501015. doi: 10.1155/2013/501015. [DOI] [PMC free article] [PubMed] [Google Scholar]
Associated Data
This section collects any data citations, data availability statements, or supplementary materials included in this article.