Abstract
In order to develop triple-resonance solid-state NMR spectroscopy of membrane proteins, we have implemented several different 13C labeling schemes with the purpose of overcoming the interfering effects of 13C–13C dipole–dipole couplings in stationary samples. The membrane-bound form of the major coat protein of the filamentous bacteriophage Pf1 was used as an example of a well-characterized helical membrane protein. Aligned protein samples randomly enriched to 35% 13C in all sites and metabolically labeled from bacterial growth on media containing [2-13C]-glycerol or [1,3-13C]-glycerol enables direct 13C detection in solid-state NMR experiments without the need for homonuclear 13C–13C dipole–dipole decoupling. The 13C-detected NMR spectra of Pf1 coat protein show a substantial increase in sensitivity compared to the equivalent 15N-detected spectra. The isotopic labeling pattern was analyzed for [2-13C]-glycerol and [1,3-13C]-glycerol as metabolic precursors by solution-state NMR of micelle samples. Polarization inversion spin exchange at the magic angle (PISEMA) and other solid-state NMR experiments work well on 35% random fractionally and metabolically tailored 13C-labeled samples, in contrast to their failure with conventional 100% uniformly 13C-labeled samples.
Keywords: solid-state NMR; isotopic labeling; [2-13C]-glycerol; [1, 3-13C]-glycerol; PISEMA; dipolar coupling; membrane protein; HETCOR
INTRODUCTION
Samples of peptides and proteins suitable for 1H/13C/15N triple-resonance experiments can be prepared by prokaryotic expression on chemically defined media, enabling the isotopic composition to be optimized for particular experiments. As a result, the vast majority of solution-state NMR and magic angle spinning (MAS) solid-state NMR studies of peptides and proteins involve triple-resonance experiments. The chemical shift and dipole–dipole interactions among these three spin S = 1/2 nuclei provide atomic-resolution information about molecular structures and dynamics. Solution-state NMR and MAS solid-state NMR are both ‘isotropic’ methods. In aqueous solutions the rapid global reorientation of the molecules averages the anisotropic spin interactions to their isotropic values, although weak alignment methods enable their reduced presence to be used for spectral analysis. In polycrystalline or disordered solid samples, mechanical rotation at the magic angle averages the spin interactions to their isotropic values, although recoupling methods can be used to analyze their anisotropic components.1,2 Triple-resonance methods are rarely employed in aligned-sample solid-state NMR even though the spectroscopic information from the same 1H/13C, and 15N labeled sites would be extremely valuable. The major difference between the feasibility of triple-resonance experiments in isotropic solution-state NMR and MAS solid-state NMR and in aligned-sample solid-state NMR is a consequence of the dense network of homonuclear 13C–13C dipole–dipole couplings that are present in molecules labeled in all sites with 13C.
In aligned-sample solid-state NMR, 13C detection would be highly desirable because of its relatively high sensitivity (compared to direct 15N detection); however, homonuclear 13C–13C dipole–dipole couplings interfere with obtaining high spectral resolution. In solution-state NMR, these couplings are averaged out along with the other spin interactions by the rapid reorientation of the molecules. Likewise, MAS is very effective at averaging out these relatively weak homonuclear dipole–dipole couplings. In principle, multiple-pulse methods3 developed for ‘abundant’ 1H and 19F nuclei could be applied during 13C detection on stationary samples of immobile peptides and proteins. In practice, the problem is that at the high resonance frequencies required for high sensitivity and chemical shift resolution, the 13C resonances are spread over a wide range of frequencies, and the pulse sequences are not capable of adequate performance with the relatively weak radiofrequency (B1) fields generated by the probes on lossy protein samples. Not only are there large intrinsic separations between carbonyl and aliphatic isotropic chemical shifts (30 kHz at 900 MHz) but also some of the 13C chemical shift tensors have large spans (e.g. 150 ppm for carbonyl and 190 ppm for aromatic carbons).
Broadly, there are two basic approaches to dealing with 13C–13C dipole–dipole couplings in aligned-sample solid-state NMR. One is to improve the bandwidth of the experiments through modifications to the pulse sequences and probes, and this is an active field of research and development. The other approach, which is described in this article, takes advantage of the opportunities for 13C detection without the need for homonuclear 13C–13C decoupling presented by protein samples with several different patterns of isotopic labeling that spatially isolate the 13C nuclei from each other. Markley and coworkers demonstrated the applicability of random fractional 13C labeling to reduce the impact of homonuclear couplings,4 and partial directed labeling through the use of [2-13C]-glycerol and [1,3-13C]-glycerol is now widely employed in MAS solid-state NMR of proteins.5 – 7
We utilize the membrane-bound form of the 46-residue major coat protein of the filamentous bacteriophage Pf1 (Pf1 coat protein) to demonstrate applications of these labeling strategies to aligned-sample solid-state NMR experiments. Since Pf1 infects Pseudomonas aeruginosa, a common laboratory bacterium, the coat protein is amenable to a wide range of isotopic labeling strategies and NMR experiments.8 – 10 The samples described in this article are concentrated solutions of protein-containing phospholipid bilayers; nonetheless, it is possible to obtain high-resolution solid-state NMR spectra due to the uniaxial alignment of the liquid crystalline phase of the bilayers in the static magnetic field provided by the NMR spectrometer and the rapid rotational diffusion of the protein about the bilayer normal.11
We have implemented several different labeling schemes to produce NMR samples with diluted 13C spin systems. In one type of sample, the proteins are 35% randomly 13C labeled in all backbone and side-chain carbon sites and 100% uniformly 15N labeled in all nitrogen sites. In another type of sample, either [2-13C]-glycerol or [1,3-13C]-glycerol is used as the carbon source in minimal media with 15N ammonium sulfate as the nitrogen source. The requirement for homonuclear 13C–13C decoupling while detecting 13C signals is avoided in the first case because of the low statistical probability of two 13C nuclei being bonded (and coupled) to each other. In the other cases, the labeled 13C sites are generally separated from other labeled sites as a result of the alternate site pattern of metabolic incorporation. The implementation of these and similar approaches to 13C labeling are essential, since most solid-state NMR experiments do not work with 100% uniformly 13C-labeled protein samples owing to interference from the 13C–13C homonuclear dipolar couplings.
RESULTS
The initial goals of the triple-resonance solid-state NMR experiments on aligned samples of proteins are to implement direct 13C detection in order to increase sensitivity, to resolve individual backbone resonances, in particular from 13Cα backbone sites, and to measure orientationally dependent 13C chemical shift and heteronuclear 1H–13C dipolar coupling frequencies as angular restraints for structure determination. Additional goals include the resolution and measurement of the orientationally dependent frequencies associated with the resonances from 13C-labeled side-chain sites, which will enable complete structure determination of proteins, and the development of systematic assignment methods that utilize the couplings and spatial proximity among the labeled 13C′/15N, and 13Cα sites in the polypeptide backbone.
Verification of isotopic labeling
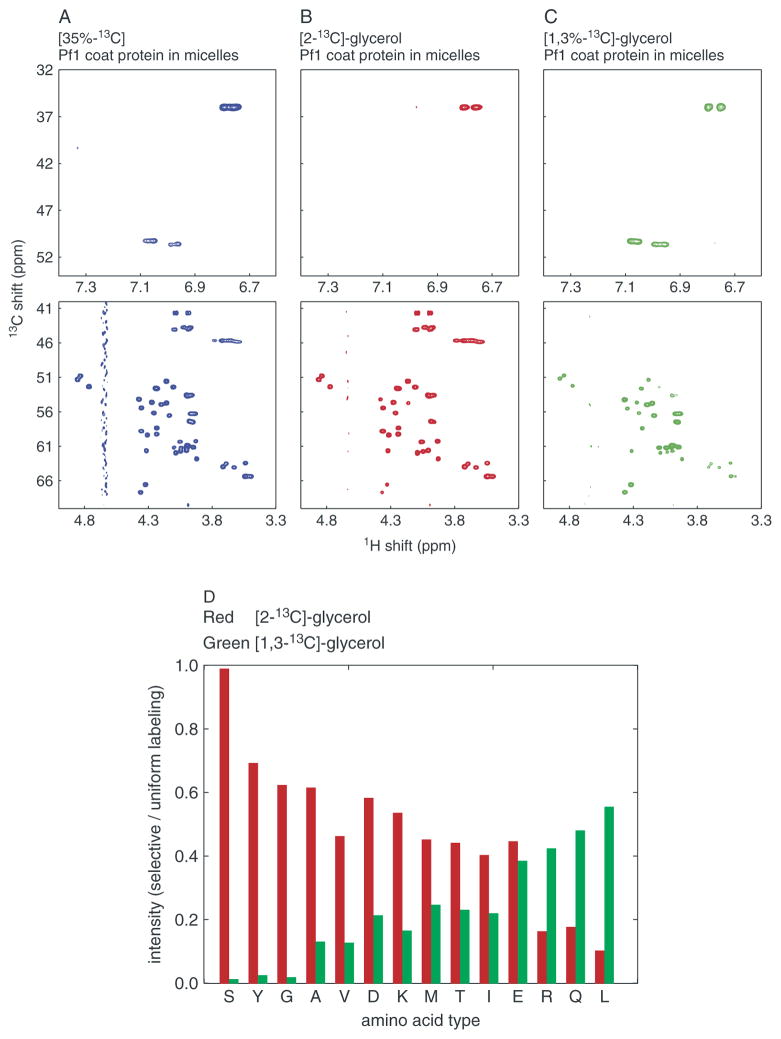
The first step was to verify the isotopic labeling in the protein samples obtained by growing Pf1 bacteriophage-infected bacteria on 13C- and 15N-labeled media designed to provide complete, random fractional, or tailored incorporation of 13C into the protein. The NMR spectra in the figures are color-coded to indicate the labeling patterns for 100% uniform 13C, 35% random fractionally 13C, and tailored metabolic labeling with [2-13C]-glycerol or [1,3-13C]-glycerol, respectively. Because the solution-state NMR spectra of the membrane-bound form of Pf1 coat protein in micelles are fully resolved and assigned, they provided a direct way to analyze the distribution of 13C in the protein. In order to verify that the protein samples were indeed labeled in the expected locations, two-dimensional 1H/13C heteronuclear single quantum correlation (HSQC) solution-state spectra were obtained from samples of the labeled Pf1 coat proteins in micelles. The 1H/13C correlation spectrum of the 35% randomly 13C-labeled sample shows resonances from all Cα, aliphatic, and aromatic carbon sites and serves as a reference, since the intensity of each signal is related to the same random labeling ratio. In contrast, the signal intensities observed in the spectra of samples prepared from growths on media containing either [2-13C]-glycerol or [1,3-13C]-glycerol vary widely, and reflect the relative levels of isotopic labeling at individual sites. The spectral regions containing resonances from aromatic and Cα sites are shown in Fig. 1(A)–(C). The intensity for each 13Cα signal was measured, and the average values for each type of amino acid were normalized and plotted in Fig. 1(D) as a quantitative indicator of the labeling. For example, the labeling varies from nearly 100% incorporation of 13C into the Cα position of glycine, serine, and tyrosine to less than 10% incorporation into that of leucine from the medium containing [2-13C]-glycerol.
Figure 1.
Analysis of 13C labeling patterns. (A)–(C) Two-dimensional 1H/13C-HSQC solution-state NMR spectra of Pf1 coat protein in micelles. The top row shows the (aliased) correlation resonances from the aromatic carbons of the two tyrosine residues in the protein; the bottom row contains the correlation resonances from all of the alpha carbons in the protein: (A) 35% random fractional 13C Pf1 coat protein (left, blue); (B) metabolic labeling from [2-13C]-glycerol (middle, red); or from (C) [1,3-13C]-glycerol (right, green). (D) Relative signal intensity of α-carbons of different amino acids. The resonance intensities in the 1H/13C-HSQC spectra from [2-13C]-glycerol Pf1 coat protein (red) and [1,3-13C]-glycerol (green) are plotted as ratios relative to those of a uniformly 13C-labeled sample 13C Pf1 coat protein.
The 13C labeling patterns in the [2-13C]-glycerol-Pf1 coat protein and [1,3-13C]-glycerol-Pf1 coat protein samples are complementary; most 13Cα sites labeled by [2-13C]-glycerol are not labeled by [1,3-13C]-glycerol, and vice versa. This has been demonstrated in earlier applications of this approach to isotopic labeling in Escherichia coli,5 – 7 and can be readily observed in the spectra of Pf1 coat protein in micelles obtained from Pseudomonas aeruginosa by comparing signal intensities (Fig. 1). Similar plots can be generated for all of backbone and side-chain carbon sites in the protein from assigned solution-state NMR spectra.
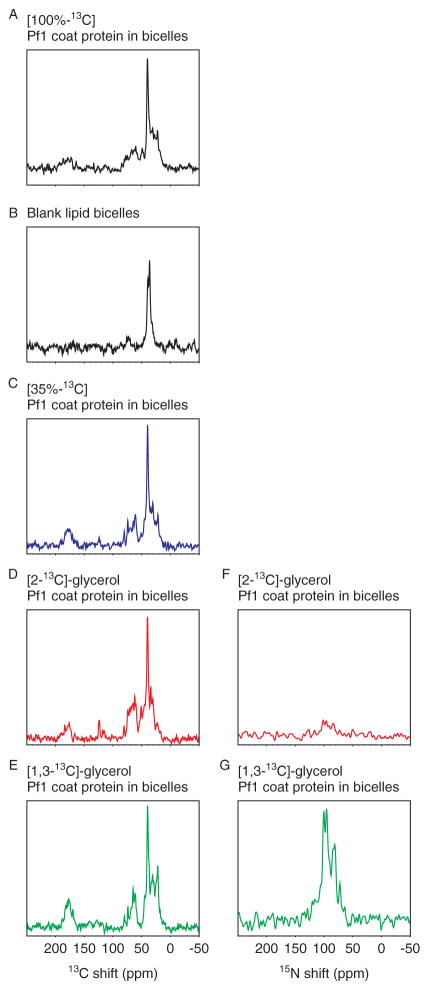
The 13C labeling patterns are reflected in the signal intensities observed in the one-dimensional solid-state NMR spectra obtained by cross-polarization (Fig. 2). Because of the strong influence of the 13C–13C homonuclear dipole–dipole couplings, there is no simple relationship between the extent or type of 13C labeling and the resolution and sensitivity of the spectra. For example, the spectrum obtained from a 100% uniformly 13C-labeled sample (Fig. 2(A)) has lower signal intensity and poorer spectral resolution than the spectrum that was obtained from a sample containing one-third the amount of 13C (Fig. 2(C)). The samples contain Pf1 coat protein in magnetically aligned phospholipid bilayers (bicelles), which consist of DMPC and DHPC in a molar ratio (q) of 3.2. The spectrum of a ‘blank’ bicelle without protein indicates that the narrow resonance intensity near 45 ppm and a smaller, broader component near 75 ppm are from the lipids (Fig. 2(B)). Since all the samples contain the same amounts of protein and lipid, the signal at 45 ppm serves as an internal reference for intensity comparisons. In contrast to the 35% random fractionally labeled sample (Fig. 2(C)), [2-13C]-glycerol-Pf1 coat protein (Fig. 2(D)) has relatively high overall labeling of the alpha-carbons but significantly lower levels of labeling of carbonyl and aliphatic side-chain carbons. [1,3-13C]-glycerol-Pf1 coat protein (Fig. 2(E)) has more extensive labeling of the side-chain methyl carbons.
Figure 2.
One-dimensional, fully decoupled 13C and 15N solid-state NMR spectra of the membrane-bound form of Pf1 coat protein in magnetically aligned bicelles. (A)–(E) The left column shows 13C NMR spectra of 13C/15N-labeled aligned bicelle samples resulting from signal averaging of 8 scans: (A). [100% U-13C]-Pf1 coat protein (black); (B) ‘blank’ bicelle without protein; (C) 35% random fractional 13C Pf1 coat protein (blue); (D) [2-13C]-glycerol Pf1 coat protein (red); (E) [1,3-13C]-glycerol Pf1 coat protein (green). (F)–(G) The right column shows corresponding 15N NMR spectra at similar number of scans or comparable signal-to-noise ratios. (F) [2-13C]-glycerol Pf1 coat protein from 8 scans. (G) [1,3-13C]-glycerol Pf1 coat protein from 128 scans. The free induction decays are zero-filled to 2 K data points and multiplied by an exponential weighting function corresponding to 125 Hz prior to Fourier transformation.
The effects of the 13C–13C dipole–dipole couplings and the specificity of the isotopic labeling on the spectra are readily appreciated in the expanded plots of the aromatic spectral regions shown in Fig. 3. Pf1 coat protein has two tyrosines and no other aromatic residues, and both the solution-state NMR spectra (Fig. 1(A)–(C)) and the solid-state NMR spectra (Fig. 3) are relatively straightforward to interpret. As expected, only the ε-ring carbons are labeled in [2-13C]-glycerol-Pf1 coat protein (Figs 1(B) and 3(C)). If both rings undergo rapid 180° flip motions, as observed in other proteins by solid-state NMR,12 – 14 then only two signals would be expected. Instead, in the solid-state 13C NMR spectrum of [2-13C]-glycerol-Pf1 coat protein there are three resonances (Fig. 3(C)), one of which has twice the intensity of the other two, indicating that at least one of the tyrosine rings is immobile on the timescale of the chemical shift interaction. The spectrum from 100% uniformly 13C-labeled Pf1 coat protein contains no recognizable signals from the tyrosine side chains because of the broadening effects of the 13C–13C dipole–dipole couplings (Fig. 3(A)). In contrast, the spectrum in Fig. 3(B) from a sample with all the same sites labeled, but only to a random fractional level of 35%, contains at least seven discrete signals between 100 and 160 ppm. The media containing [2-13C]-glycerol or [1,3-13C]-glycerol provide complementary labeling schemes for the tyrosine ring positions,6 simplifying the interpretation of the spectral data (Figs 1(B), (C) and 3(C), (D)). Bicelles align perpendicular to the direction of the applied magnetic field, and high-resolution solid-state NMR spectra can be obtained because the protein undergoes rotational diffusion about the bilayer normal. It is possible to ‘flip’ the bicelles 90°, so that their bilayer normals are parallel to the field, by adding a small amount of lanthanide ions.15 The spectra of [2-13C]-glycerol Pf1 coat protein in both ‘unflipped’ (bilayer normal perpendicular to the field) and ‘flipped’ (bilayer normal parallel to the field) bicelles each show two tyrosine ε-carbon resonances (Fig. 3(C) and (D)). The resonance frequencies in these samples are related to each other by their isotropic chemical shifts and to the order parameter of −0.5 for the perpendicular bicelles, which assists in their assignment to specific residues in the protein.16
Figure 3.

High-resolution 13C solid-state NMR aromatic region. (A)–(D) The 13C aromatic region of Pf1 coat protein in magnetically aligned bicelles is compared for 100% uniformly 13C labeled Pf1 coat protein aligned bicelle sample with diluted 13C-labeling approaches. Isolated resonances can be analyzed with an assignment strategy using the isotropic chemical shift. (A) In the 100% uniformly 13C-labeled sample (black) the aromatic region is only poorly resolved. (B) The 35% random fractional 13C-labeled sample (blue) shows the overlapping aromatic region; (C) Isolated spin systems of tyrosine Cε sites are visible in the [2-13C]-glycerol-labeled sample (red); (D). The tyrosine Cε resonances of the [2-13C]-glycerol-labeled sample in perpendicular bicelles (magenta) ‘flip’ around the isotropic chemical shift in the presence of lanthanide ions (16). All spectra are recorded at 512 scans and the proton carrier at 7.0 ppm.
13C vs 15N detection
One-dimensional 13C-detected and 15N-detected NMR spectra obtained by conventional single-contact cross-polarization from the same sample of [2-13C]-glycerol-Pf1 coat protein are compared in Fig. 2(D) and (F). Signals corresponding to individual 13C-labeled sites can be observed in the 13C NMR spectrum in Fig. 2(D), which was obtained in less than 1 min from signal-averaging eight scans on a 500 MHz NMR spectrometer. In contrast, the same amount of signal-averaging gives barely recognizable signal intensity in the 15N NMR spectrum (Fig. 2(F)) using the same sample, probe, and spectrometer. In general, 13C NMR spectra obtained under equivalent conditions have 4 times greater sensitivity,17 and the 15N NMR spectrum resulting from the signal-averaging of 128 scans (Fig. 2(G)) has about the same signal-to-noise ratio as the 13C NMR spectra from eight scans, confirming the four-fold gain in signal-to-noise ratio for each acquisition.
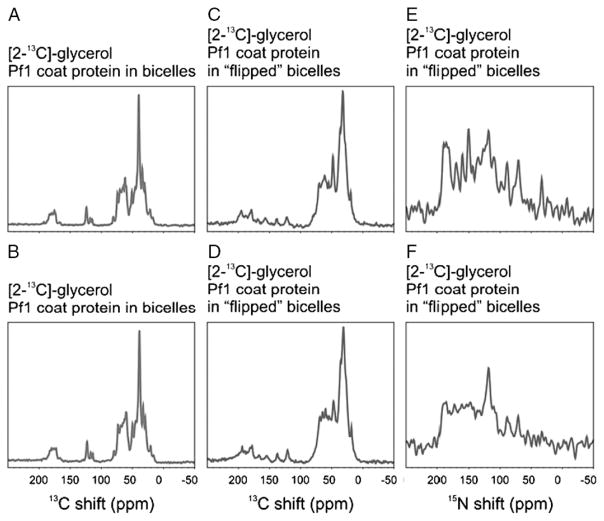
The effects of heteronuclear 13C–15N dipole–dipole couplings must be taken into account in the analysis of the one-dimensional NMR spectra as well as in the design and implementation of multidimensional NMR experiments on double-labeled proteins. We have obtained both 13C and 15N NMR spectra from [2-13C]-glycerol-Pf1 coat protein with 1H decoupling (Fig. 4). For comparison, the 13C NMR spectra were obtained with (Fig. 4(A) and (C)) and without (Fig. 4(B) and (D)) 15N decoupling; the effects of the 15N couplings can be discerned on both the carbonyl (170 ppm) and alpha-carbon (70 ppm) regions of the spectra. The effects are more dramatic, however, in the 15N NMR spectra (Fig. 4(E) and (F)) where 13C decoupling results in substantial changes of intensity and apparent resolution. These results demonstrate that the magnitudes of the 13C–15N heteronuclear dipole–dipole couplings in aligned samples of membrane proteins are large enough for many triple-resonance experiments.
Figure 4.
Comparisons of ‘flipped’ and ‘unflipped’ bicelles and the effects of decoupling on the NMR spectra. (A)–(F) The extent of 13C–15N heteronuclear couplings is analyzed by decoupling of the nondetected heteronucleus for uniform 15N and tailored 13C labeling with [2-13C]-glycerol. 13C solid-state spectra are recorded for Pf1 coat protein in ‘flipped’ and ‘unflipped’ magnetically aligned bicelles: (A) and (B) 13C NMR spectra of [2-13C]-glycerol labeled Pf1 coat protein in aligned ‘unflipped’ bicelles; (C) and (D).13C NMR spectra of [2-13C]-glycerol labeled Pf1 coat protein in ‘flipped’ bicelles in the presence of lanthanide ions; (E) and (F) 15N NMR spectra of [2-13C]-glycerol labeled Pf1 coat protein in ‘flipped’ bicelles. The spectra in the upper row are recorded with decoupling of the nondetected nuclei; (A) and (C) are {1H} and {15N} decoupled; (E) is {1H} and {13C} decoupled. The spectra in the lower row are only {1H} decoupled during detection.
Triple-resonance experiments
The principal two-dimensional triple-resonance solid-date NMR experiments focus on heteronuclear dipolar couplings and heteronuclear chemical shift correlations (Fig. 5). The triple-resonance 13C-detected version of polarization spin exchange at the magic angle (PISEMA)18 correlates the heteronuclear dipolar coupling from a pair of directly bonded 1H and 13C with the 13C chemical shift (Fig. 5(A)). The triple-resonance version of this experiment differs from the double-resonance version only in that radiofrequency irradiation is applied to the undetected nucleus, in this case 15N, with low power during the t1 period, and with high power during the t2 period while the 13C signals are detected. In the 13C/15N heteronuclear correlation (HETCOR) experiment, the 15N and 13C chemical shift frequencies evolve while 1H is decoupled (Fig. 5(B)).
Figure 5.
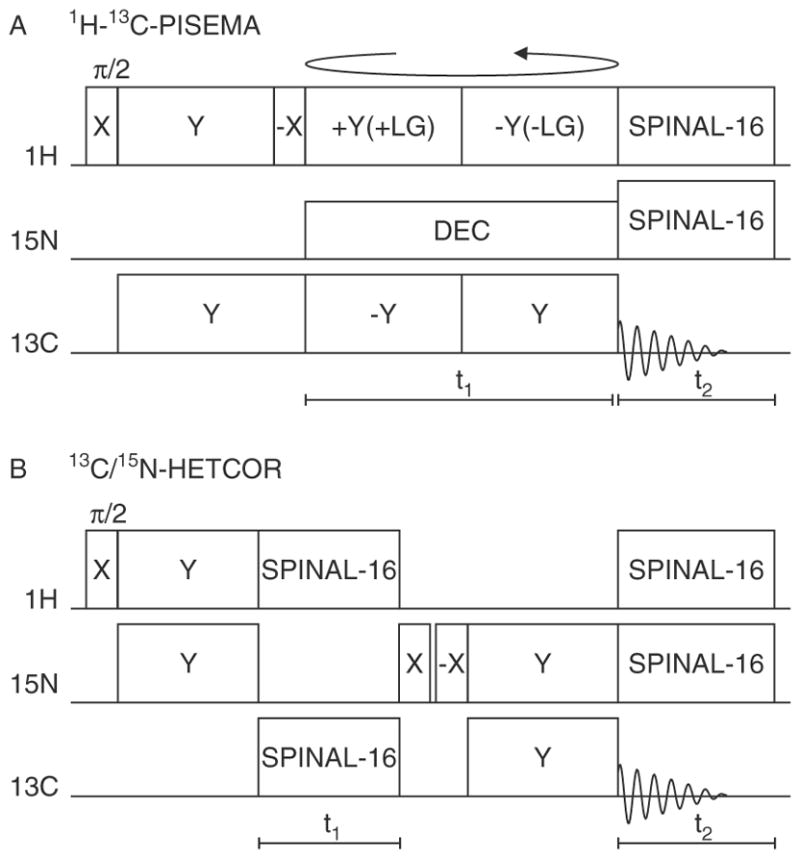
Timing diagrams for two-dimensional triple-resonance solid-state experiments. (A) 1H–13C PISEMA. This pulse sequence is for 15N-decoupled 13C-detected PISEMA. Y + LG denotes a +Y phase and positive frequency jump to satisfy the Lee-Goldburg condition, and continuous wave 15N irradiation with a lower power level was applied during the t1 interval and SPINAL-16-modulated irradiation during the t2 interval. (B) 13C/15N HETCOR chemical shift correlation experiment. The pulse sequence consists of cross-polarization of 15N magnetization from 1H followed by 15N chemical shift evolution during t1 in presence of 13C and 1H SPINAL-16 decoupling. The two 90° pulses with appropriate phases select 15N magnetization for states detection. The evolved 15N magnetization is transferred to 13C by cross-polarization during flip flop MOIST sequence. During the MOIST sequence, the phase of the contact pulse on the 13C and 15N channel are flipped alternatively by 180°. The 13C magnetization is detected during t2 period in presence of 1H and 15N SPINAL-16 decoupling. The first 90° pulse on the 1H channel and the receiver phase are cycled for spin temperature inversion.
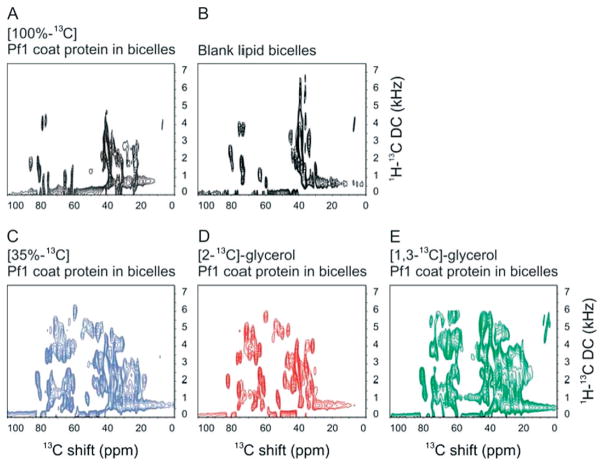
In Fig. 6, the two-dimensional 1H–13C PISEMA spectra of four different 13C- and 15N-labeled samples of Pf1 coat protein in magnetically aligned bilayers are compared to that from a ‘blank’ bicelle sample containing only phospholipids. In the 100% uniformly 13C-labeled sample (Fig. 6(A)) the strong 13C–13C homonuclear couplings interfere with the PISEMA experiment and, with the exception of some methyl carbon signals near 25 ppm, there is essentially no intensity from protein resonances compared to the bicelle reference spectrum (Fig. 6(B)). In contrast, all the samples with diluted or tailored 13C labeling yield resolved PISEMA spectra (Fig. 6(C)–(E)). As indicated by Fig. 1, all the alpha-carbon resonances are present in the 35% uniformly labeled sample. The spectra from [2-13C]-glycerol and [1,3-13C]-glycerol Pf1 coat protein are complementary, owing to the specific metabolic labeling pattern of the glycerol precursors (Fig. 1(D)). There is notably more intensity from aliphatic side-chain carbons in the spectrum obtained from the [1,3-13C]-glycerol owing to the labeling pattern.
Figure 6.
Two-dimensional 1H–13C PISEMA spectra of membrane-bound Pf1 coat protein in magnetically aligned bicelles. (A)–(E) The Cα and aliphatic region of different bicelle samples is compared in 1H–13C PISEMA spectra: (A) 100% uniformly 13C-labeled sample (black); (B) ‘Blank’ bicelle sample without protein; (C) 35% random fractional 13C-labeled sample (blue); (D) [2-13C]-glycerol-labeled sample (red); (E) [1,3-13C]-glycerol-labeled sample (green); The protein samples are uniformly 15N labeled with different 13C labeling schemes. All spectra resulted from signal-averaging of 192 scans and 64 points in the indirect dimension. The experimental data were zero-filled to 2 K and 4 K data points in the direct and indirect dimension, respectively, and multiplied by a sine bell window function before Fourier transformation.
The 13C/15N HETCOR experiment links the 13C chemical shift dimension of the 1H–13C PISEMA spectrum with the 15N chemical shift dimension of the 1H–15N PISEMA spectrum, as shown in Fig. 7. The set of triple-resonance experiments was performed on a single sample of [2-13C]-glycerol-Pf1 coat protein in magnetically aligned ‘flipped’ parallel bicelles. Most, but not all, of the protein backbone sites have large enough 13C–15N dipolar couplings for spectral correlation in the ‘flipped’ bicelle sample. Fewer resonances are observed in 13C–15N HETCOR spectra obtained from ‘unflipped’ bicelle samples where the 13C–15N heteronuclear dipole–dipole couplings are only half as large. The comparison between the 13C/15N HETCOR and the 1H–13C PISEMA spectra (Fig. 7(B) and (C)) shows that the alpha-carbon signals occur between 45 ppm and 80 ppm, since they are the only aliphatic carbon signals from sites bonded to 15N. In Fig. 7, the 1H–15N PISEMA spectrum (Fig. 7(A)) is aligned with the 15N chemical shift dimension of the 13C/15N HETCOR spectrum, and the 1H–13C PISEMA spectrum is aligned with the 13C chemical shift dimension of the 13C/15N HETCOR spectrum. This combination fully characterizes the resonances from the labeled backbone sites of the protein. The next step is the implementation of three-dimensional triple-resonance experiments on 13C/15N labeled proteins17
Figure 7.
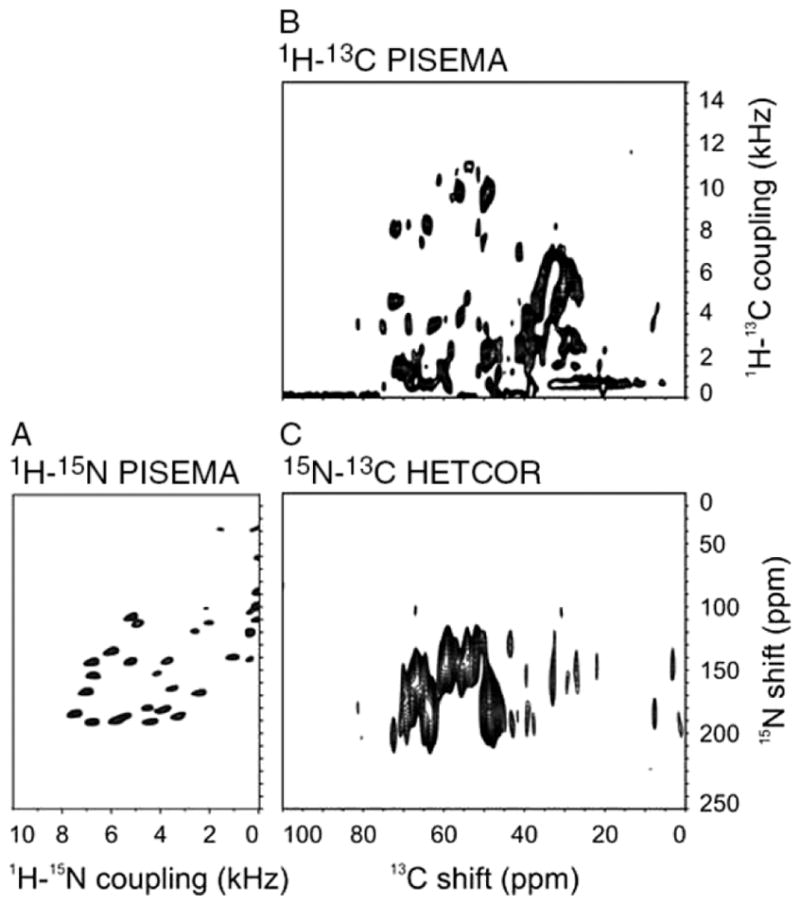
Connectivity between two-dimensional PISEMA and HETCOR spectra. Two-dimensional NMR spectra of 1H–15N and 1H/13C heteronuclear dipolar couplings are plotted so that their chemical shift dimension is linked via the 13C/15N HETCOR heteronuclear chemical shift correlation spectrum: (A) 1H–15N PISEMA spectrum; (B) 1H/13C PISEMA spectrum; (C) 13C/15N HETCOR spectrum.
DISCUSSION
Triple-resonance approaches have many advantages over double-resonance approaches to NMR studies of proteins. This is fully demonstrated in the standard practices of solution-state NMR and MAS solid-state NMR. The implementation of triple-resonance experiments has lagged in aligned-sample solid-state NMR because the effects of the 13C–13C homonuclear dipole–dipole couplings are difficult to deal with because of the very large bandwidth requirements for high-field 13C experiments. Without intervention, the broadening effects result in spectra with poor resolution, which are unresponsive to many of the most useful pulse sequences. In this article, we demonstrate that progress can be made towards triple-resonance spectroscopy of membrane proteins in phospholipid bilayers by combining tailored 13C labeling with complete 15N labeling.
In contrast to solution-state NMR where a large sensitivity enhancement results from the combination of high efficiency and specificity of heteronuclear polarization transfer and the narrow linewidths of 1H NMR resonances, direct detection of 13C and 15N signals is used in solid-state NMR because of the relative ease of heteronuclear decoupling of the 1H resonance. The sensitivity enhancement due to 13C detection relative to 15N detection is predicted to be (γ13C/γ15N)2/3 = 4 if all other factors are the same. Thus, the approximately fourfold increase in signal-to-noise ratios that we observe experimentally is consistent with expectations. Since the amount of time spent in signal-averaging is decreased by the square of the sensitivity enhancement, or a factor of 16, this improvement in sensitivity has the potential to transform the way the experiments are designed and performed. For example, this will enable three-dimensional experiments to be used in situations where only two-dimensional experiments were previously feasible. It also means that the samples will be exposed to less high-power radiofrequency irradiation with its attendant risks of heating and protein degradation.
The expanded aromatic regions of the spectra in Fig. 3 clearly illustrate the gains in resolution that accompany use of alternative 13C labeling schemes. Simply diluting the 13C labeling to 35% of the sites yields fully resolved spectra, and the complementary spectra from [2-13C]-glycerol-labeled protein in perpendicular and parallel alignments of the bicelles demonstrate the selection of the resonances.
The accessibility of resonances from nearly all aliphatic and aromatic carbon sites in the proteins means that complete structure determinations will be feasible. The results presented here focus on the alpha-carbon sites because of the comparisons that can be made to the well-studied amide nitrogen sites. However, the results on the aromatic side chains in Fig. 3 demonstrate some of the general aspects of studies of the side chains.
EXPERIMENTAL
Sample preparation
Uniformly 15N-labeled Pf1 and uniformly 13C/15N-labeled Pf1 samples were obtained using conventional methods, which include 15N-labeled ammonium sulfate and uniformly 13C-labeled glucose as the sole nitrogen and carbon sources in the minimal media. 35% random fractional 13C labeling was obtained by cultivating cells in Bio-Express Cell Growth Media (Cambridge Isotope Laboratories, Andover, MA). Two selectively 13C-labeled samples were obtained by supplementing the growth media with [2-13C]-glycerol or [1,3-13C]-glycerol as the sole carbon source.
Pseudomonas aeruginosa was inoculated into a 50 ml LB culture with a stab of the stock cells and grown overnight at 280 rpm, 310 K. The next day, the culture was diluted 40 fold into a 2 l baffled flask with 1 l of M9 minimal media comprising 11 g/l Na2HPO4, 0.5 g/l NaCl, 1 g/l MgSO4•7H2O, 0.025 g/l CaCl2.2H2O, 0.1 g/l thiamine hydrochloride, 10 ml/l 100X MEM vitamin solution (Sigma M6895), and 1 g/l (15NH4)2SO4 (Cambridge Isotope Laboratories, Andover, MA). The uniformly 15N/13C-labeled sample was prepared using 2 g/l 13C-dextrose as unique source of carbon. The [2-13C]-glycerol and [1,3-13C] glycerol samples were prepared the same way as above; however, they contained 2 g/l of the respectively labeled glycerol (Cambridge Isotope Laboratories, Andover, MA) as the only carbon source and 1 g/l (15NH4)2SO4 as the only nitrogen source. NaH12CO3 was added to suppress recycling of decarboxylated 13CO2.19
The cells were grown to mid-logarithmic phase (OD600 = 0.4) at 310 K and infected with 0.5% phage stock, on the basis of infectivity determined by plaque assay. After overnight growth, the cells were then spun down at 8000 rpm for 20 min at 277 K. The supernatant was retained and 0.5 M NaCl, 4% (w/v) polyethylene glycol (PEG 8000) added and left overnight at 277 K. The phage was pelleted by centrifugation at 13 000 rpm for 20 min at 277 K. The phage was resuspended in 60 ml/l growth TE buffer, pH 8.0 (10 ml 1 M Tris pH 8.0, 2 ml 0.5 M EDTA) to a final volume of 1 l, the supernatant cleared by centrifugation at 15 000 rpm for 20 min at 277 K and incubated overnight in 0.25 (w/v) PEG 8000 and 2.5 M NaCl at 277 K. The phage precipitate was pelleted by centrifugation at 15 000 rpm for 20 min at 277 K and resuspended in 7.5 ml 5 mM Na2B4O7•10H2O, 1 mM NaN3 buffer, pH 8.0 by incubation overnight. The concentration of the resulting solution was measured and adjusted to 1 mg of CsCl per 1 ml of solution for CsCl gradient ultracentrifugation at 70 000 rpm at 288 K for 5 h in Beckman ultracentrifuge bottles (OptiSeal tubes, Beckman 362185) in a Beckman NVT90 rotor. In the CsCl gradient the phage was visible one-third of the way down in the centrifuge tubes as a faint blue band. The band was collected with a short Pasteur pipette and dialyzed in a 10 kDa membrane against 4 l of 5 mM Na2B4O7•10H2O, 0.5 M NaCl buffer, pH 8.0 for 24 h. The sample was dialyzed twice against 5 mM Na2B4O7•10H2O, 1 mM NaN3 buffer, pH 8.0 for 12 h and ultracentrifuged at 50 000 rpm for 2 h at 277 K. The pellet was resuspended in 5 mM Na2B4O7•10H2O, 1 mM NaN3 buffer, pH 8.0 at a 1 : 1 ratio and resuspended overnight.
NMR sample preparation
Solution-state NMR samples were prepared by dissolving the purified peptide in 400 μl of 500 mM deuterated SDS (Cambridge Isotope Laboratories) micelles, 40 mM NaCl, 10% (v/v) 2H2O at pH 4.0. Solid-state NMR samples were prepared by dissolving the peptide in an aqueous solution containing short-chain lipids, DHPC, and then adding this solution to a dispersion of long-chain lipids, DMPC, in water. The lipids were purchased from Avanti Polar Lipids (Alabaster, AL). The bicelle sample for a molar ratio of q = 3.2 and a lipid concentration of 28% (w/v) was about 300 mM in DMPC in a 180 μl volume at pH 6.7. Parallel bicelles were pre-pared by adding YbCl3•6H2O (Sigma, St. Louis, MO) with a final concentration of 3 mM. A flat-bottomed NMR tube with 5 mm outer diameter (New Era Enterprises, Vineland, NJ) was filled with 160 μl of the bicelle solution and the tube was sealed with a silicon cap to avoid the background 13C signal.
NMR spectroscopy
The solid-state NMR experiments were performed on a Varian Inova spectrometer with 1H/13C and 15N frequencies at 500.125, 125.76, and 50.68 MHz, respectively, equipped with a home-built triple-resonance probe. The power levels on the three channels were 50 kHz for all the experiments. PISEMA was utilized for the separated local field experiments because its cycle time was short enough to sample the large frequencies of 1H–13C dipolar couplings in ‘flipped’ bicelles samples with the bilayer normals parallel to the field, for example in Fig. 7(B) with the 1H carrier frequency at 4.5 ppm. 13C and 15N frequencies were calibrated with adamantane and ammonium sulfate as external references. All spectra were recorded at 500 MHz at 315 K. The two-dimensional solid-state spectra were acquired with 64 points in t1 and 480 complex points in t2 unless stated otherwise. The recycle delay was 6 s for each scan, and the data were zero-filled in t1 to 2 K and in t2 to 4 K data points and multiplied by a sine-bell window function in each dimension before double Fourier transformation unless stated otherwise.
The solution NMR experiments were performed on a Bruker DRX 600 MHz spectrometer equipped with a 5 mm triple-resonance cryogenic probe and z-axis gradient at 313 K. All heteronuclear NMR experiments for the assignment were performed on the uniformly 15N-labeled or 13C and 15N-doubly labeled samples with a protein concentration of 1 mM. The resonance assignments for the solution NMR spectra were obtained from a combination of two-dimensional 1H/15N-Nuclear Overhauser effect spectroscopy (NOESY)-HSQC, three-dimensional 1H/15N-NOESY-HSQC, and three-dimensional HNCA experiments. The 15N-edited NOESY-HSQC with a mixing time of 200 ms spectra was obtained on uniformly 15N-labeled samples. The HNCA spectrum was acquired with 2048 (t3), 64 (t2), and 128 (t1) complex points. 1H/13C-HSQC spectra were obtained on the samples grown on 100% 13C, 35% 13C, [2-13C]-glycerol, and [1,3-13C]-glycerol. 13C chemical shift was referenced indirectly by referring to the proton shift of DSS. The NMR data was processed using the programs NMRPipe/NMRDraw and NMRView.
Acknowledgments
This research was supported by grants RO1EB001966 and RO1GM075877, and utilized the Biomedical Technology Resource for NMR Molecular Imaging of Proteins, which is supported by grant P41EB002031. F.V.F. is supported by an EMBO Long Term Fellowship (ALTF 214-2007).
References
- 1.Takegoshi K, Takehiko T. Solid State Nucl Magn Reson. 1999;13:203. doi: 10.1016/s0926-2040(99)00005-3. [DOI] [PubMed] [Google Scholar]
- 2.Chan JCC, Tycko R. J Chem Phys. 2003;118:8378. [Google Scholar]
- 3.Waugh JS, Huber LM, Haeberlen U. Phys Rev Lett. 1968;20:180. [Google Scholar]
- 4.Stockman BJ, Westler WM, Darba P, Markley JL. J Am Chem Soc. 1988;110:4095. doi: 10.1021/ja00226a057. [DOI] [PubMed] [Google Scholar]
- 5.Hong M. J Magn Reson. 1999;139:389. doi: 10.1006/jmre.1999.1805. [DOI] [PubMed] [Google Scholar]
- 6.Castellani F, Van Rossum B, Diehl A, Schubert M, Rehbein K, Oschkinat H. Nature. 2002;420:98. doi: 10.1038/nature01070. [DOI] [PubMed] [Google Scholar]
- 7.Wylie BJ, Sperling LJ, Frericks HL, Shah GJ, Frauks WT, Reinstra CM. J Am Chem Soc. 2007;129:5218. doi: 10.1021/ja0701199. [DOI] [PubMed] [Google Scholar]
- 8.Lee S, Meshleh MF, Opella SJ. J Biomol NMR. 2003;26:327. doi: 10.1023/a:1024047805043. [DOI] [PubMed] [Google Scholar]
- 9.Thiriot DS, Nevzorov AA, Zagyananskiy L, Wu CH, Opella SJ. J Mol Biol. 2004;341:869. doi: 10.1016/j.jmb.2004.06.038. [DOI] [PubMed] [Google Scholar]
- 10.Goldbourt A, Day LA, McDermott AE. J Magn Reson. 2007;189:157. doi: 10.1016/j.jmr.2007.07.011. [DOI] [PubMed] [Google Scholar]
- 11.De Angelis AA, Nevzorov AA, Park SH, Howell SC, Mrse AA, Opella SJ. J Am Chem Soc. 2004;126:15340. doi: 10.1021/ja045631y. [DOI] [PubMed] [Google Scholar]
- 12.Kinsey RA, Kintanar A, Oldfield E. J Biomol NMR. 1981;256:9028. [PubMed] [Google Scholar]
- 13.Torchia DA. Annu Rev Biophys Bioeng. 1984;3:125. doi: 10.1146/annurev.bb.13.060184.001013. [DOI] [PubMed] [Google Scholar]
- 14.Opella SJ. Methods Enzymol. 1986;131:327. doi: 10.1016/0076-6879(86)31048-6. [DOI] [PubMed] [Google Scholar]
- 15.Prosser RS, Hunt SA, DiNatale JA, Vold RR. J Am Chem Soc. 1996;118:269. [Google Scholar]
- 16.De Angelis AA, Howell SC, Opella SJ. J Magn Reson. 2006;183:329. doi: 10.1016/j.jmr.2006.08.016. [DOI] [PubMed] [Google Scholar]
- 17.Sinha N, Grant CV, Park SH, Brown JM, Opella SJ. J Magn Reson. 2007;186:51. doi: 10.1016/j.jmr.2007.01.014. [DOI] [PMC free article] [PubMed] [Google Scholar]
- 18.Wu CH, Ramamoorthy A, Opella SJ. J Magn Reson. 1994;A109:270. [Google Scholar]
- 19.LeMaster DM, Kushlau DH. J Am Chem Soc. 1996;118:9255. [Google Scholar]


