Abstract
Purpose
Noninvasive beta cell mass (BCM) quantification is a crucial tool to understand diabetes development and progression. [111In]exendin is a promising agent for in vivo beta cell imaging, but tracer testing has been hampered by the lack of well-defined rodent models.
Procedures
Biodistribution and pancreatic uptake of [111In]exendin were compared in rats and mice. In selected models, the amount of [111In]exendin accumulation in the pancreas and other organs was determined using a model of alloxan-induced beta cell loss. GLP-1R expression levels were analyzed by RT-PCR and immunohistochemistry.
Results
Namely Brown Norway rats showed beta-cell-specific tracer accumulation and favorable pancreas-to-background ratios for noninvasive BCM determination. Mice displayed receptor-mediated [111In]exendin uptake in endocrine and exocrine pancreas, in spite of very low GLP-1R expression in exocrine tissue.
Conclusions
Rats display better characteristics for in vivo BCM determination than mice and are suggested as a more adequate model for humans.
Electronic supplementary material
The online version of this article (doi:10.1007/s11307-016-0936-y) contains supplementary material, which is available to authorized users.
Key words: Diabetes, Beta cell mass, Receptor targeting, GLP-1R, Exendin
Introduction
Diabetes mellitus is characterized by defective glucose homeostasis and consequent chronic hyperglycemia. Maintenance of glycemic control by daily insulin injections or anti-diabetogenic drugs is difficult, and patients affected by both type 1 and type 2 diabetes are at risk for severe complications, such as cardiovascular disease, blindness, and kidney failure, increasing their risk for premature death. Changes in beta cell mass (BCM) occur in both forms of diabetes [1–3], but the mechanisms and evolution underlying these BCM changes are poorly understood [4, 5].
Beta cell function is usually monitored by measurements of insulin secretion, such as insulin and C-peptide, analyzed in parallel to glucose levels. However, it was shown that beta cell function and BCM do not diminish equally during disease progression [5, 6], indicating that beta cell function is not an adequate measure for BCM. A reliable and reproducible method to monitor BCM dynamics over time, such as longitudinal quantitative imaging, could unravel the importance of BCM during the course of diabetes.
During the past decade, major efforts have been made to image BCM in vivo in animal models using a variety of imaging methodologies [7], such as near infrared optical projection tomography (OPT) [8], bioluminescence [9], or magnetic resonance imaging (MRI) [10–12]. While MRI offers the highest resolution (still not allowing resolution of single islets in vivo), nuclear medicine imaging modalities, such as single photon emission computed tomography (SPECT) and positron emission tomography (PET), have the potential to reach sufficient sensitivity to detect small numbers of beta cells when targeted with a radiolabeled beta-cell-specific tracer. Importantly, the first clinical trial results show that SPECT and PET are the most likely approaches to reach human translation at this point in time [13–15].
A variety of antibodies, such as IC2 [16]; small molecules, such as 2-deoxy-2-[18F]fluoro-D-glucose [17]; neurotransmitter precursors, such as [11C]5-hydroxytryptophan ([11C]5-HTP) [18]; organic compounds, such as dihydrotetrabenazine (DTBZ) targeting the vesicular monoamine transporter 2 (VMAT2) [19]; and peptides, such as exendin targeting the glucagon-like peptide 1 (GLP-1) receptor [13] have been evaluated as tracers for BCM determination. Very recent findings indicate that [11C]5-HTP can successfully discriminate between rats with severe or moderate beta cell loss [15, 18], while radiolabeled exendin, a stable GLP-1R agonist specifically targeting the pancreatic beta cells [20], was shown to successfully detect small changes in BCM in a preclinical model for beta cell loss [14]. In order to further validate the use of GLP-1R radionuclide imaging to evaluate the dynamics of BCM changes in diabetes, further studies in animal models are required.
A variety of preclinical models have been used to investigate BCM dynamics, but the results obtained showed differences in biodistribution and in tracer uptake in relation to BCM [14, 21–24]. We hypothesize that the observed differences in these studies can be related to the use of animal models. Therefore, in the present study, we aimed to evaluate the differences between various animal models to select the most suitable model for preclinical, noninvasive BCM determination using [111In]exendin. Ideally, this optimal model should allow accurate, quantitative BCM determination and its features should reflect the human situation. We compared the biodistribution and pancreatic uptake of [111In]exendin in various rat and mouse strains and compared their specific GLP-1R expression pattern. Finally, we determined the specificity of [111In]exendin accumulation in beta cells using an alloxan-induced model for beta cell loss.
Materials and Methods
Radiolabeling
[Lys40(DTPA)]exendin-3 (Peptides Specialty Laboratories, Heidelberg, Germany) was radiolabeled as previously described [14]. Briefly, 150 MBq [111In]InCl3 was added to 1 μg [Lys40(DTPA)]exendin-3 dissolved in 0.1 M 2-(N-morpholino)ethanesulfonic acid (MES), pH 5.5 (Sigma-Aldrich, St. Louis, MO, USA) and incubated for 20 min at room temperature (RT). After incubation, EDTA (Sigma-Aldrich) and Tween 80 (Sigma-Aldrich) were added to a final concentration of 5 mM and 0.1 %, respectively. The radiochemical purity of [111In]exendin-3 was determined by instant thin-layer chromatography (ITLC) (ITLC-SG, Agilent Technologies, Lake Forest, CA, USA), using 0.1 M EDTA in 0.1 M NH4Ac (Sigma-Aldrich), pH 5.5 as a mobile agent.
Animals
All animal experiments were approved by the Animal Welfare Committee of the Radboud University, Nijmegen and carried out in accordance with the local and national guidelines. Six- to 8-week-old male animals were used for all experiments. For the experiments in mice, BALB/c, DBA, CBA, and C57Bl/6J mice were purchased from Janvier Labs (Le Genest Saint Isle, France) and the NMRI mice from Harlan (Horst, The Netherlands). For the experiments in rats, Brown Norway, F344, WAG/Rij, and Sprague Dawley rats were purchased from Harlan.
Alloxan Treatment
To determine the specificity of [111In]exendin accumulation in the beta cells, animals were injected with various doses (25–75 mg/kg) of alloxan monohydrate (Sigma Chemicals, St. Louis, MO, USA) to deplete the beta cells. Alloxan was dissolved in ice-cold 10 mM HCl with a concentration of 0.1 mg/μl and diluted with ice-cold phosphate buffered saline (PBS). During storage and dilution, alloxan was protected from light and kept on ice. Animals were injected intravenously with 200 μl alloxan solution within 5 min after dilution. Control animals were injected with vehicle (10 mM HCl diluted with PBS). Blood glucose concentrations were monitored for 1 week after alloxan injection using a blood glucose meter (Accu-Chek Sensor, Roche Diagnostics, Almere, The Netherlands).
Biodistribution Studies
Biodistribution studies were performed to compare the [111In]exendin uptake in different mouse and rat strains. Based on the pancreatic uptake, endocrine-to-exocrine ratio, pancreas-to-stomach ratio, and pancreas-to-duodenum ratio, one strain was chosen to determine the specificity of [111In]exendin accumulation in the beta cells, as described above. To determine the effect of alloxan over time, biodistribution studies were performed on day 1, 3, 5, and 7 after alloxan injection. All animals used for biodistribution studies were injected intravenously with 15 MBq [111In]exendin-3 (peptide dose 20 pmol/rat, mouse). Non-GLP-1R-mediated exendin uptake was determined in a separate group of animals that were coinjected with an excess of unlabeled exendin (25 μg/animal). Four hours after injection of the radiolabeled exendin, animals were euthanized and the pancreas and other relevant tissues (blood, muscle, heart, lung, spleen, kidney, liver, stomach, and duodenum) were dissected, weighed, and counted in a well-type gamma counter (Wallac 1480 Wizard, Perkin Elmer, Boston, MA, USA). The percentage injected dose per gram tissue (%ID/g) was determined for each tissue.
Digital Autoradiography
Ex vivo autoradiography was performed to visualize the uptake in the islets and the exocrine pancreas. After dissection, pancreata were fixed in 4 % formalin (w/v), dehydrated, and embedded in paraffin. Sections of the pancreas (4 μm) were prepared and exposed to a phosphorimaging plate (Fuji Film BAS-SR 2025, Raytest, Straubenhardt, Germany) for 7 days. Images were acquired with a radioluminography laser images (Fuji Film BAS 1800 II system (Raytest) and analyzed using Aida Image Analyzer software (Raytest).
Endocrine-to-Exocrine Ratio Determination
To quantitatively compare tracer uptake in the islets and the exocrine pancreas, endocrine-exocrine uptake ratios were determined in the autoradiographs of pancreatic sections. The digital images were analyzed using ImageJ, a public domain software (http://imagej.nih.gov/ij/). Three pancreatic sections were analyzed per mouse and rat strain. Per pancreatic section, three regions of interest (ROI) were drawn in both the exocrine and endocrine pancreas and the mean density values (photostimulated luminescence) were determined. These values were used to calculate the endocrine-exocrine uptake ratio.
Immunohistochemistry
Pancreatic sections (4 μm) of C57Bl/6 mice, Brown Norway rats, and humans were stained for the presence of GLP-1R. Antigen retrieval was performed in 10 mM sodium citrate, pH 6.0 for 10 min at 96 °C. Subsequently, sections were incubated for 10 min with 3 % H2O2 in PBS at RT in the dark, to block endogenous peroxidase activity. Nonspecific binding was blocked by incubation for 30 min with 5 % normal swine serum. The primary anti-GLP-1R antibody (ab39072, Abcam, Cambridge, UK) was diluted in PBS containing 1 % BSA (1:500). Primary antibody incubation for 90 min was followed by incubation with swine-anti-rabbit peroxidase (1:50) (p0271, DAKO, Copenhagen, Denmark) for 30 min at RT in the dark. Finally, 3,3′diaminobenzidine (DAB) was used to develop the pancreatic sections.
Pancreatic Islet Isolation, mRNA Extraction, and Real-Time PCR
mRNA extraction and real-time PCR was performed as described previously [25]. Briefly, poly(A)+mRNA was isolated from pancreatic islets (rat islets were isolated by collagenase digestion and handpicking and mouse islets using the Histopaque method [26]) or exocrine tissue (the tissue remaining after islet isolation) from C57Bl/6 mice and Wistar rats using the Dynabeads mRNA DIRECT™ kit (Invitrogen, Merelbeke, Belgium) and reversely transcribed. Exocrine mRNA samples used in the study were evaluated with Biodrop (Cambridge, UK) and showed a 260/280 ratio >1.9, suggesting that the mRNA was well preserved. Real-time PCR amplification of Glp-1r was performed using IQ SyBR Green Supermix on iCycler MyiQ Single Color (BIO-RAD, Hercules, CA, USA) and compared to a standard curve. amy2 was calculated with the deltaCT method [27]. In all assays, the geometrical means of the housekeeping genes β-actin and gapdh was used as a reference. The pancreatic islet and exocrine tissue preparations were selected based on the expression levels of, respectively, the endocrine marker pdx1 and the exocrine marker amy2. The primers used are listed in Table 1. Standard curves of the reference genes (β-actin and gapdh) and Glp1r mRNA expression assays of both rat and mouse are provided in ESM Fig. 1.
Table 1.
Primers used for quantitative PCR on rat and mouse cDNA with the length of amplification on base pairs
| Primer | Sequence | Base pairs |
|---|---|---|
| Rat GLP-1R RT | ||
| Forward (5′–3′) | GGCTCCTCTCGTATCAGGAC | 200 |
| Reverse (5′–3′) | GATAACGAACAGCAGCGGAAC | |
| Rat GLP-1R std | ||
| Forward (5′–3′) | ATCCACCTGAACCTGTTTGC | 468 |
| Reverse (5′–3′) | CTTGGCTATCACGATGCAGA | |
| Mouse GLP-1R RT | ||
| Forward (5′–3′) | GCGTGGCAGCCAACTACTA | 139 |
| Reverse (5′–3′) | ATAACGAACAGCAGCGGAAC | |
| Mouse GLP-1R std | ||
| Forward (5′–3′) | ATCCACCTGAACCTGTTTGC | 617 |
| Reverse (5′–3′) | AGCTTGATGAAGCGTAGGGT | |
| Rat insulin RT | ||
| Forward (5′–3′) | TGTGGTTCTCACTTGGTGGA | 111 |
| Reverse (5′–3′) | CTCCAGTTGTGCCACTTGTG | |
| Rat insulin std | ||
| Forward (5′–3′) | TGACCAGCTACAGTCGGAA | 390 |
| Reverse (5′–3′) | GTTGCAGTAGTTCTCCAGTTGG | |
| Mouse insulin RT | ||
| Forward (5′–3′) | GGAAGCCCCGGGGACCTTCAGA | 138 |
| Reverse (5′–3′) | GGCGGGTCGAGGTGGGCCTTA | |
| Mouse insulin std | ||
| Forward (5′–3′) | CACCCAAGTCCCGCCGTGAAG | 449 |
| Reverse (5′–3′) | TCAGTGGCATTTACACGGTTGCCTA | |
| β-Actin RT | ||
| Forward (5′–3′) | CTGTACGCCAACACAGTGCT | 127 |
| Reverse (5′–3′) | GCTCAGGAGGAGCAATGATC | |
| β-Actin std | ||
| Forward (5′–3′) | AAATCTGGCACCACACCTTC | 805 |
| Reverse (5′–3′) | CCGATCCACACGGAGTACTT | |
| Rat pdx-1 RT | ||
| Forward (5′–3′) | GGTATACCAGCGAGATGCT | 152 |
| Reverse (5′–3′) | TCAGTTGGGAGCCTGATTCT | |
| Rat pdx-1 std | ||
| Forward (5′–3′) | GAGGACCCGTACAGCCTACA | 748 |
| Reverse (5′–3′) | GGGACCGCTCAAGTTTGTAA | |
| Mouse pdx-1 RT | ||
| Forward (5′–3′) | GAGGTGCTTACACAGCGGAA | 116 |
| Reverse (5′–3′) | GGGCCGGGAGATGTATTTGT | |
| Mouse pdx-1 std | ||
| Forward (5′–3′) | CCTTTCCCGAATGGAACCGA | 679 |
| Reverse (5′–3′) | GCTCTCGTGCCCTCAAGAAT | |
| Rat amy2 RT | ||
| Forward (5′–3′) | ATTGATCTTGGTGGTGAAGCA | 174 |
| Reverse (5′–3′) | GGCTCTGTCAGTAGGCACAA | |
| Rat amy2 std | ||
| Forward (5′–3′) | CGAACCAAGGTGGCTGACTAT | 636 |
| Reverse (5′–3′) | TCGATGTTCACAGACCCAGT | |
| Mouse amy2 RT | ||
| Forward (5′–3′) | CATGGTGACAAGGTGCAACA | 102 |
| Reverse (5′–3′) | CAGGTACTGCTTGTTCCTGC | |
| Mouse amy2 std | ||
| Forward (5′-3′) | TCTGCACAAGGTCTGGAAATGA | 500 |
| Reverse (5′–3′) | ACCCAGATCAATGACCTCTTGG | |
| Gadph RT | ||
| Forward (5′–3′) | GCCTGGAGAAACCTGCCAAGTATGA | 101 |
| Reverse (5′–3′) | AACCTGGTCCTCAGTGTAGCCC | |
| Gadph std | ||
| Forward (5′–3′) | ATGACTCTACCCACGGCAAG | 975 |
| Reverse (5–3′) | TGTGAGGGAGATGCTCAGTG | |
Results
[111In]Exendin Uptake in Various Mouse Strains
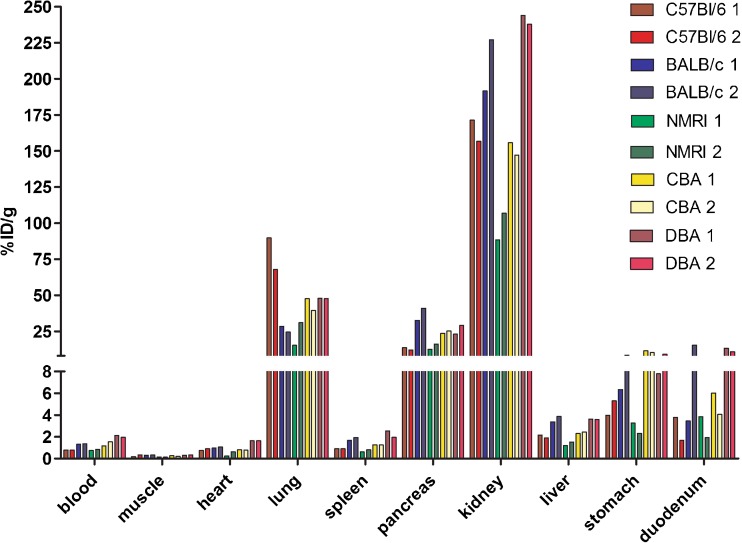
Figure 1 shows the biodistribution (two mice per strain) of [111In]exendin in five mouse strains. As reported previously [28], tracer uptake was observed not only in the pancreas but also in various other organs, such as the lung, stomach, duodenum, and the kidneys. Based on these results, BALB/c mice showed favorable features for in vivo beta cell targeting, namely high pancreatic uptake (36.8 %ID/g) and relatively low uptake in lung (26.4 %ID/g), stomach (7.37 %ID/g), and duodenum (9.42 %ID/g). Therefore, BALB/c mice were selected to determine the specificity of tracer accumulation in the beta cells. C57Bl/6 mice, a strain often used in diabetes research, was also evaluated.
Fig. 1.
Biodistribution of [111In]exendin in C57Bl/6, BALB/c, NMRI, CBA, and DBA mice. Values are expressed as percentage injected dose per gram tissue (n = 2). Mice were dissected 4 h after injection.
Beta Cell Specificity of [111In]Exendin Uptake in BALB/c and C57Bl/6 Mice
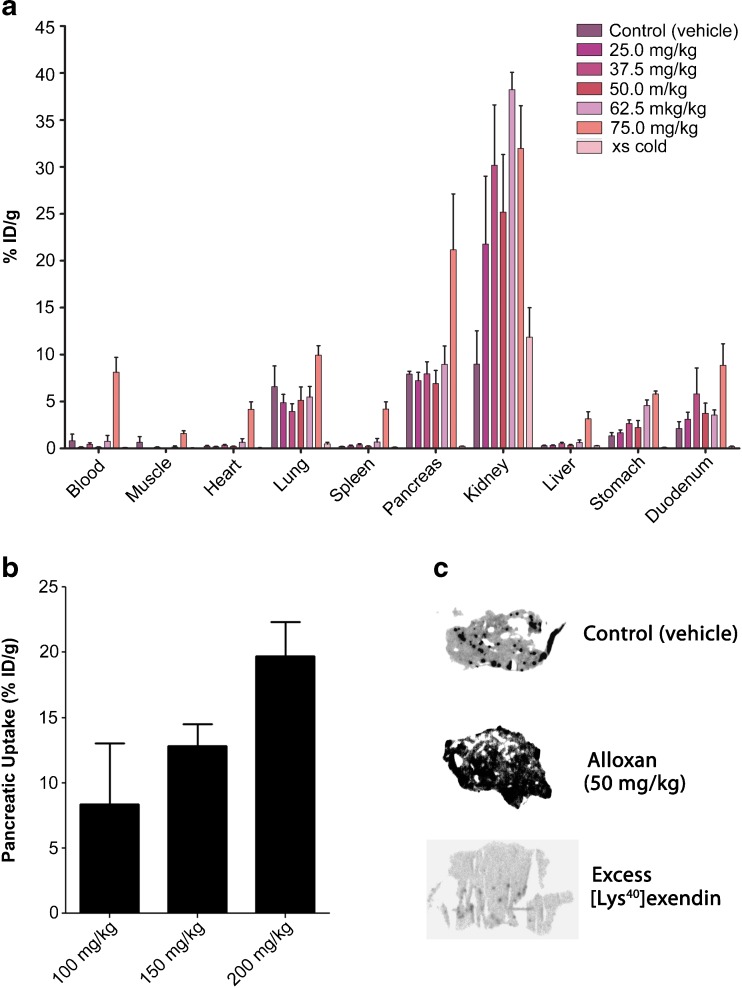
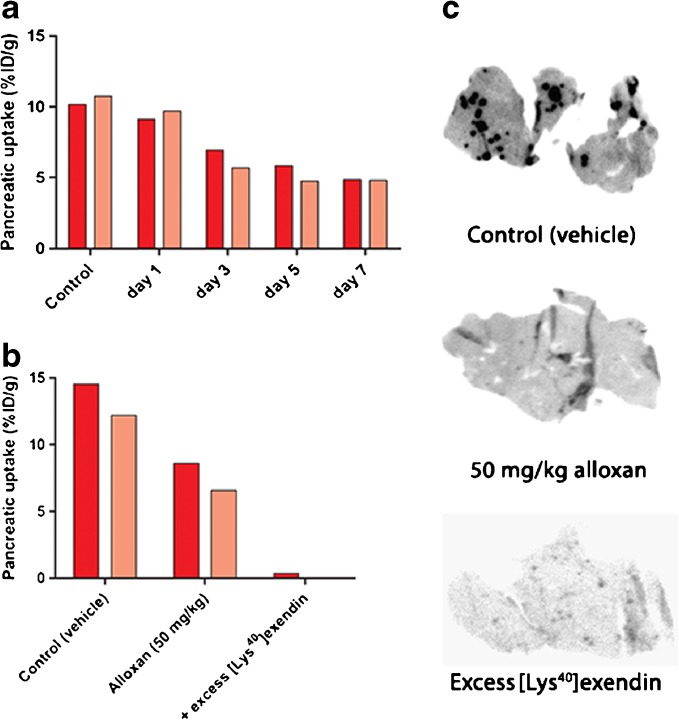
In BALB/c mice, the pancreatic uptake did not decline after injection of 25, 32.5, 50, and 62.5 mg/kg alloxan (Fig. 2a). Mice treated with even higher doses of alloxan (75, 100, 150, and 200 mg/kg) showed increased total pancreatic tracer uptake. In animals treated with high alloxan doses, elevated tracer levels in the blood were observed and thus, higher uptake in all other tissues, including the exocrine pancreas (Fig. 2a, b). This is most probably the result of dehydration secondary to severe hyperglycemia, leading to slower blood clearance. In addition, direct toxic effects of alloxan cannot be excluded at high doses. Coinjection of an excess unlabeled exendin decreased the pancreatic uptake from 7.9 ± 0.6 %ID/g to 0.23 ± 0.04 %ID/g (Fig. 2a) which was also reflected by the autoradiographic images (Fig. 2c). Due to the high uptake in exocrine tissue, the endocrine-exocrine ratio in these mice was only 4.11 ± 0.93 (Table 2) which is very low when compared to rats (see below). These results—especially the reduced uptake after coinjection of unlabeled exendin—indicate specific, receptor-mediated tracer binding in the exocrine pancreas of BALB/c mice. Because of this high exocrine uptake, [111In]exendin uptake after alloxan treatment was further investigated in C57Bl/6 mice for validation of the results described above. Figure 3a summarizes pancreatic uptake of [111In]exendin in C57Bl/6 mice on various days after alloxan treatment. After 3 days, a clear decrease in pancreatic uptake was observed, while the maximum decrease was observed 7 days after alloxan treatment. However, the decrease did not exceed 40 % compared to control mice injected with vehicle. Furthermore, similar to the findings observed in BALB/c mice, tracer uptake in the exocrine pancreas of C57Bl/6 mice could be blocked with an excess of unlabeled exendin (Fig. 3b, c). Additionally, the calculated endocrine-to-exocrine uptake ratio in these mice (4.56 ± 0.91) (Table 2) was in the same range as the ratio observed in BALB/c mice.
Fig. 2.
a Biodistribution of [111In]exendin in control and alloxan-treated BALB/c mice. Values are expressed as percentage injected dose per gram tissue (n = 5 mice). Blocking was performed by coinjection of 25 μg unlabeled exendin (n = 5). b Pancreatic uptake of [111In]exendin in BALB/c mice treated with 100 mg/kg (n = 5), 150 mg/kg (n = 4), and 200 mg/kg (n = 3) of alloxan. Values are expressed as percentage injected dose per gram tissue. c Ex vivo autoradiography of pancreatic sections of BALB/c mice treated with PBS (control) and 50 mg/kg alloxan. Blocking was performed by coinjection of 25 μg unlabeled exendin.
Table 2.
Endocrine-exocrine ratio of [111In]exendin uptake in BALB/c and C57Bl/6 mice calculated from autoradiography of pancreatic sections
| Mouse strain | Endocrine-exocrine ratio |
|---|---|
| BALB/c | 4.11 ± 0.93 |
| C57Bl/6 | 4.56 ± 0.91 |
Fig. 3.
a Pancreatic uptake of [111In]exendin in C57Bl/6 mice (n = 2) on different days after alloxan treatment (50 mg/kg). b Pancreatic uptake of [111In]exendin in C57Bl/6 mice treated with vehicle (control) (n = 2) and 50 mg/kg alloxan (n = 2). Blocking was performed by coinjection of 25 μg unlabeled exendin (n = 1). c Autoradiography of pancreatic sections of C57Bl/6 mice treated with vehicle (control) and 50 mg/kg alloxan. Blocking was performed by coinjection of 25 μg unlabeled exendin.
[111In]Exendin Uptake in Different Rat Strains
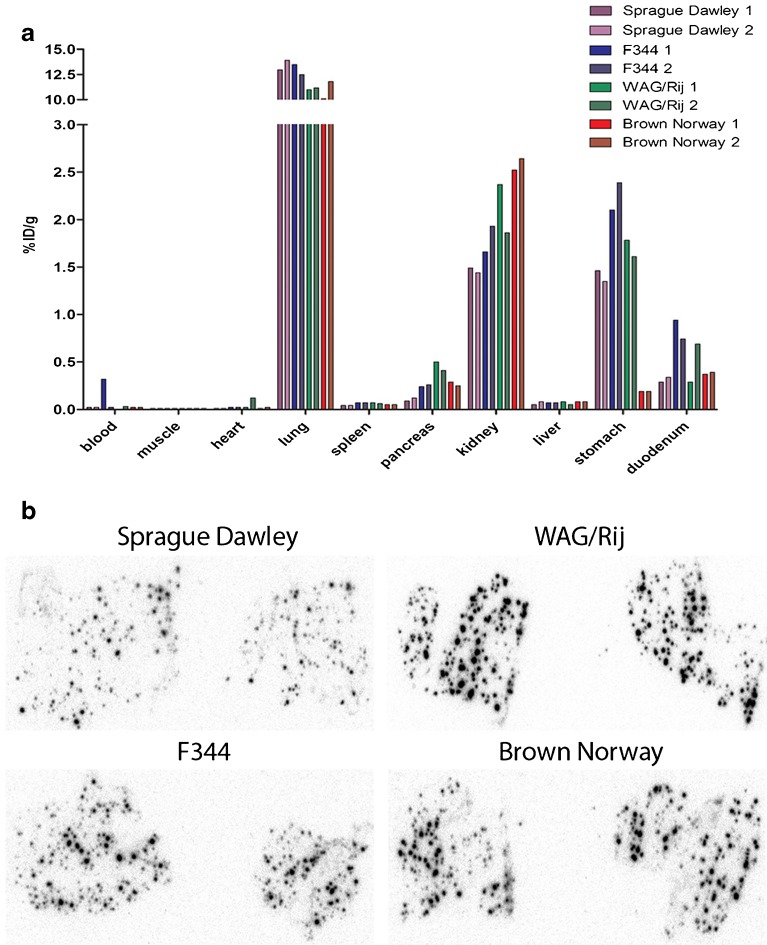
Figure 4a summarizes the biodistribution (two rats per strain) of [111In]exendin in four rat strains. In all rat strains, there was very high lung uptake (>10 %ID/g), which was even higher than the uptake observed in the kidneys. The biodistribution profiles indicated that WAG/Rij rats have the highest pancreatic [111In]exendin uptake (0.45 %ID/g). In addition, the endocrine-to-exocrine uptake ratio, calculated from the autoradiographs shown in Fig. 4b, was highest for WAG/Rij rats as well (Table 3). The uptake in the stomach (1.7 %ID/g) of WAG/Rij rats is relatively high (Fig. 4a), resulting in a pancreas-to-stomach uptake ratio of 0.27 ± 0.02 (Table 4). Since high stomach uptake might hamper BCM visualization in vivo, we selected Brown Norway rats to investigate the beta cell specificity of pancreatic [111In]exendin accumulation due to their higher pancreas-to-stomach (1.39 ± 0.11) and acceptable pancreas-to-duodenum (0.70 ± 0.1) ratios (Table 4) despite their lower pancreatic uptake (0.27 %ID/g) (Fig. 4a) and endocrine-to-exocrine ratio (57.1 ± 12.5) (Table 3).
Fig. 4.
a Biodistribution of [111In]exendin in Sprague Dawley, F344, Wag/Rij, and Brown Norway rats. Values are expressed as percentage injected dose per gram tissue (n = 2 rats). Rats were dissected 4 h after injection. b Autoradiography of pancreatic section of Sprague Dawley, F344, Wag/Rij, and Brown Norway rats showing focal hotspots of tracer accumulation representing the islets.
Table 3.
Overview of the endocrine-exocrine ratios of [111In]exendin uptake in various rat strains calculated from autoradiography of pancreatic sections
| Rat strain | Endocrine-exocrine ratio |
|---|---|
| WAG/Rij | 105.66 ± 29.84 |
| Brown Norway | 57.06 ± 12.53 |
| Sprague Dawley | 44.00 ± 13.33 |
| F344 | 44.83 ± 2.85 |
Table 4.
Overview of the pancreas-to-stomach and pancreas-to-duodenum ratios of [111In]exendin uptake in the different rat strains
| Rat strain | Pancreas-to-stomach ratio | Pancreas-to-duodenum ratio |
|---|---|---|
| Sprague Dawley | 0.08 ± 0.02 | 0.33 ± 0.02 |
| F344 | 0.11 ± 0.00 | 0.31 ± 0.07 |
| Wag/Rij | 0.27 ± 0.02 | 1.15 ± 0.78 |
| Brown Norway | 1.39 ± 0.11 | 0.70 ± 0.10 |
Beta Cell Specificity of [111In]Exendin Uptake in Brown Norway Rats
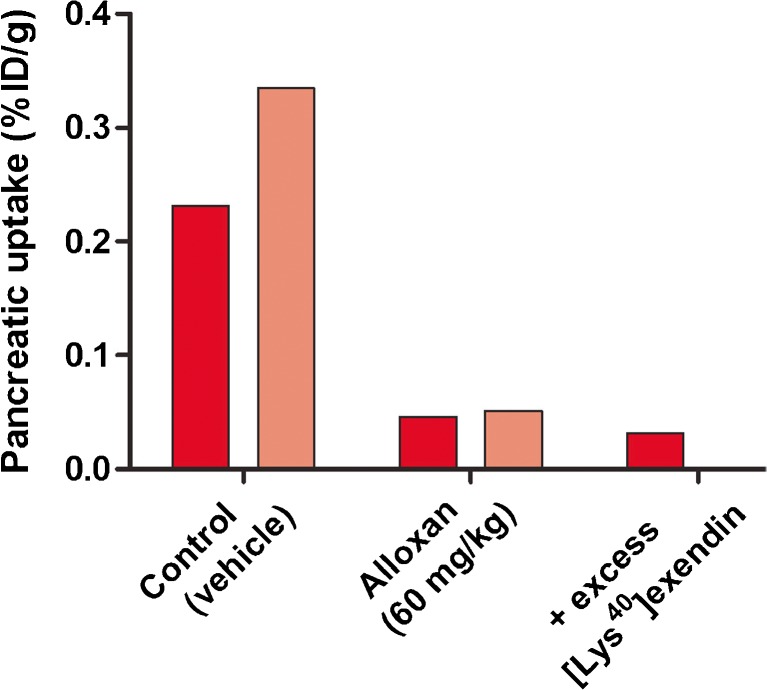
In Brown Norway rats, treated with 60 mg/kg alloxan (two rats), pancreatic uptake was reduced by more than 80 % compared to control rats, that were injected with vehicle (PBS) (two rats) (Fig. 5). Coadministration of an excess unlabeled exendin (one rat) reduced the pancreatic uptake to similar uptake levels observed in alloxan-treated rats, suggesting no or very low nonspecific [111In]exendin uptake in the exocrine pancreas. Furthermore, autoradiographical analysis showed similar results: high, specific tracer uptake in the islets of Langerhans and low, nonspecific uptake in the exocrine pancreas (Fig. 4b) resulting in an endocrine-to-exocrine uptake ratio of 57.1 ± 12.5 (Table 4). These results indicate high beta cell specificity of [111In]exendin in these rats.
Fig. 5.
Pancreatic uptake of [111In]exendin in Brown Norway rats treated with vehicle (control) (n = 2) and alloxan (60 mg/kg) (n = 2). Values are expressed as percentage injected dose per gram tissue. Blocking was performed by coinjection of 25 μg unlabeled exendin (n = 1).
Quantitative PCR
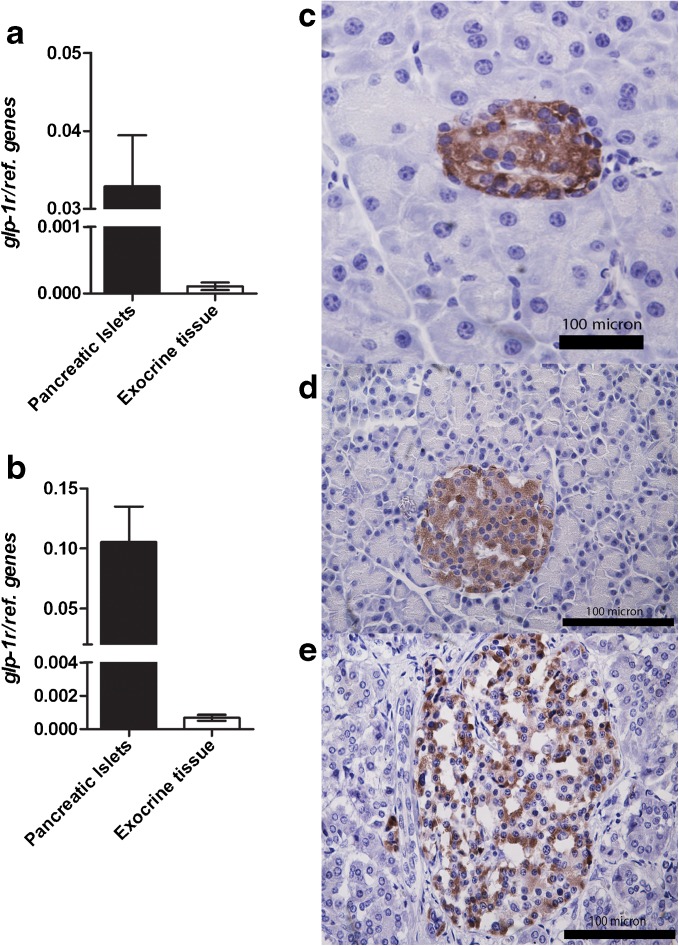
Since receptor-mediated [111In]exendin uptake was observed in exocrine pancreas of mice, Glp-1r mRNA expression was compared in endocrine and exocrine pancreatic tissue of rats and mice. Quantitative RT-PCR revealed similar Glp-1r mRNA expression levels in endocrine and exocrine tissue of rat and mouse (Fig. 6a, b) with endocrine-to-exocrine ratios of 45.8 and 55.6, respectively. Individual expression levels of all cell markers (Glp-1r, Pdx1, Ins, and Amy2b) in endocrine and exocrine tissue are provided in ESM Fig. 2.
Fig. 6.
Quantitative PCR for the Glp-1r in endocrine and exocrine pancreatic tissue of a rat and b mouse and immunohistochemical analysis of GLP-1R expression in pancreatic tissue (embedded in paraffin) of c rat, d mouse, and e human. Both analyses show high GLP-1R expression in the islets and no, or very low expression in exocrine tissue. For quantitative PCR, paired t test was performed and p < 0.05 was considered as significant.
Immunohistochemistry
To investigate GLP-1R expression in endocrine and exocrine pancreatic tissue, GLP-1R staining was performed on rat, mouse, and human pancreatic tissue. Figure 6c–e shows the results of the immunohistochemical analysis. In all pancreatic tissues analyzed, the islets of Langerhans showed clear GLP-1R staining while no, or very limited, staining was observed in the exocrine portion of the pancreatic tissue.
Discussion
In this study, we assessed differences between rodent models for noninvasive in vivo BCM assessment via GLP-1R targeting. We investigated the biodistribution of [111In]exendin in various rat and mouse strains and determined the specificity of tracer accumulation in the beta cells. Our present findings indicate that Brown Norway rats display the most favorable characteristics for noninvasive BCM assessment using radiolabeled exendin as a tracer. Mice seem to display receptor-mediated tracer uptake in the exocrine pancreas, an observation explaining the limited reduction of exendin uptake in the pancreas of mouse models after beta cell destruction [22, 24].
In view of the spatial resolution of present imaging modalities and the small size of the islets, preventing visualization of single islets in vivo, the optimal model for in vivo BCM determination must display high and specific [111In]exendin accumulation in the endocrine pancreas [29, 30] with no or low uptake in the exocrine pancreas and surrounding tissues, in particular stomach and duodenum that are localized in the vicinity of the pancreas. Since [111In]exendin is excreted via the kidneys, high tracer uptake is observed in this organ, which renders accurate quantification of pancreatic tracer uptake challenging in rodents. However, spillover signal from the kidneys can be excluded by analyzing a particular region of interest in the pancreas localized cranial and anterior of the kidneys [14]. Another option to overcome spillover effects of the kidneys is coinjection of a second radiotracer, specifically targeting the exocrine tissue such as [99mTc]demobesin and L-[123I]iodophenylalanine in combination with [111In]exendin, which facilitates exact delineation of the pancreas and therefore improves accurate quantification of pancreatic [111In]exendin uptake [22]. Of all investigated rat strains, WAG/Rij rats showed the highest pancreatic [111In]exendin uptake. However, due to their less favorable pancreas-to-stomach and pancreas-to duodenum ratios, WAG/Rij rats are expected to be less suited for in vivo BCM determination using [111In]exendin SPECT than Brown Norway rats.
To evaluate the beta cell specificity of the tracer, ex vivo autoradiography was performed. In rats, focal hotspots of tracer accumulation, representing the beta cells, were observed while there was a low background signal in the exocrine tissue (Fig. 4b). Beta cell depletion by alloxan injection resulted in disappearance of the tracer accumulating hotspots, confirming beta cell specificity of GLP-1R targeting using [111In]exendin allowing accurate BCM determination of BCM. Based on autoradiographic analysis, we showed endocrine-to-exocrine ratios of 105.7 ± 29.8 in WAG/Rij rats, 57.1 ± 12.5 in Brown Norway rats, 44.0 ± 13.3 in Sprague Dawley rats, and 44.8 ± 2.9 in F344 rats, which is in line with previous observations [23]. Furthermore, pancreatic [111In]exendin uptake in Brown Norway rats is similarly decreased after alloxan-induced beta cell depletion and coinjection with an excess unlabeled exendin, confirming beta-cell-specific tracer accumulation in this model. We have previously shown clear differences in [111In]exendin uptake in the pancreas of Brown Norway rats treated with various concentrations of alloxan, resulting in a linear correlation of SPECT signal and BCM [14]. These observations confirm that this rat strain provides an optimal model for in vivo BCM assessment via GLP-1R targeting.
Several groups have reported a decrease in pancreatic tracer uptake in mice after alloxan or streptozotocin-induced beta cell destruction [22, 24]. However, the maximum decrease did not exceed 40 %, an observation which can be explained by our data. After coinjection of an excess unlabeled exendin in mice, tracer uptake was much lower than the remaining uptake observed after alloxan-induced beta cell depletion. These results strongly suggest that the limited decrease in tracer uptake after alloxan-induced beta cell destruction is caused by receptor-mediated [111In]exendin uptake in the exocrine pancreas of mice. Nevertheless, there was no detectable GLP-1R expression in exocrine pancreatic tissue of mice by immunohistochemistry and only very low Glp-1r mRNA expression was observed by RT-PCR. Furthermore, endocrine-to-exocrine ratios of Glp-1r mRNA expression are similar in mice and rats. These observations suggest that [111In]exendin probably binds to a receptor other than the GLP-1R in the exocrine pancreatic tissue of mice, which could also explain the observations of Nalin et al. [31]. These findings preclude the use of this model for additional characterization of [111In]exendin uptake. In contrast with observations in mice after beta cell destruction [22, 24] (present data), and similar to the above described rat data, patients with long standing type 1 diabetes can show very low [111In]exendin uptake similar to background values [14], suggesting no or negligible uptake in the exocrine pancreas. Therefore, the situation in humans appears to be better reflected by rat models than by mouse models. At this point in time, it remains unclear which receptor is responsible for exendin uptake in the exocrine pancreas of mice but it is highly likely that this receptor shows differences with the rat and human receptors in a way that only the variant expressed in mice can bind exendin.
Conclusion
The choice of a certain rodent model can greatly influence studies investigating BCM dynamics. The present findings indicate that mice have binding in the exocrine pancreas which is mediated by a receptor that is not the GLP-1R, rendering them an inadequate model for BCM assessment by radiolabeled exendin. On the other hand, rats do not show receptor-mediated exendin binding in the exocrine pancreas, and are therefore a better suited model for further studies. Among the investigated rat models, Brown Norway rats are the optimal model for noninvasive GLP-1R targeting given their favorable pancreas-to-background uptake ratios. In view of these results and the very low remaining uptake in patients with T1D, rats appear to display better characteristics for in vivo investigation of BCM dynamics when compared to mice, and are thus considered a suitable model better reflecting the human situation than other animal models.
Electronic supplementary material
Below is the link to the electronic supplementary material.
(PDF 426 kb)
Acknowledgments
We thank Bianca Lemmers, Henk Arnts, Iris Lamers, and Kitty Lemmens for their technical support with the animal experiments. The research leading to these results has received funding from the People Programme (Marie Curie Actions) of the European Union’s Seventh Framework Programme FP7/2007-2013/ project BetaTrain under REA grant agreement no. 289932, the European Community’s Seventh Framework Programme FP7/2007-2013/ project BetaImage under grant agreement no. 222980, NIH grant 1R01 AG 030328–01 (all to MG) and JDRF grant 3-SRA-2014-32-S-B (to DLE).
Compliance with Ethical Standards
Conflict of Interest
The authors declare that they have no conflict of interest
Statement of animal rights
All applicable institutional and/or national guidelines for the care and use of animals were followed.
References
- 1.Lohr M, Kloppel G. Residual insulin positivity and pancreatic atrophy in relation to duration of chronic type 1 (insulin-dependent) diabetes mellitus and microangiopathy. Diabetologia. 1987;30:757–762. doi: 10.1007/BF00275740. [DOI] [PubMed] [Google Scholar]
- 2.Butler AE, Janson J, Bonner-Weir S, et al. Beta-cell deficit and increased beta-cell apoptosis in humans with type 2 diabetes. Diabetes. 2003;52:102–110. doi: 10.2337/diabetes.52.1.102. [DOI] [PubMed] [Google Scholar]
- 3.Steele C, Hagopian WA, Gitelman S, et al. Insulin secretion in type 1 diabetes. Diabetes. 2004;53:426–433. doi: 10.2337/diabetes.53.2.426. [DOI] [PubMed] [Google Scholar]
- 4.Cnop M, Welsh N, Jonas JC, et al. Mechanisms of pancreatic beta-cell death in type 1 and type 2 diabetes: many differences, few similarities. Diabetes. 2005;54(Suppl 2):S97–S107. doi: 10.2337/diabetes.54.suppl_2.S97. [DOI] [PubMed] [Google Scholar]
- 5.Weir GC, Bonner-Weir S. Five stages of evolving beta-cell dysfunction during progression to diabetes. Diabetes. 2004;53(Suppl 3):S16–S21. doi: 10.2337/diabetes.53.suppl_3.S16. [DOI] [PubMed] [Google Scholar]
- 6.Ritzel RA, Butler AE, Rizza RA, et al. Relationship between beta-cell mass and fasting blood glucose concentration in humans. Diabetes Care. 2006;29:717–718. doi: 10.2337/diacare.29.03.06.dc05-1538. [DOI] [PubMed] [Google Scholar]
- 7.Yang L, Ji W, Xue Y, Chen L. Imaging beta-cell mass and function in situ and in vivo. J Mol Med. 2013;91:929–938. doi: 10.1007/s00109-013-1056-7. [DOI] [PubMed] [Google Scholar]
- 8.Eriksson AU, Svensson C, Hornblad A et al (2013) Near infrared optical projection tomography for assessments of beta-cell mass distribution in diabetes research. J Vis Exp 71:e50238 [DOI] [PMC free article] [PubMed]
- 9.Virostko J, Radhika A, Poffenberger G et al (2013) Bioluminescence imaging reveals dynamics of beta cell loss in the non-obese diabetic (NOD) mouse model. PLoS ONE 8:e57784 [DOI] [PMC free article] [PubMed]
- 10.Stasiuk GJ, Minuzzi F, Sae-Heng M, et al. Dual-modal magnetic resonance/fluorescent zinc probes for pancreatic beta-cell mass imaging. Chemistry. 2015;21:5023–5033. doi: 10.1002/chem.201406008. [DOI] [PMC free article] [PubMed] [Google Scholar]
- 11.Vinet L, Lamprianou S, Babic A, et al. Targeting GLP-1 receptors for repeated magnetic resonance imaging differentiates graded losses of pancreatic beta cells in mice. Diabetologia. 2015;58:304–312. doi: 10.1007/s00125-014-3442-2. [DOI] [PMC free article] [PubMed] [Google Scholar]
- 12.Antkowiak PF, Stevens BK, Nunemaker CS, et al. Manganese-enhanced magnetic resonance imaging detects declining pancreatic beta-cell mass in a cyclophosphamide-accelerated mouse model of type 1 diabetes. Diabetes. 2013;62:44–48. doi: 10.2337/db12-0153. [DOI] [PMC free article] [PubMed] [Google Scholar]
- 13.Pattou F, Kerr-Conte J, Wild D. GLP-1-receptor scanning for imaging of human beta cells transplanted in muscle. New Engl J Med. 2010;363:1289–1290. doi: 10.1056/NEJMc1004547. [DOI] [PubMed] [Google Scholar]
- 14.Brom M, Woliner-van der Weg W, Joosten L et al (2014) Non-invasive quantification of the beta cell mass by SPECT with In-labelled exendin. Diabetologia 57(5):950–959 [DOI] [PubMed]
- 15.Eriksson O, Espes D, Selvaraju RK, et al. Positron emission tomography ligand [11C]5-hydroxy-tryptophan can be used as a surrogate marker for the human endocrine pancreas. Diabetes. 2014;63:3428–3437. doi: 10.2337/db13-1877. [DOI] [PubMed] [Google Scholar]
- 16.Aaen K, Rygaard J, Josefsen K, et al. Dependence of antigen expression on functional state of beta-cells. Diabetes. 1990;39:697–701. doi: 10.2337/diab.39.6.697. [DOI] [PubMed] [Google Scholar]
- 17.Malaisse WJ, Damhaut P, Malaisse-Lagae F, et al. Fate of 2-deoxy-2-[18F]fluoro-D-glucose in control and diabetic rats. Int J Mol Med. 2000;5:525–532. doi: 10.3892/ijmm.5.5.525. [DOI] [PubMed] [Google Scholar]
- 18.Eriksson O, Selvaraju RK, Johansson L, et al. Quantitative imaging of serotonergic biosynthesis and degradation in the endocrine pancreas. J Nucl Med. 2014;55:460–465. doi: 10.2967/jnumed.113.125187. [DOI] [PubMed] [Google Scholar]
- 19.Simpson NR, Souza F, Witkowski P, et al. Visualizing pancreatic beta-cell mass with [11C]DTBZ. Nucl Med Biol. 2006;33:855–864. doi: 10.1016/j.nucmedbio.2006.07.002. [DOI] [PMC free article] [PubMed] [Google Scholar]
- 20.Brom M, Joosten L, Frielink C, et al. (111)In-exendin uptake in the pancreas correlates with the beta-cell mass and not with the alpha-cell mass. Diabetes. 2015;64:1324–1328. doi: 10.2337/db14-1212. [DOI] [PMC free article] [PubMed] [Google Scholar]
- 21.Kung MP, Hou C, Lieberman BP, et al. In vivo imaging of beta-cell mass in rats using 18F-FP-(+)-DTBZ: a potential PET ligand for studying diabetes mellitus. J Nucl Med. 2008;49:1171–1176. doi: 10.2967/jnumed.108.051680. [DOI] [PubMed] [Google Scholar]
- 22.Mathijs I, Xavier C, Peleman C, et al. A standardized method for in vivo mouse pancreas imaging and semiquantitative beta cell mass measurement by dual isotope SPECT. Mol Imaging Biol. 2015;17:58–66. doi: 10.1007/s11307-014-0771-y. [DOI] [PubMed] [Google Scholar]
- 23.Mikkola K, Yim CB, Fagerholm V, et al. 64Cu- and 68Ga-labelled [Nle(14), Lys(40)(Ahx-NODAGA)NH2]-exendin-4 for pancreatic beta cell imaging in rats. Mol Imaging Biol. 2014;16:255–263. doi: 10.1007/s11307-013-0700-5. [DOI] [PubMed] [Google Scholar]
- 24.Reiner T, Thurber G, Gaglia J, et al. Accurate measurement of pancreatic islet beta-cell mass using a second-generation fluorescent exendin-4 analog. Proc Natl Acad Sci U S A. 2011;108:12815–12820. doi: 10.1073/pnas.1109859108. [DOI] [PMC free article] [PubMed] [Google Scholar]
- 25.Villate O, Turatsinze JV, Mascali LG, et al. Nova1 is a master regulator of alternative splicing in pancreatic beta cells. Nucleic Acids Res. 2014;42:11818–11830. doi: 10.1093/nar/gku861. [DOI] [PMC free article] [PubMed] [Google Scholar]
- 26.Fukaya M, Tamura Y, Chiba Y, et al. Protective effects of a nicotinamide derivative, isonicotinamide, against streptozotocin-induced beta-cell damage and diabetes in mice. Biochem Biophys Res Commun. 2013;442:92–98. doi: 10.1016/j.bbrc.2013.11.024. [DOI] [PMC free article] [PubMed] [Google Scholar]
- 27.Livak KJ, Schmittgen TD. Analysis of relative gene expression data using real-time quantitative PCR and the 2(−Delta Delta C(T)) Method. Methods. 2001;25:402–408. doi: 10.1006/meth.2001.1262. [DOI] [PubMed] [Google Scholar]
- 28.Brom M, Joosten L, Oyen WJ, Gotthardt M, Boerman OC. Radiolabelled GLP-1 analogues for in vivo targeting of insulinomas. Contrast Media Mol Imaging. 2012;7:160–166. doi: 10.1002/cmmi.475. [DOI] [PMC free article] [PubMed] [Google Scholar]
- 29.Gotthardt M, Boermann OC, Behr TM, Behe MP, Oyen WJ. Development and clinical application of peptide-based radiopharmaceuticals. Curr Pharmac Des. 2004;10:2951–2963. doi: 10.2174/1381612043383502. [DOI] [PubMed] [Google Scholar]
- 30.Hofland LJ, Lamberts SW. The pathophysiological consequences of somatostatin receptor internalization and resistance. Endocr Rev. 2003;24:28–47. doi: 10.1210/er.2000-0001. [DOI] [PubMed] [Google Scholar]
- 31.Nalin L, Selvaraju RK, Velikyan I, et al. Positron emission tomography imaging of the glucagon-like peptide-1 receptor in healthy and streptozotocin-induced diabetic pigs. Eur J Nucl Med Mol Imaging. 2014;41:1800–1810. doi: 10.1007/s00259-014-2745-3. [DOI] [PubMed] [Google Scholar]
Associated Data
This section collects any data citations, data availability statements, or supplementary materials included in this article.
Supplementary Materials
(PDF 426 kb)


