

Abstract
Background
The mammalian inner ear is transformed from a flat placode into a three-dimensional (3D) structure with six sensory epithelia that allow for the perception of sound and both linear and angular acceleration. While hearing and balance problems are typically considered to be adult onset diseases, they may arise as a developmental perturbation to the developing ear. Future prevention of hearing or balance loss requires an understanding of how closely genetic mutations in model organisms reflect the human case, necessitating an objective multidimensional comparison of mouse ears with human ears that have comparable mutations in the same gene.
Results
Here, we present improved 3D analyses of normal murine ears during embryonic development using optical sections obtained through Thin-Sheet Laser Imaging Microscopy. We chronicle the transformation of an undifferentiated otic vesicle between mouse embryonic day 11.5 to a fully differentiated inner ear at postnatal day 15.
Conclusions
Our analysis of ear development provides new insights into ear development, enables unique perspectives into the complex development of the ear, and allows for the first full quantification of volumetric and linear aspects of ear growth. Our data provide the framework for future analysis of mutant phenotypes that are currently under-appreciated using only two dimensional renderings.
Keywords: development, cochlea, endolymph, perilymph, ear, sTSLIM
INTRODUCTION
The mammalian inner ear begins as a contiguous set of pan-placodal cells that surround the brain region. This region, while not displaying any apparent specialized morphology or cytology, is characterized by the expression of a unique set of transcription factors, most importantly Eya1/Six1 (Zou et al., 2008; Schlosser, 2010). Later in development, other genes such as Foxg1, Foxi1, Lmx1a, Pax2, and Pax8 define the boundaries of the much smaller otic placode adjacent to the hindbrain (Ohyama and Groves, 2004; Pauley et al., 2006; Nichols et al., 2008; Bouchard et al., 2010). Subsequent development requires networks of molecular signaling to couple proliferation with otic placode thickening and growth, directed morphogenesis, and invagination to form the otic cup (Fritzsch et al., 1998; Torres and Giraldez, 1998). This early morphogenesis is accompanied by neurosensory cell fate specification and development to form a three-dimensional (3D), functional sensory organ (the labyrinth) capable of both auditory and vestibular perception (Fekete and Wu, 2002). While there exist multiple independent descriptions of these processes in mice (Morsli et al., 1998; Brigande et al., 2000), past techniques either lacked the ability to describe simultaneously the 3D development of the ear and neurosensory differentiation of the distinct epithelia in the same ears in detail or were too labor intensive to be conducted in more than a few samples (Streeter, 1906, 1917).
In the postgenomic era, the ability to molecularly manipulate genes of interest in mice has led to a better appreciation of the genes that are both necessary and sufficient for selective aspects of ear development. As our understanding of the complex interplay between genes in model organisms grows, new technologies are needed to analyze the aberrant phenotypes of genetic mutants that cannot be fully understood when restricted to two-dimensional analysis (Morsli et al., 1998; Hama et al., 2011). Alternatively, cumbersome 3D reconstructions (Streeter, 1906) must be used that require significant corrections for mechanical sectioning and mounting artifacts (Berlanga et al., 2011). Analysis of mutant ear defects is hindered by the ear’s developmental process that turns it into a 3D labyrinth, limiting the detailed translation of the mouse mutation defects to the human ear. A better understanding of ear development is paramount as physicians and scientists converge in their attempts to translate targeted mouse mutations into human phenotypes caused by genetic engineering in mice and genetic defects in humans, respectively.
To attain a novel perspective in closely spaced series of normal and mutant embryos, new techniques must overcome hurdles of past restrictions and provide full quantification of all growth differences. For nearly 20 years, paint-filled ears have provided a 3D representation to ear morphology analysis in many developmental studies (Martin and Swanson, 1993; Morsli et al., 1998; Kiernan et al., 2006). While this technique represents an improvement in the speed of collecting good images of the endolymphatic space to compare wild-type and mutant ears, the success of the paint-filling technique is directly related to the ability of the viscous fluid to properly diffuse throughout the ear. Another limitation of paint-filling is the difficulty for the identification of individual endorgans and their innervation, limiting the inner ear perspective to a view of the endolymphatic space that does not lend itself to morphometric measurements. These limitations are important considerations when analyzing ears of various mutants such as the Dicer1 null mutant which has canal constrictions (Soukup et al., 2009) or mutants that appear to have a lack of segregation between sensory epithelia (Fritzsch et al., 2001; Nichols et al., 2008; Kopecky et al., 2011). To overcome these limitations, histologic sections have been used to complement the development of the ear and the neurosensory units (Yasuda et al., 2007; Cross et al., 2011). While sections do provide very high resolution images and can be used for 3D reconstructions, this process is time consuming, sections are exposed to mechanical shearing forces, and the 3D analysis is often distorted, choppy, and does not render itself to complete quantification of linear and volumetric growth. These limitations are, in part, due to the need to correct for tissue shrinkage in the embedding process and section distortions in the sectioning process.
These limitations may be overcome by nondestructive imaging at high resolution using scanning thin sheet laser imaging microscopy (sTSLIM) imaging or next generations of micro computed tomography (CT) and high resolution magnetic resonance imaging (MRI). Current microCT and MRI images of small samples are of low resolution sufficient for the larger human ears but make identification of cellular components impossible in small ears (Glueckert et al., 2010). However, high resolution imaging of the ear through nondestructive computerized optical sections, as is possible with sTSLIM, provides the ability for 3D reconstructions of perfectly aligned high resolution sections while maintaining the integrity of the ear.
The recent advent and improvements of sTSLIM combine the benefits of traditional histology, nondestructive imaging, and 3D reconstructions as ears can be readily imaged at high resolution, accurately reconstructed, and used for subsequent analysis (Santi et al., 2009). Here, we will, for the first time, illustrate how this technique presents the next generation to inner ear developmental analysis allowing complete quantification of morphological and cellular changes in a developing ear, as previously demonstrated in adult mutant ear analysis (Kopecky et al., 2011; Pan et al., 2011). We describe the 3D morphogenesis of the mouse ear combined with neurosensory formation, from early embryonic development through young adulthood in mice. Indeed, many single gene mutations affect simultaneously the morphology of the developing ear as well as, to a variable degree, the histological development, indicating that morphogenesis and histogenesis are intricately interwoven in space and time (Ma et al., 2000; Pauley et al., 2006; Nichols et al., 2008). Our aim is to provide a standardized procedure for future analysis of mutant murine ears, detailing the aberrant developmental processes and complete quantification of mutations to allow direct comparison to aberrant human ear development resulting from mutations in the same genes. The description we provide here using a mouse embryo series is to be complemented with human embryos preferentially of a genotype for which mouse mutant ears are already available (Streeter, 1906, 1917). Such a comparison will allow aligning human ear deficits with the phenotype of mouse ears with human generated genotypes to better understand how human genetic defects relate to ear defects of the same gene in the mouse and thus comparison of similar defects in different gene networks for enhanced translatability of mouse model ear defects.
RESULTS
Major Morphogenesis Occurs Between E11.5 and E15.5
At embryonic day (E) 8.5, the inner ear exists as a thickening of ectoderm adjacent to the hindbrain. This ectodermal thickening, known as the otic placode, has yet to undergo any morphogenesis, despite the onset of tremendous molecular changes. Between E8.5 and E10.5, the otic placode invaginates to form the otic cup and, subsequently, the otic vesicle (or otocyst). During this invagination process, the inner ear’s axes are defined and the inner ear begins its morphogenetic process, which by postnatal day 15 (P15), is morphologically complete. We describe in detail the tremendous growth and development between E11.5 and P15.
At E11.5, the otocyst had all axes defined with a wide dorsal pouch and a narrow ventral pouch (Fig. 1). The ventral tip had a slight medial curvature (Fig. 2). Medially, the endolymphatic duct was prominent (Fig. 3). There appeared to be a slight bulge in the area of the presumptive horizontal canal on the lateral surface (Fig. 1) and formation of the vertical canal plate on the posterior edge (Fig. 4). Despite striking increases in overall size over the next 4 days (E11.5–E15.5), the cystic otocyst maintained its endolymphatic fluid volume (Fig. 4).
Fig. 1.
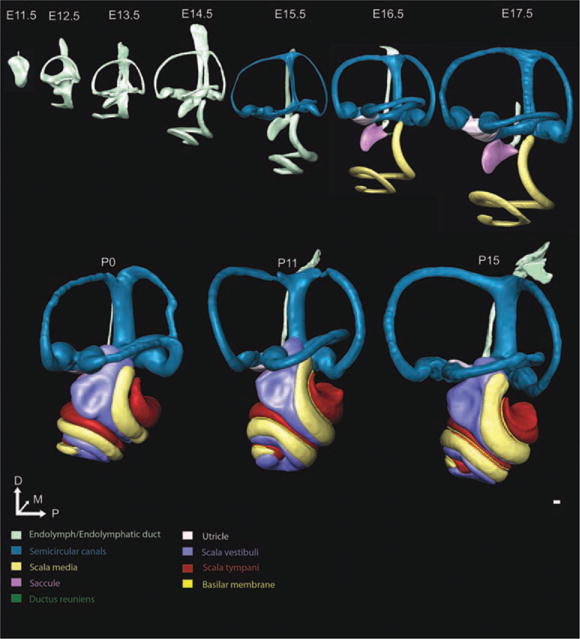
Lateral view of morphogenesis of inner ear development. Three-dimensional (3D) reconstructions of embryonic day (E) 11.5, E12.5, E13.5, E14.5, E15.5, E16.5, E17.5, postnatal day (P) 0, P11, and P15 mouse inner ears show the shape changes and growth over embryonic and early postnatal development. Once structures are unequivocally defined, we segmented them a different color, with the color-coded chart shown. The ear begins as a small otocyst at E11.5. From E11.5 to E14.5, the ear grows without an increase in endolymphatic fluid as the canal plates resorb into thin canals. At E15.5, the formation of the utriculosaccular foramen almost separates the saccule from the more dorsal vestibular structures. At E16.5, the ductus reuniens allows the identification of the saccule and cochlear duct. In addition, the utricle can be uniquely identified relative to the canal cristae, marking the first age at which all six sensory epithelia are distinct with this technique. While the majority of the morphogenesis appears complete at this time, including near full coiling of the cochlear duct, the inner ear continues to grow and differentiate histologically until P15. The perilymphatic scalae can be identified as early as E14.5; however, they were unable to be segmented until P0 due to incomplete maturation. Structures are shown to scale to appreciate the growth that occurs during development. Scale bar = 100 μm.
Fig. 2.
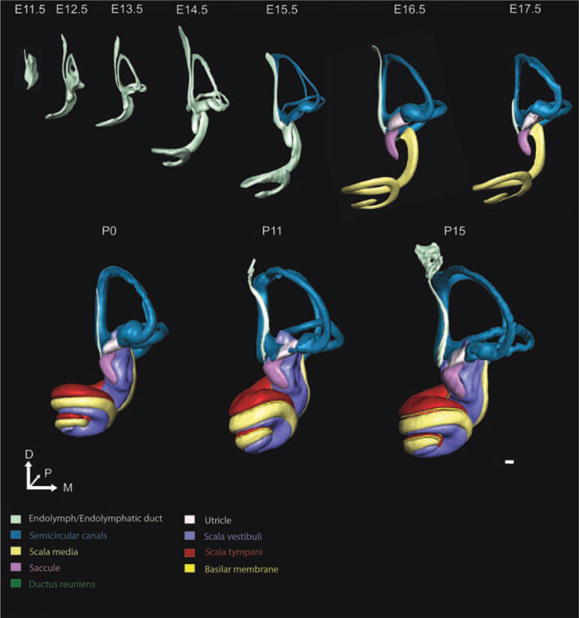
Anterior view of three-dimensional (3D) development of the ear. The 3D reconstructions of embryonic day (E)11.5, E12.5, E13.5, E14.5, E15.5, E16.5, E17.5, postnatal day (P) 0, P11, and P15 mouse inner ears show the morphogenesis and growth over embryonic and early postnatal development. We have rotated the ears, initially seen in Figure 1, to enable visualization of ear development from the anterior perspective. While overall change over time is the same as shown in Figure 1, the anterior perspective enables understanding of the dramatic change in the ventral portion of the inner ear as the cochlea extends medially and coils initially toward the anterior pole, seen most clearly at E12.5 and E13.5. This perspective, furthermore, enables illustrating the development of the canals and anterior canal crista. The endolymphatic duct is also prominent as a structure anterior and medial to the common crus. It is now easy to see the saccule extending anteriomedioventrally from the middle portion of the ear. From E13.5 to E16.5, the saccule develops a slight curvature which ultimately forms around the scala vestibuli by P0. Structures are shown to scale to appreciate the growth that occurs during development. Scale bar = 100 μm.
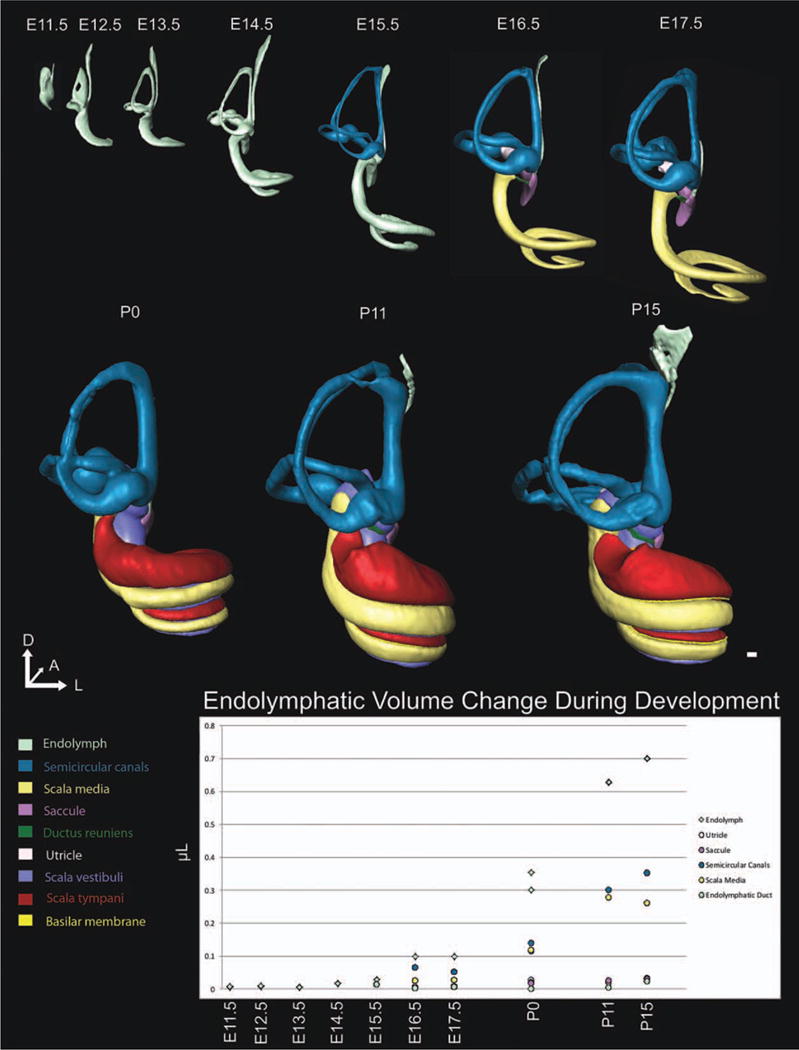
Fig. 3.
Medial view of three-dimensional (3D) development of the ear. The 3D reconstructions of embryonic day (E)11.5, E12.5, E13.5, E14.5, E15.5, E16.5, E17.5, postnatal day (P) 0, P11, and P15 mouse inner ears show the morphogenesis and growth over embryonic and early postnatal development. We have rotated the ears to enable visualization of ear development from the medial perspective. While overall change is the same as shown in Figure 1, the medial perspective enables understanding of the dramatic changes in the endolymphatic duct, cochlea, and utricle. At E12.5, the endolymphatic duct is mostly uniform in width; however, by E13.5 and prominently by E14.5, a wide dorsal endolymphatic sac and narrow ventral endolymphatic duct are evident. Note that the endolymphatic duct narrows substantially at E17.5 such that it could no longer be consistently identified. Furthermore, the cochlear duct initially extends laterally at E11.5, coils anteriorly at E12.5, and then medially by E13.5. Lastly, the utricular development is obvious from the medial view as the utricle (shown in white) is not uniquely identifiable until E16.5. Structures are shown to scale to appreciate the growth that occurs during development. Scale bar = 100 μm.
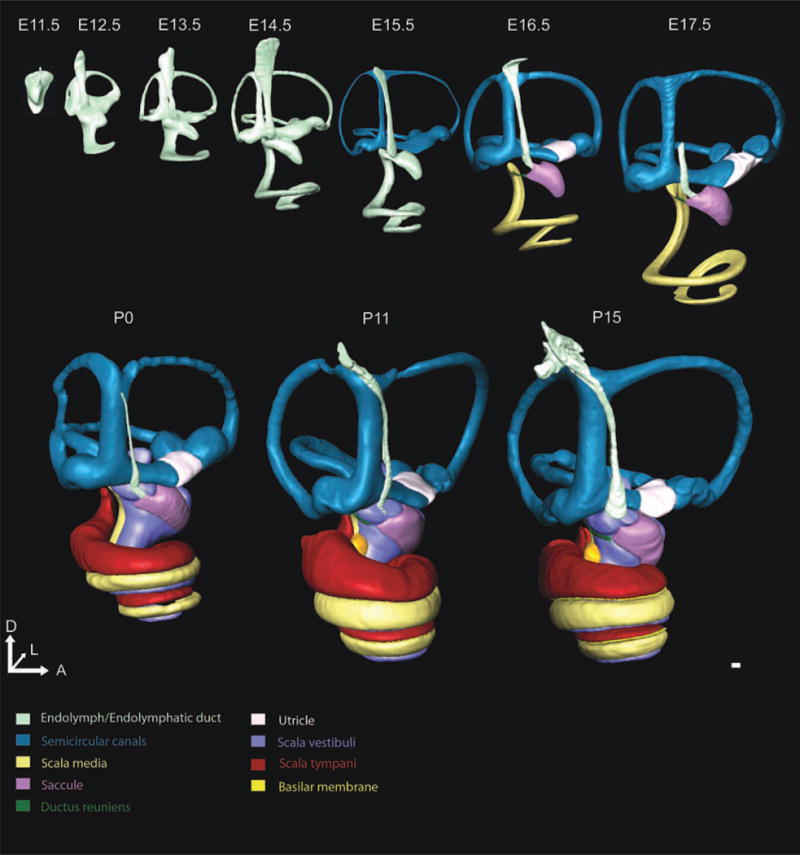
Fig. 4.
Posterior view of three-dimensional (3D) development of the ear. The 3D reconstructions of embryonic day (E)11.5, E12.5, E13.5, E14.5, E15.5, E16.5, E17.5, postnatal day (P) 0, P11, and P15 mouse inner ears show the morphogenesis and growth over embryonic and early postnatal development. We have rotated the ears, to enable visualization of ear development from the posterior perspective. While overall change is the same as shown in Figure 1, the posterior perspective enables understanding of the dramatic change in the ventral portion of the inner ear as the cochlea extends medially and coils initially toward the anterior pole. This perspective enables the ability to illustrate the development of the canals and posterior canal crista. At E12.5 the vertical canal plate has only begun its resorption process; however, by E13.5 this process is nearly complete. Also note the difficulty in identifying the endolymphatic duct, saccule, and utricle as these structures are anteriorly defined. Structures are shown to scale to appreciate the growth that occurs during development. After segmentation is complete, Amira is able to calculate the volume of each 3D rendering. However, until E15.5, only overall endolymphatic fluid was measureable. While there is obvious overall growth of the ear between E11.5 and E15.5 (Fig. 1), there is only a slight increase in endolymphatic volume, likely due to the fact that at E11.5 a single, large otocyst exists but in the next few days this large lumen is subdivided into unique recesses, keeping overall lumen space constant despite the overall increase in size. However, upon definition of all unique recesses by E16.5, a considerable and consistent increase in endolymphatic volume is observed. Note that x-axis is not to scale and fluid volume from E11.5, E12.5, E13.5, E14.5, E16.5, and P0 are means of two littermate ears. Scale bar = 100 μm.
The morphogenetic steps between E11.5 and E12.5 (Figs. 1–4) were the most dramatic one day change that we identified. Dorsally, the vertical canal plate fused and was partially resorbed by apoptosis, as previously described (Fekete, 1999), to form an identifiable common crus and the anterior and posterior semicircular canals (Fig. 1). The horizontal canal plate became defined. The thin ventral pouch had developed into a prominent half turn cochlear duct extending anteromedioventrally from its base (Figs. 2, 4). The endolymphatic duct was characterized as both the wide endolymphatic sac and its much thinner stalk (Fig. 3). The presumptive saccular recess was identified as a small outcropping anteroventral to the midline of the ear (Fig. 2).
E13.5 (Figs. 1–4) was a time of continued growth and development of the inner ear, still without notable increase in endolymphatic fluid (Fig. 4). The vertical canal plate was nearly fully resorbed with a wide common crus and new bulging apparent in the area of the presumptive canal cristae (Fig. 1). The horizontal canal plate expanded laterally while the space between the growing plates continued resorbing. The cochlear duct thinned while expanding to three-fourths of a turn (Fig. 5). The endolymphatic duct became more mature appearing through widening of its dorsal sac and thinning of its more ventral stalk (Fig. 3). The saccule and utricle were now prominent fixtures of the inner ear with the saccular recess continuing its expansion anteroventrally (Fig. 2). The saccule and utricle were not in their adult orientation but were perpendicular to each other with the utricle in the horizontal plane and the saccule in the vertical plane (Fig. 2). Despite their now distinct features, there was no evidence of an utriculosaccular foramen or ductus reuniens.
Fig. 5.
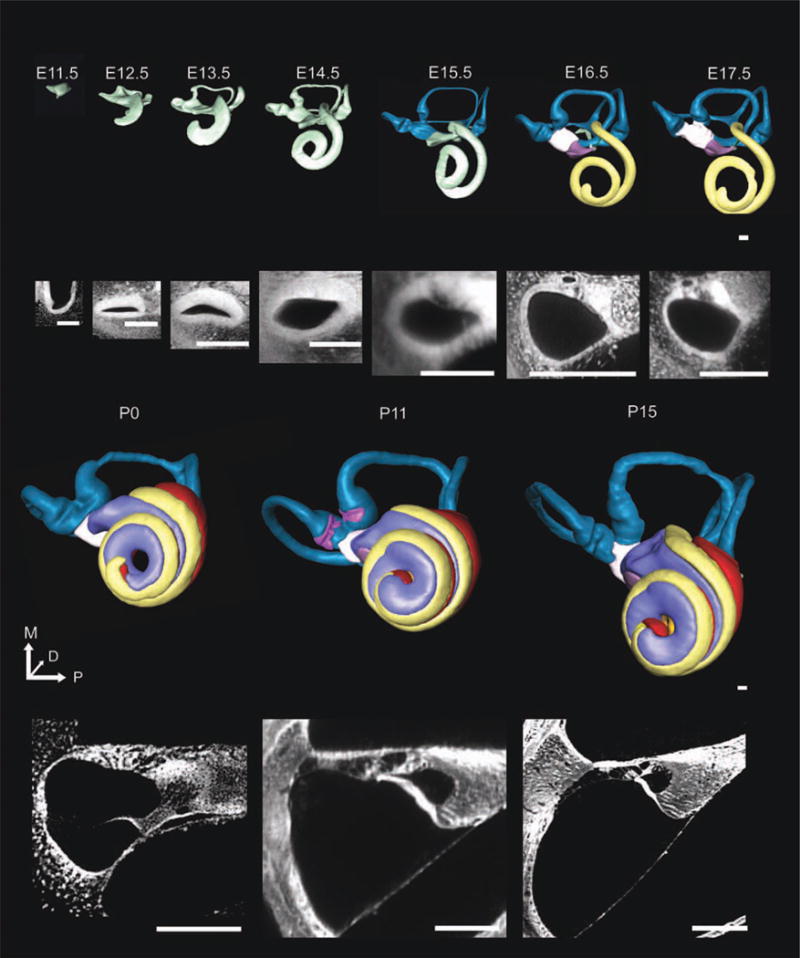
Growth and elongation of the forming cochlea. Three-dimensional (3D) reconstructions and 2D optical sections of the developing ear are shown together in Figure 5. The ventral view shows that the tightly coiled cochlear duct emerges as a small protrusion of the ventral tip of the polarized otocyst at embryonic day (E)11.5. The presumptive scala media extends to a half turn at E12.5, three-quarters of a turn by E13.5, one and a half turns by E14.5, one and three-quarters turns by E15.5. At E16.5, the cochlear duct is now distinct from the saccule. By postnatal day (P) 0, all three scalae are observed with little additional maturation after this point. The 3D development is simultaneous with the development of the undifferentiated cochlear duct into the organ of Corti. Between E11.5 and E13.5, the cochlear duct appears to have a thicker boundary of undifferentiated cells on the neural side while having a thinner border of cells on the abneural side (2D sections are below representative 3D image). At E15.5, the middle portion of the thicker side as seen on cross-section begins to develop the organ of Corti as seen by the increasing transparency of the differentiating cells. At P0, the tectorial membrane, three scalae, and organ of Corti can be seen. P11 and P15 images show a mature organ of Corti. The 3D image scale bar = 100 μm. Scale bar for E11.5 2D = 20 μm; remainder of 2D = 100 μm.
By E14.5 (Figs. 1–4), gross inner ear morphogenesis appeared to be nearly complete except for the formation of the ductus reuniens and utriculosaccular foramen and the remaining development of the cochlea, including full cochlear extension and definition of the three scalae (Fig. 1). Bulging of the canal crista ampullae was apparent (Figs. 1–4). The utricle and saccule had sparse populations of precursor neurosensory cells and the first signs of the otoconia were present (Takumida et al., 1986). The saccule acquired a slight ventral curvature (Fig. 2) and the cochlear duct continued to lengthen (Figs. 5, 6).
Fig. 6.
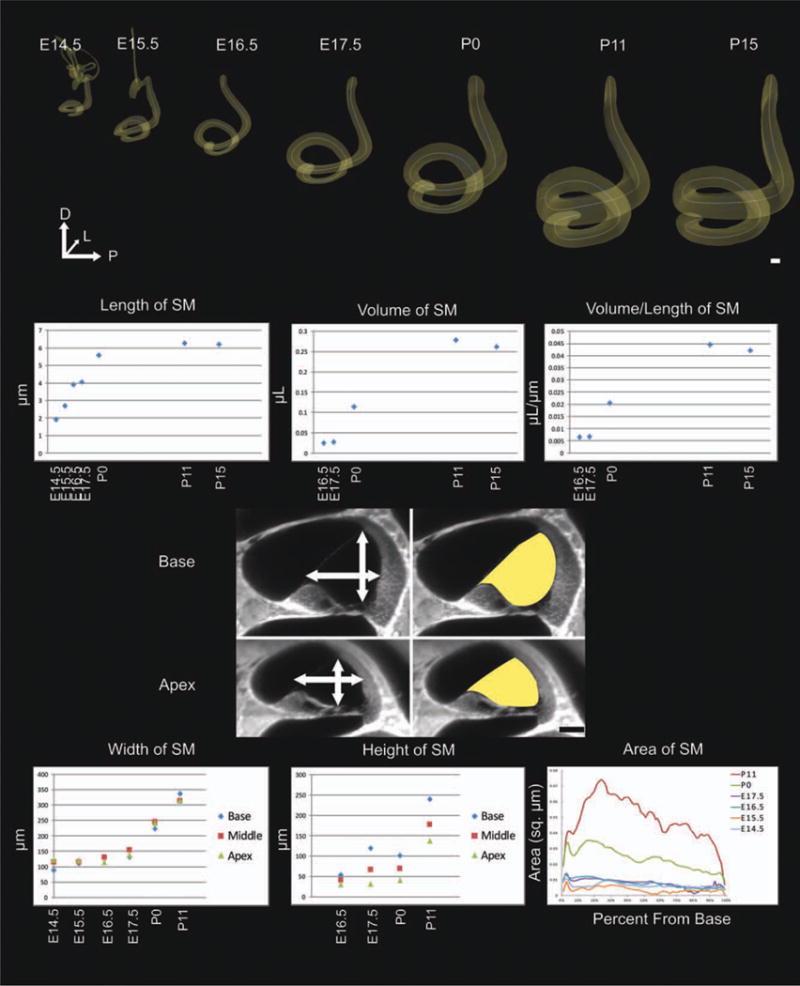
Growth of the cochlear duct. Beginning at embryonic day (E) 16.5 with the formation of the ductus reuniens, volume measurements can be obtained from the 3D renderings of the growing cochlear duct. Starting with the secondary growth extension of the base of the cochlear duct, length measurements can be accurately determined by creating B-Spline curve fits through the center of the cochlear duct from base to apex. Both the volume and length increase until at least postnatal day (P) 15, but they increase most significantly from E14.5 to P0. Additionally, the volume of the cochlear duct grows with delay compared with the length as shown by the volume to length ratio. From E14.5 to P11, there was a gradual increase in cochlear duct width proportional in the base, middle turn, and apex; however, the height of the base increased more than the middle turn and significantly more than the apex. This differential height increase resulted in a decreased cross-sectional area, starting at P0, in the apex. Scale bar = 100 μm.
E15.5 (Figs. 1–4) marked the first time we could unequivocally define the distinct cochlear duct and saccule from the dorsal vestibular epithelia with the formation of the utriculosaccular foramen, shown by changing from light green endolymphatic space to now color-coded epithelia associated recesses (Fig. 1). This also marked the first time at which we could track the volume change in distinct recesses of the inner ear (Fig. 4). While the ductus reuniens was noticeable as a wide connector between the cochlear duct and the saccule, without cellular markers, we could not distinctly identify the cochlear duct from the saccule. Nonetheless, we are able to quantify the length of the cochlear duct beginning at E14.5 due to its distinct region of secondary growth at its base (Fig. 6). Between E15.5 and E16.5 (Figs. 1–4), the utricle, saccule, and cochlear duct became distinct. E17.5 (Figs. 1–4) marked a time of continued maturation and definition of sensory structures.
Inner Ear Neurosensory Units Differentiate Between E15.5 and P0 with Full Maturation by P15
Despite early growth of the ear in overall size, endolymphatic fluid volume only minimally increased (Fig. 4), likely due to the changes resulting from a single large otocyst to a structure containing multiple distinct subdivisions. However, these major subdivisions were mostly completed with the formation of the ductus reuniens and utriculosaccular foramen shortly after E15.5, at which time the endolymphatic space expanded dramatically until P15 (Fig. 4). Despite this enormous increase in volume of the endolymphatic space volume between E15.5 and P15, there were no more obvious morphologic changes beyond growth (Figs. 1–4). However, this time period marked the maturation of the endolymphatic and perilymphatic spaces (Figs. 5–8).
Fig. 8.
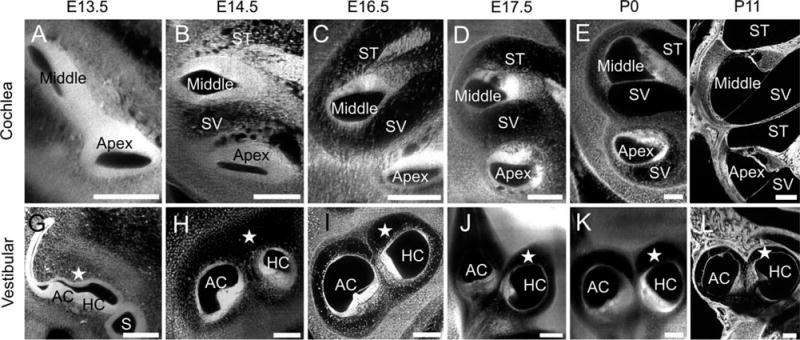
Development of perilymphatic space is similar in auditory and in vestibular systems. Two-dimensional (2D) optical sections of the ear show that the ventral portion of the inner ear consists of the endolymph-filled cochlear duct. Eventually, this endolymphatic cochlear duct will be defined as the scala media as both a scala vestibuli and scala tympani form perilymphatic spaces on either side. A: We notice that at E13.5, the cochlear duct is well-defined; however, the future scalae vestibuli and tympani cannot be seen. B: A day later, the perilymphatic spaces begin to form, yet, they remain highly immature for the next few days, consisting of many small spaces bound by fibrous tissue, and have no defined boundary. C: By E16.5, the scalae near the middle of the cochlea can be demarcated, however they are still mostly immature and consist of fibrous material throughout; at the same age, the scalae in the apex of the cochlea appear much less mature, are still quite densely filled, and cannot be demarcated. D,E: At E17.5 (D) and P0 (E), the middle turn scalae are well-defined; however, the slower maturing apical scalae are incompletely formed. Nonetheless, they are well-enough-defined at this point that the entire scalae can be segmented for the first time at P0. F: By P11, the scalae throughout the cochlea are fully mature. Of interest, this maturation of perilymphatic space in the cochlea neatly mirrors the same maturation of perilymphatic space in the vestibular system. For ease of description we restrict our images to the spaces around the anterior and horizontal canal cristae. G: At E13.5, only endolymphatic space can be seen with no obvious signs of the future perilymph. However, similar to the cochlea, by E14.5, less dense spaces can be seen surrounding the canal cristae. H: While this future perilymphatic space cannot yet be defined, it is clearly noticeable. I: At E16.5, the canal cristae are well-defined with the perilymphatic space nearly completely mature, yet some fibrous strands are noticed, identical to the maturational age in the cochlea. J–L: By E17.5 (J) and P0 (K), the perilymphatic space is nearly mature with no noticeable difference between P0 and P11 (L). *indicates perilymphatic space. ST, scala tympani; SV, scala vestibuli; AC, anterior crista; HC, horizontal crista. Scale bars = 100 μm.
Morphogenesis and Neurosensory Development of the Cochlea
The undifferentiated cochlear duct began its growth at E11.5 and was mostly differentiated by P15 (Fig. 5). The cochlear duct extended anteromedioventrally from the midline of the inner ear. In doing so, the cochlear duct narrowed and elongated from a slight protrusion at E11.5 to over two complete turns by full maturation. Both the length of the cochlear duct and the volume continued to increase from E15.5 to P15, but the rate at which the volume grew dramatically decreased after birth (Fig. 6). Furthermore, it was apparent that the volume increased faster than the length grew (Fig. 6).
These drastic changes externally were mirrored by an equally complex, and often interconnected process, internally. Much like the formation of the inner ear as a whole, the cochlea underwent its most drastic elongation between E11.5 and E15.5 (Fig. 5). After E15.5, despite the additional volume and length changes just noted (Figs. 4, 6), the most evident change was the cellular differentiation of an undifferentiated organ of Corti to a mature hearing organ. At E11.5 and E14.5, the cochlear duct, while defined, had no distinct sensory epithelia except for slight thickening of cells on the neural side. Between E15.5 and P0, the cochlea underwent its most dramatic stages of cellular differentiation as the presumptive organ of Corti was easily identifiable as translucent densities on the neural (thickened) side. While all mature structures were present at P0 (Fig. 1), the cochlea was still immature, as suggested by the tectorial membrane which was yet to extend to the outer hair cells. Remaining immature hair cells matured (Takumida and Harada, 1984), and with the thickening and growth of the tectorial membrane to cover the outer hair cells (Rueda et al., 1996), the organ of Corti was mature at P11 (base; Fig. 5) and P15 (apex; Fig. 5). In summary, major morphogenetic changes occurred in the cochlea between E11.5 and E15.5 with only minor morphogenesis occurring between E15.5 and P15. However, major steps in neurosensory differentiation transformed the undifferentiated and immature cochlear duct into a duct containing the functional organ of Corti beginning at E15.5.
Morphogenesis and Neurosensory Development of the Saccule, Utricle, Ductus Reuniens, and Utriculosaccular Foramen
The development of the utricle, saccule, and cochlear duct resulted from the formation of nonsensory constrictions between the utricle and saccule and between the saccule and cochlear duct (Fig. 7). Up until E14.5, despite the obvious recesses of the presumptive saccule and cochlear duct, the sensory epithelia were indistinguishable (Fig. 7A–H). At E15.5, there was substantial thinning of the spaces between the utricle and saccule and between the saccule and cochlear duct (Fig. 7I–L). This was the first stage at which the nonsensory constriction of the utriculosaccular foramen clearly separated the dorsal vestibular structures and the saccular maculae. While the presumptive utricle was clear, the sensory epithelia were still indistinguishable from the horizontal and anterior canal cristae. Despite a similar thinning and nonsensory formation of the presumptive ductus reuniens, there was not yet a clear demarcation between the saccule and the base of the cochlear duct. At E16.5, both the utriculosaccular foramen and ductus reuniens were prominent (Fig. 7M–P). Furthermore, the utricular macula was clearly separated from the canal cristae. This was the first stage at which all six sensory epithelia were clearly distinct in our optical sections. By E17.5, the non-sensory constrictions had clearly defined all six epithelia both at the cellular level and in the 3D reconstructions (Fig. 7Q–T).
Fig. 7.
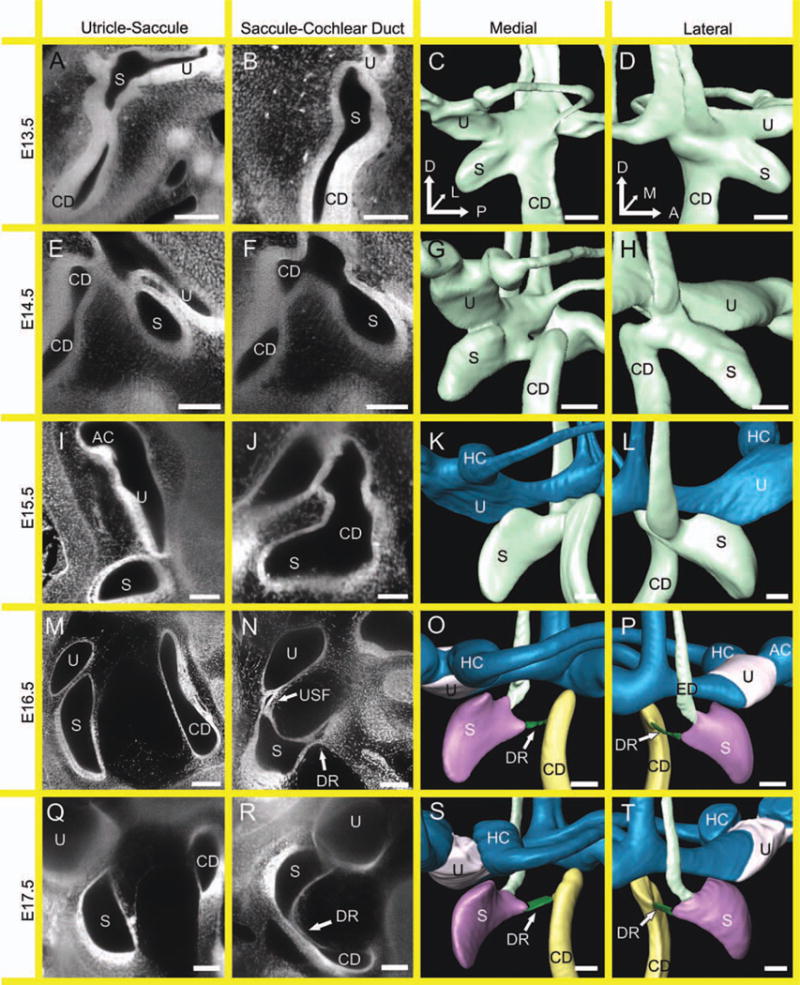
Development of the saccule and utricle are defined by nonsensory constrictions. Two-dimensional (2D) optical sections and 3D renderings show that the saccule and utricle are formed through the development of the nonsensory constrictions of the utriculosaccular foramen and ductus reuniens. These separate the utricle, the saccule, and the cochlea. Furthermore, the utricular macula must also become distinct from the anterior and horizontal canal cristae. A,B: At embryonic day (E) 13.5, the utricle cannot be distinguished from the saccule (A), nor can the saccule be distinguished from the cochlear duct (B). C,D: As such, despite their 3D appearances of distinct recesses, the actual sensory epithelia are far from distinct. E: At E14.5, the space between the utricle and saccule is narrowing, yet the epithelia are still indistinguishable. F: The same is true for the saccule and cochlear duct. G: However, there is apparent thinning between the utricle, saccule, and cochlea seen from the medial perspective. H: The thinning between the saccule and cochlear duct is also seen from the lateral perspective. I: At E15.5, the utricle is distinguishable from the saccule through the formation of the utriculosaccular foramen. However, even at this stage the utricular macula is indistinguishable from the horizontal cristae without the use of molecular markers (I). J: Despite the formation of the utriculosaccular foramen, the ductus reuniens has yet to form. K,L: The change in color of the vestibular apparatus signifies the formation of the utriculosaccular foramen and the separation of the utricle/semicircular canals from the saccule. M,N: At E16.5, the utricle, saccule, and cochlear duct are all distinct (M) with the formation of the utriculosaccular foramen and ductus reuniens (N). Furthermore, the utricular macula can be identified distinct from the canal cristae. O,P: Therefore, E16.5 marks the first time point where all six sensory epithelia in the inner ear can be identified without the aid of molecular markers. Q–T: The E17.5 marks additional separation of the utricle, saccule, and cochlear duct and the maturation of the utriculosaccular foramen and ductus reuniens. CD, cochlear duct; S, Saccule; U, utricle; AC, anterior crista; HC, horizontal crista; ED, endolymphatic duct; DR, ductus reuniens; USF, utriculosaccular foramen. Scale bar = 100 μm.
Development of Perilymphatic Space Is Similar in Auditory and in Vestibular Systems
For nearly 100 years, the perilymphatic scalae were known to develop on either side surrounding the cochlear duct and future scala media through a process of resorption (Streeter, 1917). This process occurred in a base to apex gradient that commenced at E13.5 (Fig. 8A), decreased cellular density in the presumptive perilymph scalae at E14.5 (Fig. 8B), defined scalae in the middle turn at E16.5 (Fig. 8C) and E17.5 (Fig. 8D), and was completed by P0 (Fig. 8E) with final maturation in the apex by P11 (Fig. 8F). However, much less studied was the similar perilymphatic development of the vestibular spaces. At E13.5, the endolymph-filled canals and canal cristae were well-defined, but surrounding these fluid filled spaces was dense tissue, not perilymphatic fluid (Fig. 8G). However, by E14.5, the density of the presumptive perilymphatic spaces appeared to be decreasing (Fig. 8H). Much like the maturational process of the scalae in the cochlea, gradual development occurred simultaneously in the vestibular apparatus and cochlear system such that by P0, the vestibular perilymph was as well-defined around the canals as it was in the scala vestibuli and scala tympani (Fig. 8I–L). However, unlike the base to apex gradient in the cochlea, there was no apparent gradient in the vestibular system. In summary, the formation of perilymphatic space developed along the same timeline in the cochlea and canal perilymphatic spaces indicating the potential for a yet-to-be defined similarity in molecular guidance, warranting further study into this observation using appropriate mutants with deficits in perilymphatic space formation such as Lmx1a (Nichols et al., 2008).
Development of Cranial Nerve VIII
The future vestibular and spiral ganglion cells delaminated from the anterolateral portion of the otocyst (Cantos et al., 2000; Yang et al., 2011; Fig. 9A–C). Spiral ganglion neurons were identifiable by E12.5 in the inner ear (Fritzsch, 2003) and showed processes to the cochlear duct and to the central cochlear nucleus (Fig. 9D–F). By E13.5, more neurites projected peripherally but there was no evidence of radial fibers (Rubel and Fritzsch, 2002; Appler and Goodrich, 2011; Fig. 9G–I); it was not until the onset of hair cell differentiation in the base of the cochlea at E14.5 that spiral ganglion neurons formed discernable radial fibers (Morris et al., 2006; Fig. 9J–L). Innervation density at E15.5 was greatest in the mid-base, corresponding to the first regions of hair cell differentiation (Fig. 9M–O). Identification of spiral ganglion neurons have been described previously (Johnson et al., 2011; Pan et al., 2011). These neurons gradually matured into their adult structures by P15 (Fig. 9Y–AA).
Fig. 9.
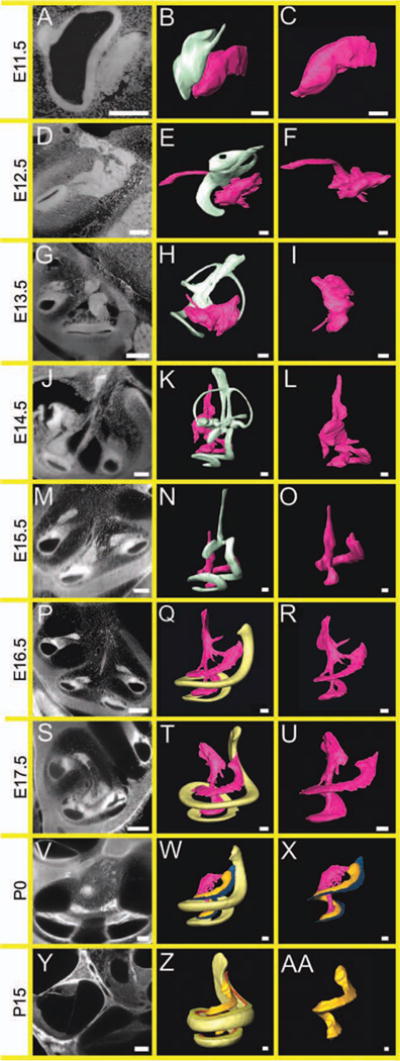
Development of innervation to the inner ear. Two-dimensional (2D) optical sections and 3D renderings show that the innervation of the ear connects the ear to the central auditory pathways. A,B: While this innervation is present at E11.5 (A), fibers cannot be traced to the ear (B). D–L: However, with the initiation of cochlear maturation, processes can be traced to the elongating cochlear duct (D–F), with greatest maturation between E13.5 (G–I) and E14.5 (J–L); at which point hair cells have begun to differentiate. M–O: At E14.5 and E15.5, spiral ganglion neurons become distinct in Rosenthal’s canal. P–R: By E16.5, these neurons are in contact with the immature organ of Corti. S–X: Between E17.5 and P0, the density of innervation appears to increase (S–U) and at P0, spiral ganglion cells can be clearly seen, separating “nervous tissue” into Rosenthal’s canal, the modiolus, and radial fibers (V–X). Y,Z,AA: By P15, the neuronal circuitry is mature (Y,Z) as shown by full elongation of Rosenthal’s canal (AA). Left column is 2D cross-section at stated age. Middle column represents neuronal interaction with the developing ear. Right column shows neuronal maturation. Scale bar = 100 μm.
SUMMARY
We have chronicled and quantified, in detail, the developmental maturation of the inner ear from an undifferentiated otic vesicle to six distinct endorgans residing in their specific recesses surrounded by periotic space and innervated by distinct sensory neuron aggregations. Our data is consistent with current theories on inner ear morphogenesis but for the first time, we illustrate the ability to quantify the morphometric changes that occur and show simultaneously the morphogenesis of the ear and the cellular differentiation of the neurosensory tissues. During this time, the endolymphatic spaces greatly increased in volume, and by E16.5, all sensory epithelia could be defined and were shown to continue to grow until maturation. While there was distinct morphogenesis and growth occurring between E11.5 and E15.5, there was no significant increase in endolymphatic space. The time period after E15.5 until P15 marked a tremendous degree of neurosensory development and final maturation of the cochlea and the vestibular saccule, utricle, and canal cristae, coupled with substantial growth and endolymphatic fluid increase.
Because of the relative size of the adult ear to an embryonic ear, we decided to image not only E11.5–P15 ears, but also the entire hemisected head, where possible (E11.5, E12.5, E13.5, E15.5, and E16.5). These additional sections provided us with the ability to visualize various aspects of middle ear and hindbrain development. Indeed, these sections can provide additional insights such as middle ear development not described in this analysis. In summary, we introduce a technique that can easily be applied to both qualitatively and quantitatively compare wild-type and mutant mouse models during embryonic development.
DISCUSSION
Evolution of Ear Development Reconstruction
George Linius Streeter (Streeter, 1906, 1917) was the first to use a 3D reconstruction technique to visualize the ear development of the endolymphatic and perilymphatic spaces and the inner ear innervation using human material of the Carnegie collection, where he became the second director. These reconstructions were, and still are, used to illustrate the complex morphogenesis of the otic spaces and the associated innervation. The unsurpassed details of these reconstructions entered them into many textbooks and influenced the impression of ear development in many generations of students over the 20th century. Unfortunately, his technique never entered the research laboratories in a meaningful way due to its laborious and time consuming reconstructions formed out of sectioned material. More recent efforts to use sectioned material for reconstruction of digitized images fell short of the already achieved detailed description of ear development found in these 100-year-old reconstructions (Yasuda et al., 2007) and thus never were adopted in research.
Only with the advent of paint-filling by Martin and Swanson (Martin and Swanson, 1993) was a new technique made available that was used extensively to analyze the inner ear endolymphatic space development in normal and mutant mice (Morsli et al., 1998) and other vertebrates (Bever and Fekete, 2002; Bever et al., 2003) in over 100 papers. The ease of use made the paint-filling technique the method of choice to image endolymphatic space development. Properly supplemented by sections showing gene expression and patterns of innervation, this technique became a cornerstone of modern mouse ear development studies. However, the limitation of this technique is that any inter-individual variations in morphogenesis will not be easily correlated with the underlying histological changes as morphology and histology cannot be visualized simultaneously. In addition, the paint-filling technique does not render itself to easy digitization, morphing, and 3D rotations for optimized investigations and imaging of the changed morphology, all issues overcome with the sTSLIM technique.
We present here a technique that combines the reconstruction of digitized optical sections, comparable to the Streeter approach (but without the histological drawbacks such as section distortions and alignment issues), with a 3D rendering process to visualize not only the endolymphatic space (as in the paint-filling technique) but to image simultaneously all development of endolymphatic and perilymphatic spaces, innervation, and sensory organ development in high resolution optical sections down to cellular levels. In addition, our technique allows 3D rendering of all parts of the ear individually or in combination, allows morphing of shapes into each other and full 3D rotations to image the renderings from any possible angle of interest. Our approach avoids some of the pitfalls of earlier techniques (section alignment issues, excessive shrinkage) and is the only method that allows complete morphometric quantification of all changes in actual 3D space and thus adds valuable numerical data to the aesthetical pleasing digitized images. We hope that our approach will exert as lasting an influence as Streeter’s initial 3D reconstructions had, but that our easier technique will be used as extensively as paint-fillings have been used over the past 20 years in laboratory work.
sTSLIM Provides Additional Perspective Enabling Unique Insight Into Growth and Morphogenesis
This study highlights the ability of sTSLIM to nondestructively image early embryonic hemisected heads or late embryonic/postnatal ears to provide high resolution optical sections that can subsequently be segmented to provide 3D reconstructions of the inner ear. The resulting 3D reconstructions provide analysis of not only the development of the ear as a whole, but can be broken down into the distinct subunits of the ear when they become discretely visible. Therefore, we can visualize the 3D growth and morphogenesis of the individual sensory units and can fully quantify all dimensions, unlike other attempts for 3D rendering before. Additionally, we can view the cross-sections to directly compare the 3D development with the neurosensory and nonsensory differentiation of the ear for added clarity of the degree of development in optical sections that are equivalent to paraffin histology in their resolution (Yasuda et al., 2007). Future improvements of sTSLIM or other high resolution optical imaging techniques may provide images of comparable resolution to present histologic techniques.
Currently, microCT has been used to image human ears in patients suffering from disease, for example, from CHARGE syndrome (Glueckert et al., 2010). While microCT has been used for both human, other large mammal ears (Seifert et al., 2011), and even fossils (Luo et al., 2011), it does not yet have a high enough resolution for smaller animals and certainly cannot provide the resolution needed for the developing mouse ear. However, if we were able to image, for example, a mouse model of CHARGE syndrome (Hurd et al., 2011), which has been imaged and characterized in human (Glueckert et al., 2010), we would be able to provide an accurate calibration between sTSLIM imaging in mouse and in man. Such a comparison would allow for the comparison of morphometric differences in the same mutations across species and thus help validate the appropriateness of the mouse mutations for the human genetic disease.
Segmentation is a time consuming process and is the limiting factor in the current state of 3D reconstructions. Ultimately, autosegmentation may facilitate higher sample size numbers, ease the collection of more closely spaced series of developmental stages for detailed segregation of hard to resolve morphological separations, eliminate human errors, provide more consistent segmentation, and enable the ability to segment many more structures within each section (Sun et al., 2011).
Morphological Development of the Ear and Neurosensory Differentiation
We show that the inner ear both grows in size and transforms from an elongated sac at E11.5 to a nearly mature appearing ear in only 4 days (Fig. 1). Sensory epithelia have already begun developing by E14.5 (Fig. 3) and all six presumptive endorgans can be defined by E16.5 (Fig. 5). In contrast to this fast acquisition of the overall form, neurosensory differentiation is not complete until early postnatal stages (Fig. 3). This illustrates that morphogenesis and neurosensory development occurs partially overlapping. While this fact has been well established through mergers of independent observations, we introduce the ability to analyze both 3D morphogenesis and neurosensory development concomitantly, a tool of immense advantage when analyzing genetic models that disrupt either morphogenesis or neurosensory development exclusively (Pan et al., 2011), or both simultaneously (Kopecky et al., 2011). Importantly, our data are the first to demonstrate that the initial sculpting of the otic vesicle into the near mature form is conducted without massive changes in the total volume. In contrast, only once the near mature form is achieved, the endolymphatic fluid volume begins to increase, possibly due to the increased endolymphatic secretion previously suggested as a driving force (Kim and Wangemann, 2010). As shown in mouse models of endolymphatic hydrops, cochlear lumen volume is defined through the balance between vestibular endolymphatic fluid secretion and endolymphatic sac absorption (Kim and Wangemann, 2010), but this interplay appears only to begin upon the formation of the vestibular labyrinth and cochlear duct, shortly after E14.5. Volumetric analysis of mutant ears with endolymphatic hydrops such as Foxi1 (Hulander et al., 2003) or limited growth are now needed to validate these suggestions.
CONCLUSIONS AND OUTLOOK
Previous techniques to analyze the ear required viscous liquids that provided a gross estimation of the development of the ear without any information at the cellular level. Other techniques that provided cellular resolution required the tedious sectioning that destroyed the ear and provided only a rough estimation of the ear’s 3D projection. sTSLIM enables nondestructive and near cellular resolution imaging of both embryonic and postnatal ears, highlighting the dramatic morphologic changes that occurs between E11.5 and E15.5 followed by the differentiation and maturation of the neurosensory cells, culminating into a functional unit by P15.
The development of the ear is a complex process and to be fully analyzed must be considered in 3D. Furthermore, as scientists knockout genes essential to the formation of the ear, 3D analysis becomes a critical tool to understand the resulting phenotypes of each valuable mouse mutant and compare the mouse phenotype with the human mutations of the same gene to understand similarities in defects and then to define changes within the context of the roughly 80% sequence similarity between human and mouse. Our sTSLIM approach can serve as a calibration tool for high resolution next generation MR imaging using high intensity magnets (10 Tesla) in specialized small animal imaging systems. Such data could provide the basis for a comparison of human mutant ears with known defects in genes for which mouse mutants exist to allow a direct correlation of mouse ear defects with human ears of affected patients. This approach could close the gap between human mutational and mouse genomic analysis at the level of the similarities of the phenotype.
EXPERIMENTAL PROCEDURES
Mice and Genotyping
One male with up to four females of C57/BL6 mice were paired in the evening. The following morning, vaginal plugs were used to determine potential fertilization. Females with plugs were separated from the breeding cage and embryos were considered to be at embryonic day 0.5 (E0.5) the noon of the day the plug was detected. The male was also separated from the breeding cage at this time and non-plugged females were re-introduced that evening to avoid potential fertilization during daytime hours. Embryos from pregnant females were collected at E11.5, E12.5, E13.5, E14.5, E15.5, E16.5, E17.5. Other pups that were born were then collected at P0, P11, and P15. Animal care and usage was in accordance with the Institutional Animal Care and Use Committee (IACUC) guidelines for the use of laboratory animals in biological research and approved (ACURF no. 0804066).
Perfusion
Pregnant mothers and/or pups were injected intraperitoneally with 0.025 ml/g of the anesthetic Tribromoethanol (Avertin) and after a surgical level of anesthesia was induced, as assessed by lack of ocular and pedal reflexes, 4% paraformaldehyde (PFA) was pumped continuously with a 30-gauge needle into the left ventricle until blood emptied. After fixation, heads were hemi-dissected and placed in 4% PFA for long-term storage at 4°C.
3D Reconstruction
Ear preparation
The 3D reconstruction of tissues using sTSLIM is a three step process: preparation of ear tissue, imaging, and segmentation. In the current study, mouse E11.5, E12.5, E13.5, E14.5, and E16.5 hemisected heads and E15.5, E17.5, P0, P11, and P15 ears were used. While the E11.5 ears could have been isolated and imaged independent of the head, sTSLIM could image through the surrounding tissues and hemisected heads were easier to mount for imaging. However, older embryos and early postnatal mice could not be imaged as hemisected heads as the increased thickness of surrounding tissues reduced resolution of ear sections. Ears and hemisected heads were decalcified in 10% EDTA for 3 days with daily solution changes. EDTA chelation is important for removing calcium (an optically opaque substance) from the tissue which would impede the imaging of the ear (Santi, 2011). While this step is only necessary for older mice when bone structures form, we prepared all the ears identically to reduce variability. After several 2-hr phosphate buffered saline (PBS) washes to wash the EDTA from the tissue, decalcified ears were dehydrated in a graded, ascending ethanol series and stained with a Rhodamine B isothiocyante in 100% ethanol for 24 hr. Two requirements must be met to image the ear, first, the ear must be translucent and, second, the ear tissue to be imaged must be fluorescent. Spalteholz clearing solution (5:3 methyl salicylate: benzyl benzoate) has been used for nearly 100 years (Wilson, 1924; Steinke and Wolff, 2001) to modify the refractive index of tissue to make the tissue transparent (refractive index is ~1.56; Santi et al., 2009). This is necessary so that the laser light-sheet can pass through the tissue and the fluorescent optical section plane can be observed without distortion. To properly use Spalteholz solution, dehydration of the tissue is necessary. Dehydration results in tissue distortion that must ultimately be quantified. However, in the current study, because all tissues were subjected to identical conditions, relative changes are accurate. Nonetheless, future techniques such as microCT or high resolution MRI would allow for imaging fresh, unfixed tissues. Staining with Rhodamine B Isothiocyanate has been successful for increasing the intensity of tissue imaging (Voie et al., 1993). Co-labeling with antibodies for hair cells, neurons, or other inner ear cell type is also possible (data not shown). Prepared ears were then mounted to a small plastic rod immersed in the specimen chamber filled with clearing solution.
Thin-sheet laser imaging microscopy (TSLIM) and scanning TSLIM (sTSLIM)
After preparation, specimens were imaged with TSLIM at the University of Minnesota. TSLIM has previously been described (Santi et al., 2009; Schacht et al., 2010; Santi, 2011) and used to image adult tissue in both wild-type and genetic mutants (Johnson et al., 2011; Kopecky et al., 2011; Pan et al., 2011). In short, a 1-mm-diameter 532 nm laser beam passes through a cylindrical lens and Gaussian beam expander creating a thin light sheet having a minimum beam width of 3.2 μm (Johnson et al., 2011). This light sheet nondestructively serially sections the xy-plane, at 5-μm thickness, of whole inner ears rendering a complete Z-stack containing the full dimensions of the inner ear and/or hemisected head in upward of 300 well-registered images using a Retiga 2000R digital camera. While some specimens (P0 and P15 ears) were imaged with TSLIM, the remainder were imaged with scanning TSLIM (sTSLIM), which is a development of TSLIM that produces a light sheet by rapidly scanning a focused line in the y-dimension using a galvano mirror rather than with a cylindrical lens (Schroter et al., 2012).This scanning system allows the introduction of a modulated pattern which, when demodulated, produces images with less out-of-focus “haze,” thus facilitating segmentation. sTSLIM has a beam waist of 4.2 μm and, like TSLIM, produces a complete Z-stack of 300+, 5-μm-thick serial sections.
3D reconstruction
The Z-stack for each inner ear was loaded into Amira ver. 5.3.3 (Visage Imaging, San Diego, CA) for 3D reconstruction of inner ear structures. To isolate different inner ear structures and compute their morphometric parameters, a process called segmentation was used. Segmentation was performed in 20-μm increments. Using Amira’s semi-automated tools, the borders of each structure of interest were outlined in a different color in every section of the stack, with similar structures indicated by the same color. We defined the scala media to include the endolymphatic space within the scala but it did not include the tectorial membrane or the inner sulcus. After segmentation, Amira provided isosurface volume reconstructions of individual inner ear structures as well as an estimate of their volume based on voxel size. The endolymphatic spaces of the scala media, semicircular canals, utricle, saccule, ductus reuniens, and endolymphatic duct were segmented. When we refer to endolymphatic volume, we refer to the combined volume of these structures. The perilymphatic spaces of the scala vestibuli and scala tympani were segmented. The epithelia of the organ of Corti, basilar membrane, Rosenthal’s canal, utricular macula, saccular macula, semicircular canal crista were segmented. Structure centroids were determined by the centerline tree module in Amira. To compute the spiral length of each structure, a smooth B-spline curve fit was computed from each structure’s centroid. Because segmentation is a time-consuming process (more than 1 week per ear in early postnatal ages, dependent on number of structures segmented), we imaged and segmented two ears at E11.5, E12.5, E13.5, E14.5, E16.5, and P0 and one ear at E15.5, E17.5, P11, and P15. Currently, segmentation is a manual process and the borders of each structure must be outlined by hand in each section. While this process is not difficult, it is labor intensive and prone to human error. Autosegmentation would enable higher throughput and eliminate human error; however, this technology is not currently available.
Supplementary Material
Key findings.
Three-dimensional reconstructions from high resolution optical sections using sTSLIM allow a unique perspective into both morphogenesis as well as neurosensory development of the ear.
The inner ear undergoes major morphogenesis between E11.5 and E15.5.
After the formation of all six sensory epithelia, the inner ear endolymphatic volume increases rapidly until P0.
From E15.5 to P0, not only does the ear grow extensively, complete neurosensory formation is completed.
Minimal changes occur after P0 and by P15 the ear is mature.
Acknowledgments
B.F. was funded by the National Institute on Deafness and other Communication Disorders (NIDCD). P.S. was funded by and sTSLIM imaging for the mouse cochleae was provided by funding from the Capita Foundation and the NIDCD. B.K. was funded by an Institute for Clinical and Translational Science TL1 award. We thank the University of Iowa Office of the Vice President for Research and the College of Liberal Arts and Sciences for support and acknowledge the P30 core grant.
Grant sponsor: National Institute on Deafness and other Communication Disorders (NIDCD); Grant numbers: RO1-DC055095590, RO1-DC007588, DC007588-03S1; Grant sponsor: The Institute for Clinical and Translational Science; Grant number: TL1 and CTSA UL1RR024979; Grant sponsor: University of Iowa Office of the Vice President for Research and the College of Liberal Arts and Sciences; Grant number: P30 core grant DC 010362.
Footnotes
Additional Supporting Information may be found in the online version of this article.
References
- Appler JM, Goodrich LV. Connecting the ear to the brain: molecular mechanisms of auditory circuit assembly. Prog Neurobiol. 2011;93:488–508. doi: 10.1016/j.pneurobio.2011.01.004. [DOI] [PMC free article] [PubMed] [Google Scholar]
- Berlanga ML, Phan S, Bushong EA, Wu S, Kwon O, Phung BS, Lamont S, Terada M, Tasdizen T, Martone ME, Ellisman MH. Three-dimensional reconstruction of serial mouse brain sections: solution for flattening high-resolution large-scale mosaics. Front Neuroanat. 2011;5:17. doi: 10.3389/fnana.2011.00017. [DOI] [PMC free article] [PubMed] [Google Scholar]
- Bever MM, Fekete DM. Atlas of the developing inner ear in zebrafish. Dev Dyn. 2002;223:536–543. doi: 10.1002/dvdy.10062. [DOI] [PubMed] [Google Scholar]
- Bever MM, Jean YY, Fekete DM. Three-dimensional morphology of inner ear development in Xenopus laevis. Dev Dyn. 2003;227:422–430. doi: 10.1002/dvdy.10316. [DOI] [PubMed] [Google Scholar]
- Bouchard M, de Caprona D, Busslinger M, Xu P, Fritzsch B. Pax2 and Pax8 cooperate in mouse inner ear morphogenesis and innervation. BMC Dev Biol. 2010;10:89. doi: 10.1186/1471-213X-10-89. [DOI] [PMC free article] [PubMed] [Google Scholar]
- Brigande JV, Kiernan AE, Gao X, Iten LE, Fekete DM. Molecular genetics of pattern formation in the inner ear: do compartment boundaries play a role? Proc Natl Acad Sci U S A. 2000;97:11700–11706. doi: 10.1073/pnas.97.22.11700. [DOI] [PMC free article] [PubMed] [Google Scholar]
- Cantos R, Cole LK, Acampora D, Simeone A, Wu DK. Patterning of the mammalian cochlea. Proc Natl Acad Sci U S A. 2000;97:11707–11713. doi: 10.1073/pnas.97.22.11707. [DOI] [PMC free article] [PubMed] [Google Scholar]
- Cross SH, McKie L, West K, Coghill EL, Favor J, Bhattacharya S, Brown SD, Jackson IJ. The Opdc missense mutation of Pax2 has a milder than loss-of-function phenotype. Hum Mol Genet. 2011;20:223–234. doi: 10.1093/hmg/ddq457. [DOI] [PMC free article] [PubMed] [Google Scholar]
- Fekete DM. Development of the vertebrate ear: insights from knockouts and mutants. Trends Neurosci. 1999;22:263–269. doi: 10.1016/s0166-2236(98)01366-6. [DOI] [PubMed] [Google Scholar]
- Fekete DM, Wu DK. Revisiting cell fate specification in the inner ear. Curr Opin Neurobiol. 2002;12:35–42. doi: 10.1016/s0959-4388(02)00287-8. [DOI] [PubMed] [Google Scholar]
- Fritzsch B. Development of inner ear afferent connections: forming primary neurons and connecting them to the developing sensory epithelia. Brain Res Bull. 2003;60:423–433. doi: 10.1016/s0361-9230(03)00048-0. [DOI] [PMC free article] [PubMed] [Google Scholar]
- Fritzsch B, Barald K, Lomax M. Early embryology of the vertebrate ear. In: Rubel EW, Popper AN, Fay RR, editors. Springer handbook of auditory research. Vol XII. Development of the auditory system. New York: Springer Verlag; 1998. pp. 80–145. [Google Scholar]
- Fritzsch B, Signore M, Simeone A. Otx1 null mutant mice show partial segregation of sensory epithelia comparable to lamprey ears. Dev Genes Evol. 2001;211:388–396. doi: 10.1007/s004270100166. [DOI] [PubMed] [Google Scholar]
- Glueckert R, Rask-Andersen H, Sergi C, Schmutzhard J, Mueller B, Beckmann F, Rittinger O, Hoefsloot LH, Schrott-Fischer A, Janecke AR. Histology and synchrotron radiation-based microtomography of the inner ear in a molecularly confirmed case of CHARGE syndrome. Am J Med Genet A. 2010;152A:665–673. doi: 10.1002/ajmg.a.33321. [DOI] [PubMed] [Google Scholar]
- Hama H, Kurokawa H, Kawano H, Ando R, Shimogori T, Noda H, Fukami K, Sakaue-Sawano A, Miyawaki A. Scale: a chemical approach for fluorescence imaging and reconstruction of transparent mouse brain. Nat Neurosci. 2011;30:1481–1488. doi: 10.1038/nn.2928. [DOI] [PubMed] [Google Scholar]
- Hulander M, Kiernan AE, Blomqvist SR, Carlsson P, Samuelsson EJ, Johansson BR, Steel KP, Enerback S. Lack of pendrin expression leads to deafness and expansion of the endolymphatic compartment in inner ears of Foxi1 null mutant mice. Development. 2003;130:2013–2025. doi: 10.1242/dev.00376. [DOI] [PubMed] [Google Scholar]
- Hurd EA, Adams ME, Layman WS, Swiderski DL, Beyer LA, Halsey KE, Benson JM, Gong TW, Dolan DF, Raphael Y, Martin DM. Mature middle and inner ears express Chd7 and exhibit distinctive pathologies in a mouse model of CHARGE syndrome. Hear Res. 2011;282:184–195. doi: 10.1016/j.heares.2011.08.005. [DOI] [PMC free article] [PubMed] [Google Scholar]
- Johnson SB, Schmitz HM, Santi PA. TSLIM imaging and a morphometric analysis of the mouse spiral ganglion. Hear Res. 2011;278:34–42. doi: 10.1016/j.heares.2011.02.008. [DOI] [PMC free article] [PubMed] [Google Scholar]
- Kiernan AE, Xu J, Gridley T. The Notch ligand JAG1 is required for sensory progenitor development in the mammalian inner ear. PLoS Genet. 2006;2:e4. doi: 10.1371/journal.pgen.0020004. [DOI] [PMC free article] [PubMed] [Google Scholar]
- Kim HM, Wangemann P. Failure of fluid absorption in the endolymphatic sac initiates cochlear enlargement that leads to deafness in mice lacking pendrin expression. PLoS One. 2010;5:e14041. doi: 10.1371/journal.pone.0014041. [DOI] [PMC free article] [PubMed] [Google Scholar]
- Kopecky B, Santi P, Johnson S, Schmitz H, Fritzsch B. Conditional deletion of N-Myc disrupts neurosensory and non-sensory development of the ear. Dev Dyn. 2011;240:1373–1390. doi: 10.1002/dvdy.22620. [DOI] [PMC free article] [PubMed] [Google Scholar]
- Luo ZX, Ruf I, Schultz JA, Martin T. Fossil evidence on evolution of inner ear cochlea in Jurassic mammals. Proc Biol Sci. 2011;278:28–34. doi: 10.1098/rspb.2010.1148. [DOI] [PMC free article] [PubMed] [Google Scholar]
- Ma Q, Anderson DJ, Fritzsch B. Neurogenin 1 null mutant ears develop fewer, morphologically normal hair cells in smaller sensory epithelia devoid of innervation. J Assoc Res Otolaryngol. 2000;1:129–143. doi: 10.1007/s101620010017. [DOI] [PMC free article] [PubMed] [Google Scholar]
- Martin P, Swanson GJ. Descriptive and experimental analysis of the epithelial remodellings that control semicircular canal formation in the developing mouse inner ear. Dev Biol. 1993;159:549–558. doi: 10.1006/dbio.1993.1263. [DOI] [PubMed] [Google Scholar]
- Morris JK, Maklad A, Hansen LA, Feng F, Sorensen C, Lee KF, Macklin WB, Fritzsch B. A disorganized innervation of the inner ear persists in the absence of ErbB2. Brain Res. 2006;1091:186–199. doi: 10.1016/j.brainres.2006.02.090. [DOI] [PMC free article] [PubMed] [Google Scholar]
- Morsli H, Choo D, Ryan A, Johnson R, Wu DK. Development of the mouse inner ear and origin of its sensory organs. J Neurosci. 1998;18:3327–3335. doi: 10.1523/JNEUROSCI.18-09-03327.1998. [DOI] [PMC free article] [PubMed] [Google Scholar]
- Nichols DH, Pauley S, Jahan I, Beisel KW, Millen KJ, Fritzsch B. Lmx1a is required for segregation of sensory epithelia and normal ear histogenesis and morphogenesis. Cell Tissue Res. 2008;334:339–358. doi: 10.1007/s00441-008-0709-2. [DOI] [PMC free article] [PubMed] [Google Scholar]
- Ohyama T, Groves AK. Expression of mouse Foxi class genes in early craniofacial development. Dev Dyn. 2004;231:640–646. doi: 10.1002/dvdy.20160. [DOI] [PubMed] [Google Scholar]
- Pan N, Jahan I, Kersigo J, Kopecky B, Santi P, Johnson S, Schmitz H, Fritzsch B. Conditional deletion of Atoh1 using Pax2-Cre results in viable mice without differentiated cochlear hair cells that have lost most of the organ of Corti. Hear Res. 2011;275:66–80. doi: 10.1016/j.heares.2010.12.002. [DOI] [PMC free article] [PubMed] [Google Scholar]
- Pauley S, Lai E, Fritzsch B. Foxg1 is required for morphogenesis and histogenesis of the mammalian inner ear. Dev Dyn. 2006;235:2470–2482. doi: 10.1002/dvdy.20839. [DOI] [PMC free article] [PubMed] [Google Scholar]
- Rubel EW, Fritzsch B. Auditory system development: primary auditory neurons and their targets. Annu Rev Neurosci. 2002;25:51–101. doi: 10.1146/annurev.neuro.25.112701.142849. [DOI] [PubMed] [Google Scholar]
- Rueda J, Cantos R, Lim DJ. Tectorial membrane-organ of Corti relationship during cochlear development. Anat Embryol (Berl) 1996;194:501–514. doi: 10.1007/BF00185996. [DOI] [PubMed] [Google Scholar]
- Santi PA. Light sheet fluorescence microscopy: a review. J Histochem Cytochem. 2011;59:129–138. doi: 10.1369/0022155410394857. [DOI] [PMC free article] [PubMed] [Google Scholar]
- Santi PA, Johnson SB, Hillenbrand M, GrandPre PZ, Glass TJ, Leger JR. Thin-sheet laser imaging microscopy for optical sectioning of thick tissues. Biotechniques. 2009;46:287–294. doi: 10.2144/000113087. [DOI] [PMC free article] [PubMed] [Google Scholar]
- Schacht P, Johnson SB, Santi PA. Implementation of a continuous scanning procedure and a line scan camera for thin-sheet laser imaging microscopy. Biomed Opt Express. 2010;1:598–609. doi: 10.1364/BOE.1.000598/. [DOI] [PMC free article] [PubMed] [Google Scholar]
- Schlosser G. Making senses development of vertebrate cranial placodes. Int Rev Cell Mol Biol. 2010;283:129–234. doi: 10.1016/S1937-6448(10)83004-7. [DOI] [PubMed] [Google Scholar]
- Schroter T, Johnson S, John K, Santi P. Scanning thin-sheet laser imaging microscopy (sTSLIM) with structured illumination and HiLo background rejection. J Biomed Opt. 2012;3:170–177. doi: 10.1364/BOE.3.000170. [DOI] [PMC free article] [PubMed] [Google Scholar]
- Seifert H, Roher U, Staszyk C, Angrisani N, Dziuba D, Meyer-Lindenberg A. Optimising μCT imaging of the middle and inner cat ear Anat Histol Embryol. 2011 doi: 10.1111/j.1439-0264.2011.01110.x. [Epub ahead of print] [DOI] [PubMed] [Google Scholar]
- Soukup GA, Fritzsch B, Pierce ML, Weston MD, Jahan I, McManus MT, Harfe BD. Residual microRNA expression dictates the extent of inner ear development in conditional Dicer knockout mice. Dev Biol. 2009;328:328–341. doi: 10.1016/j.ydbio.2009.01.037. [DOI] [PMC free article] [PubMed] [Google Scholar]
- Steinke H, Wolff W. A modified Spalteholz technique with preservation of the histology. Ann Anat. 2001;183:91–95. doi: 10.1016/S0940-9602(01)80020-0. [DOI] [PubMed] [Google Scholar]
- Streeter GL. On the development of the membranous labyrinth and the acoustic and facial nerves in the human embryo. Am J Anat. 1906;6:139–165. [Google Scholar]
- Streeter GL. The development of the scala tympani, scala vestibuli and perioticular cistern in the human embryo. Am J Anat. 1917;21:299–320. [Google Scholar]
- Sun S, Bauer C, Beichel R. Automated 3D Segmentation of lungs with lung cancer in CT data using a novel robust active shape model approach IEEE Trans Med Imaging. 2011 doi: 10.1109/TMI.2011.2171357. [Epub ahead of print] [DOI] [PMC free article] [PubMed] [Google Scholar]
- Takumida M, Harada Y. Development of the utricular macula in the mouse. Arch Otorhinolaryngol. 1984;241:9–15. doi: 10.1007/BF00457911. [DOI] [PubMed] [Google Scholar]
- Takumida M, Harada Y, Tagashira N. Development of the crista ampullaris in the mouse. J Laryngol Otol. 1986;100:759–763. doi: 10.1017/s0022215100100040. [DOI] [PubMed] [Google Scholar]
- Torres M, Giraldez F. The development of the vertebrate inner ear. Mech Dev. 1998;71:5–21. doi: 10.1016/s0925-4773(97)00155-x. [DOI] [PubMed] [Google Scholar]
- Voie AH, Burns DH, Spelman FA. Orthogonal-plane fluorescence optical sectioning: three-dimensional imaging of macroscopic biological specimens. J Microsc. 1993;170:229–236. doi: 10.1111/j.1365-2818.1993.tb03346.x. [DOI] [PubMed] [Google Scholar]
- Wilson JT. On the application of the Spalteholtz clearing method to the study of thick serial sections of embryos, with demonstration of specimens. J Anat. 1924;58:101–104. [PMC free article] [PubMed] [Google Scholar]
- Yang T, Kersigo J, Jahan I, Pan N, Fritzsch B. The molecular basis of making spiral ganglion neurons and connecting them to hair cells of the organ of Corti. Hear Res. 2011;278:21–33. doi: 10.1016/j.heares.2011.03.002. [DOI] [PMC free article] [PubMed] [Google Scholar]
- Yasuda M, Yamada S, Uwabe C, Shiota K, Yasuda Y. Three-dimensional analysis of inner ear development in human embryos. Anat Sci Int. 2007;82:156–163. doi: 10.1111/j.1447-073X.2007.00176.x. [DOI] [PubMed] [Google Scholar]
- Zou D, Erickson C, Kim EH, Jin D, Fritzsch B, Xu PX. Eya1 gene dosage critically affects the development of sensory epithelia in the mammalian inner ear. Hum Mol Genet. 2008;17:3340–3356. doi: 10.1093/hmg/ddn229. [DOI] [PMC free article] [PubMed] [Google Scholar]
Associated Data
This section collects any data citations, data availability statements, or supplementary materials included in this article.