

Abstract
Persistent HIV reservoirs and the absolute quantification of viral RNA copies in tissues have become a prominent focus of multiple areas of HIV/SIV research. Absolute quantification of viral RNA via reverse transcription, quantitative PCR (RT-qPCR) necessitates the use of an appropriate RNA reference gene whose expression is unaffected by both experimental and confounding conditions. In this study, we demonstrate the utility of ribosomal protein S13 mRNA (RPS13) as a stable, medium abundance reference gene for RT-qPCR normalization of HIV/SIV RNA copy number. We developed a RPS13 RNA standard assay utilizing an in vitro RNA transcript for normalization of absolute SIV RNA quantities in tissues reservoirs. The RT-qPCR assay showed a high degree of repeatability and reproducibility across RNA levels appropriate for absolute SIV quantification. In assessing the utility of RPS13 as a reference gene, limited variation in the absolute, inter-tissue quantities of RPS13 mRNA was observed within multiple tissue samples obtained from rhesus macaques (average CV = 2.86%). We demonstrate rhesus macaque RPS13 mRNA expression is not affected by alcohol administration, SIV infection, or antiviral therapy (PMPA/FTC). Additionally, assay functionality was validated for normalization of SIV copy number using cellular RNA prepared from samples of variable RNA integrity. RPS13 is a suitable reference gene for normalization of absolute SIV RNA quantities in tissues and is most appropriate for intra-tissue or similar tissue type comparisons of SIV copy number.
Keywords: viral load, Taq-Man, HIV, RNA normalization
1. Introduction
Replication of human immunodeficiency virus (HIV) has been shown to persist in tissues, despite antiretroviral therapy (ART), replenishing reservoirs and promoting chronic inflammation and non-AIDS related co-morbidities (Lorenzo-Redondo et al., 2016; North et al., 2010). Thus, characterizing viral expression in tissue reservoirs has become a key focus in multiple areas of HIV research, including the impact of compartmentalized viral replication on disease and the efficacy of novel therapeutic and curative approaches (Wong and Yukl, 2016). Studies with the Simian Immunodeficiency Virus (SIV)-infected, non-human primate model have proven useful for evaluating the expression and maintenance of virus in various tissue compartments that are not readily sampled in humans (Lorenzo-Redondo et al., 2016). Accordingly, the absolute quantification of SIV RNA via reverse transcription real-time PCR (RT-qPCR) is a valuable method for evaluating viral expression in reservoirs (Hansen et al., 2011; Hansen et al., 2013; North et al., 2010). While numerous assays have been described to absolutely quantify both HIV and SIV in plasma, assays tuned for the quantification of cell-associated viral RNA are less abundant.
Critical to the interpretation of SIV RNA quantities in tissues is normalization to an appropriately selected endogenous reference gene, as the precision and reliability of RT-qPCR analyses are dependent on the sample quality and RNA integrity (Jacob et al., 2013). Reference gene selection is study dependent; indeed, an increasing number of studies have demonstrated the expression of many common reference genes to be altered by experimental conditions, pathology, drugs, and other confounding variables (Guénin et al., 2009; Hendriks-Balk, Michel, and Alewijnse, 2007; Rocha-Martins, Njaine, and Silveira, 2012; Thellin et al., 1999). Therefore, reliable interpretation of viral RNA loads across studies requires expression of the selected reference gene to be unaffected by the conditions under test.
Alcohol consumption is a major confounder in clinical studies, as more than 50% of adults in the US self-report alcohol consumption in the past 4 weeks (Hasin et al., 2007). Moreover, within the HIV-infected population, the prevalence of heavy drinking is double that of the general population (Galvan et al., 2002). Alcohol consumption has been shown to alter normal physiology and in turn alters the expression of Glyceraldehyde-3-Phosphate Dehydrogenase GAPDH, one of the most common reference genes utilized in RT-qPCR (Boujedidi et al., 2012). The high prevalence of alcohol abuse in the HIV-infected population warrants the consideration of alternative reference genes that have been validated in the context of alcohol.
Ribosomal protein S13 (RPS13) is a component of the 40S ribosomal subunit, and thus participates in the essential process of eukaryotic protein synthesis (RefSeq Accession NC_000011, Gene ID 6207)(Malygin et al., 2007). RPS13 mRNA has been described as a medium abundance reference gene whose expression is tightly regulated via multiple redundant mechanisms (Jacob et al., 2013; Malygin et al., 2007; Zhang et al., 2015). Based on this property, several studies have validated and utilized RPS13 mRNA as a reference gene in relative gene expression studies, especially in oncology research (de Jonge et al., 2007; Dupasquier et al., 2014; Jacob et al., 2013; Rentoft et al., 2010; Zhang et al., 2015).
The SIV-macaque model is widely utilized as a translational animal model to investigate the biologic consequences of co-morbidities, co-infections, and substance abuse (Bagby et al., 2015; Gardner and Luciw, 1989; Hatziioannou and Evans, 2012). Specifically, our group has utilized the SIV macaque model extensively for studies investigating the pathogenic effects of alcohol abuse on HIV disease progression (Amedee et al., 2014; Loganantharaj et al., 2014; Molina et al., 2014; Veazey et al., 2015). The concomitant study of alcohol abuse and SIV poses additional problems for many of the PCR assays developed to study SIV alone; therefore, the aim of this study was to validate RPS13 as a reference transcript and establish a reproducible RT-qPCR assay for the absolute quantification of SIV RNA in tissue reservoirs.
2. Methods
2.1 Animals
All animal experimental protocols met the NIH guidelines for the use of experimental animals and were approved by the Institutional Animal Care and Use Committee at Louisiana State University Health Sciences Center. Tissue samples utilized in this study were obtained from a previously described cohort of male rhesus macaques (Macaca mulatta) evaluated in pathogenesis studies (Molina et al., 2014; Veazey et al., 2015). For these studies, samples from 27 animals were available. As described, half of the animals received daily infusions of ethanol (ALC) (~13 to 14 g ethanol/Kg body weight/wk; 30% w/v water) to achieve a peak blood alcohol concentration of 50–60mM at 90 minutes post-infusion via a permanent indwelling gastric catheter for the study duration. Controls received matched volumes of a 30% sucrose and water solution (SUC) for the study duration via gastric catheter. After 3 months of daily ALC/SUC administration, macaques were intra-rectally inoculated with SIVmac251. Approximately, 10 weeks post SIV-infection, animals were further randomized to ART+ and ART− treatment groups yielding four study groups [SUC/ART+ (n=7); SUC/ART− (n=6); ALC/ART+ (n=7); ALC/ART− (n=7)] for the remainder of the 12-month study. ART+ animals received daily subcutaneous injections of 2 nucleoside reverse transcriptase inhibitors [20mg/kg tenofovir (PMPA, 9-R-2-phosphonomenthoxypropyl adenine) and 30 mg/kg emtricitabine (FTC, beta-2, 3-dideoxy-3-thia-5-fleirocytidine)], while animals in the ART− groups received equal volumes of vehicle.
2.2 Specimen Collection and Nucleic Acid Preparation
Blood samples collected in EDTA anti-coagulant at four time points over the study period were utilized from the cohort of 27 macaques, which included sampling prior to alcohol delivery (naïve animals), post-alcohol delivery, post SIV-infection, and post-ART treatment. Peripheral blood mononuclear cells (PBMC) were isolated using Ficoll-Paque PLUS (GE Healthcare), counted and stored at −80°C in RNALater® Solution (Ambion). Mesenteric lymph node, bronchial lymph nodes, prefrontal cortex (PFC), and liver tissue samples were collected at necropsy, placed in RNALater® Solution (mesenteric lymph node), OCT (bronchial lymph node and liver), or flash frozen (PFC) for long-term storage at −80°C. A maximum of 1 × 10⁷ PBMCs or 30mg of tissue were thawed and utilized for RNA preparation for this study. RNA was purified from cell lysates and tissue homogenates using the Qiagen RNeasy Plus Mini Kit in accordance with the manufactures recommended protocol and eluted in 50μL of RNase-free water. RNA concentration was determined with the Thermo Scientific™ NanoDrop 2000 prior to storage at −80°C for real time PCR.
2.3 Absolute RPS13 RNA Copy Number Standard
RPS13 was selected for normalization of SIV RNA copy number for its consistent/stable expression and its mid-level expression profile (de Jonge et al., 2007; Jacob et al., 2013; Zhang et al., 2015). To generate a quantitative RPS13 RNA standard, a 466bp region within the rhesus macaque RPS13 gene was amplified with Q5® High-Fidelity DNA Polymerase (New England Biolabs) using 5′-ATCGCCGCCATCATGGGTCG-3′ and 5′-ATGCGACCAGGGCAGAGGCT-3′ primers. The resultant amplicon was cloned into the PCR-Blunt II-TOPO vector using the Zero Blunt TOPO PCR Cloning Kit (Invitrogen) and the resultant plasmid, pRPS13-rh73, was amplified in bacteria, purified using ZymoPURE™ Plasmid Maxiprep Kit (Zymo Research), and linearized through restriction digestion with SspI-HP (New England Biolabs). RPS13-rh RNA was prepared for use as an absolute quantification standard by reverse transcribing a 1,296 bp transcript from the linearized pRPS13-rh73 using Ribomax In Vitro Transcript System-T7 (Promega). Following reverse transcription, residual plasmid template and unincorporated rNTPs were removed by DNase digestion and column based chromatography, respectively (Nucaway, Ambion); complete removal of plasmid template was confirmed by qPCR in the absence of a reverse-transcription step. For use as an absolute RT-qPCR quantitative standard, purity and quantity of resultant RPS13-rh RNA transcript was validated and assessed by both NanoDrop 2000 spectrophotometer (Thermo Scientific) and an Agilent Bioanalyzer 2100 system (Agilent Technologies), and the absolute copy number of transcripts was calculated using the precise molecular weight of predicted transcript (1.44 × 10⁹ copies per ng). To optimize longevity and limit inter-assay variability, RPS13-rh was diluted to 1 × 10¹² copies/μl aliquots and stored at −80°C for single assay use. For each assay, the RPS13-rh RNA standard curve was prepared from a frozen aliquot of the RPS13-rh via log10 serial dilutions yielding 107 to 104 copies of template per well. RPS13 RNA standards were assayed in a two-step RT-qPCR assay, as described below, with ≥2 replicate measures for each RPS13 RNA standard curve dilution.
2.4 Absolute SIV RNA Copy Number Standard
The SIV RNA standard was prepared from a DNA plasmid, pSIVgag-SR which contains a 1490 bp region of the SIVmac251 gag gene (SIVmac239 numbering, 1,334 – 2,835) cloned into the PCR-Blunt II-TOPO vector. Using pSIVgag-SR as a template and T7 and M13 sequencing primers, a 1631 bp fragment encompassing the SIV gag sequence was amplified via PCR with Q5® High-Fidelity DNA polymerase. The resulting PCR products were used for in vitro production of a RNA transcript with using the Ribomax In Vitro Transcript System-T7, (Promega). Removal of remaining DNA template and nucleotides from the resultant SIVgag RNA transcript was conducted as described above; complete DNA template removal was confirmed by qPCR. Absolute SIV transcript number was determined using the precise molecular weight of SIVgag RNA (1.14 × 10⁹ copies per ng), and single use aliquots were diluted to 1 × 10¹¹ copies/μl and stored at −80°C. For each assay, a SIVgag RNA standard curve was prepared from a fresh aliquot of SIVgag RNA via log10 serial dilutions yielding dilutions of absolute SIVgag RNA copies ranging from 106 to 101 copies per well. SIVgag RNA standards were assayed in a two-step RT-qPCR assay, as described below, with two replicate measures of each dilution.
2.5 RT-qPCR Assay for Absolute Quantification of Cell-associated SIV RNA
SIV and RPS13 RNA quantities were determined in separate two-step RT-qPCR assays. RNA was purified from samples, quantified by UV spectroscopy, and diluted or concentrated via ethanol precipitation to 25 ng/μl for use in both RPS13 and SIV RT-qPCR assays. Both RPS13 and SIV RNA quantities were assessed in duplicate 10 μl reverse transcription reactions by adding 1μl of RNA (25 ng) or RPS13 RNA standard dilution into RPS13 RT assays and 3 μl of RNA (75 ng) or SIV RNA standard dilution into SIV RT assays. Samples were reverse transcribed using TaqMan® Reverse Transcription Reagent which contained Multiscribe™ reverse transcriptase and random hexamer primers (Invitrogen). The 10 μl reaction mixture contained 1 or 3 μl of sample RNA and 4.35 and 2.35 μl of DEPC-treated water for RPS13 and SIV reactions respectively. Additionally, both reactions consisted of 0.7 μl of 25 mM MgCl2, 0.5 μl 50μM random hexamers, 0.25 μl of 50 U/μl Multiscribe™, 1 μl 10× RT Buffer, 2μl 10mM dNTP mix, and 0.2 μl of 20 U/μl RNase Inhibitor. Reverse transcription reactions were performed on the BioRad T1000 thermocycler using the following conditions: 10 minutes at 25°C followed by 30 minutes at 42°C and then 5 minutes at 95°C as recommended by the manufacturer. Following reverse transcription, each RT reaction was fully utilized in a single overlay qPCR reaction using the BioRad iQ Supermix reagent and the BioRad CFX96 real time PCR thermocycler. SIV and RPS13 targets were amplified in a 25 μl reaction consisting of 10 μl of the reverse transcription reaction, 10 μl of iQ Supermix, 500nM RPS13 or SIV specific forward and reverse primers, 250nM RPS13 or SIV specific hydrolysis probe. Assay conditions for RPS13 were as follows: 95°C for 3 minutes, followed by 40 amplification cycles consisting of 95°C for 15 seconds and 55.8°C for 60 seconds; while, SIV assay conditions were 95°C for 3 minutes, followed by 40 amplification cycles consisting of 95°C for 15 seconds and 58.3°C for 60 seconds. RPS13 and SIV RNA standard curves were constructed by plotting the logarithm of the RNA standard concentration against their corresponding quantification cycle (Cq) values, calculated as the cycle number at which fluorescence has increased above background. Absolute RPS13 and SIV RNA copy numbers in unknown RNA samples were derived from respective linear regression line equations using the average Cq value obtained from duplicate, 2 step RT-qPCR reactions. SIV quantities were then normalized to RPS13 copy number determined empirically by tissue specific RPS13 mRNA copies observed in a μg of RNA.
2.6 Freeze Thaw Experiment
For assessments of RNA following freeze-thaw, virus spike-in experiments were conducted with purified cellular RNA and SIV virion RNA purified from a viral stock aliquot. Test samples containing 500 or 50,000 SIV RNA copies/75ng cellular RNA were prepared and subjected to repeated freeze-thaws by cycling samples on dry ice for 5 minutes and then thawing the samples at room temperature for 10 minutes. RPS13 mRNA and SIV RNA copy numbers were measured in each sample subjected to 0, 3, and 10 freeze thaw cycles in 3–4 independent, two-step RT-qPCR reactions for each freeze thaw condition as described above. SIV RNA quantities were normalized to both μg of input RNA and μg of amplifiable RNA determined by RPS13 as described above and compared.
2.7 Data Analysis
All data presented graphically are represented as mean ± standard deviation. RPS13 assay efficiency, standard curve slope, repeatability (intra-assay variation), and reproducibility (inter-assay variation) were calculated by comparisons of the Cq values for each RPS13 RNA standard dilution. RPS13 RNA standard assay repeatability and reproducibility are expressed as mean [95% CI]; while, RPS13 mRNA expression variability is shown as coefficient of variation in accordance with MIQE guidelines (Bustin et al., 2009). Data comparisons of two groups were analyzed by independent-sample t-test or Mann-Whitney U-test if unequal error variances were identified. Multiple comparisons of data were analyzed by one-way analysis of variance (ANOVA), Sidak-Bonferroni corrected multiple t-tests analysis. Significant effects detected by ANOVA were followed up with pairwise comparisons using Tukey’s HSD post-hoc analysis. Significance level was always set at p < 0.05.
3. Results
3.1 Development of a Reproducible RPS13 Standard for Absolute RT-PCR Quantification
As qPCR requires precise and accurate normalization to the quantity of amplifiable RNA, we developed an in vitro RNA standard, RPS13-rh, encompassing a region of the RPS13 gene targeted in a validated Taqman PCR assay (NCBI Probe Database Accession Number: Pr009255687). Ten-fold serial dilutions of the RPS13-rh RNA standard were amplified in a RT-qPCR assay to generate a quantitative standard curve ranging from 107 to 104 RNA copies. To evaluate RPS13-rh RNA standard repeatability (intra-assay consistency) and amplification efficiency, replicates of each standard curve dilution were each amplified in five independent 2-step RT-qPCR reactions (Fig. 1A). Comparisons of the quantification cycle (Cq) values obtained for each RPS13 RNA standard dilution showed limited variation, with mean values [95% CI] of 19.13 [18.86–19.40], 22.34 [22.07–22.61], 26.02 [25.71–26.34], and 29.59 [29.41–29.78] observed at 107 – 104 RNA copies of RPS13 standard respectively. To evaluate the amplification efficiency and reproducibility of the RPS13 RNA standard, inter-assay variability was assessed using average Cq values obtained from 6 independent standard curves of 107 – 104 RNA copies amplified in duplicate, two-step RT-qPCR reactions (Fig. 1B). Consistent amplification efficiency was observed with an average amplification efficiency of 93.0%, an average slope of −3.51 ± .14 and an average R2 > 0.997. Additionally, limited inter-assay variation was observed with mean values [95% CI] of 19.03 [18.99–19.07], 22.22 [22.05–22.39], 25.70 [25.30–26.09], 29.56 [29.20–29.91] observed at dilutions of 107 – 104 RNA copies of RPS13 standard RNA respectively. Together, these data show the high degree of repeatability and reproducibility of the RPS13 RNA standard generated for the quantification of RPS13 mRNA levels over an assay relevant range of 107 to 104 RPS13 RNA copies per 25ng RNA reaction.
Figure 1.

Validation of RPS13 RNA standard consistency and reproducibility. (A) Intra-assay variation Cq values were obtained by RT-qPCR of RPS13 RNA standard dilutions ranging from 107 – 104. Cq values were evaluated from 5 independent RT-qPCR replicates of serially dilutions of RPS13 RNA standard; mean values for each dilution are represented by lines. (B) Inter-assay variation of 6 independent RPS13 standard curve assays. Cq values for each independent assay were derived from duplicate RT-qPCR measures of each standard curve dilution. Symbol shapes depict average Cq for each assay; mean values for each dilution are represented by lines.
3.2 RPS13 mRNA is Stably Expressed in Rhesus Macaques
While several large-scale, clinical studies have shown little variability in RPS13 mRNA expression levels between subjects, variability in the absolute quantities of RPS13 mRNA expressed in rhesus macaques has not been explored. To evaluate RPS13 mRNA expression in macaques, absolute quantity of RPS13 mRNA was measured by RT-qPCR in 39 PBMC RNA samples derived from 27 naïve male macaques. To directly assess consistency of RPS13 among different animal samples, RPS13 quantities were normalized to ng of RNA input. Overall, normalized RPS13 mRNA levels in samples were consistent, with a mean log of 4.99 ± 0.15 RPS13 copies per ng RNA and an inter-sample coefficient of variation of 2.95%, demonstrating the potential utility of RPS13 as a RT-qPCR standard reference gene (Fig. 2). Normalization of RPS13 to input quantity of RNA adds additional variability by not accounting for differences in sample RNA integrity, reverse transcription efficiency, and amplification efficiency. To further investigate intra-sample RPS13 level variation, samples were stratified based on date of RNA preparation. Specifically, RNA from 23 of the 39 samples, denoted by downward, open triangle symbols, were prepared and stored for more than a year prior to RT-qPCR analysis, while RNA from the remaining 16 samples, denoted by upward, solid triangle symbols were prepared and analyzed concurrently (Fig. 2). As anticipated, the intra-sample variability of each group was markedly lower than the overall coefficient of variation with coefficients of variation of 2.36% and 1.43% observed in freshly prepared and stored RNA sample respectively. Additionally, significantly lower levels (~41% reduction) of RPS13 mRNA were observed in PBMC RNA samples prepared more than a year prior to analysis (mean log 4.90 ± .07 RPS13 copies per ng RNA) relative to those freshly prepared (mean log 5.13 ± .12 RPS13 copies per ng RNA) (U = 17, p<0.001), demonstrating that RPS13 levels are sensitive to degradation. Taken together, these findings further lend to the validity and utility of using RPS13 as a RT-qPCR reference gene to control for sample amplification efficiency.
Figure 2.
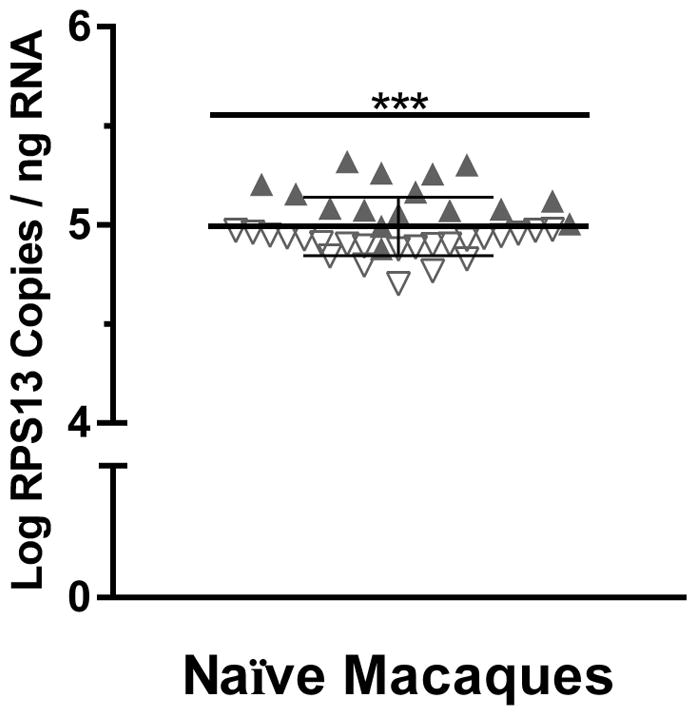
RPS13 copies in PBMC samples from naïve macaques. RNA was prepared from 39 PBMC samples obtained from 27 SIV-negative male macaques (not given alcohol). Levels of RPS13 were quantified by RT-qPCR and expressed as log-transformed RPS13 mRNA copies per ng of input RNA. Solid triangles represent freshly prepared samples, and open triangles represent RNA samples prepared > 1 year prior to RT-qPCR analysis. ***p<0.001
3.3 RPS13 mRNA Expression is not Affected by Alcohol Consumption, SIV-infection, or Administration of ART
While the need for normalization in absolute quantitative RT-qPCR has been well established, reference gene selection is highly study dependent, as exogenous variables such as alcohol consumption have been shown to alter the expression of the classically used reference gene, GAPDH (Boujedidi et al., 2012). To validate the use of RPS13 as a reference gene, the impact of the exogenous variables of alcohol consumption, SIV infection, and use of ART on RPS13 expression was determined. RPS13 mRNA levels were measured in PBMC samples from rhesus macaques administered alcohol (ALC) or sucrose (SUC) as controls prior to and after SIV infection. Measures were also made in samples collected from a subset of animals in each group that received ART for 42 weeks post-SIV infection. Control SIV-naïve animals (n=13) showed a mean log RPS13 value of 5.08 ± 0.10 copies per ng of RNA, while animals receiving alcohol (n=13) exhibited a mean log RPS13 level of 5.13 ± 0.16 copies per ng RNA, clearly indicating that alcohol consumption did not influence RPS13 expression (Bonferroni-Adjusted p = 0.33) (Fig. 3A). Likewise, SIV-infected control animals (n=12) and animals receiving alcohol (n=14) showed similar levels of RPS13 mRNA, 5.16 ± 0.12 and 5.16 ± 0.20 copies per ng of RNA respectively (Bonferroni-Adjusted p = 0.96) (Fig. 3B). Treatment with two nucleoside reverse transcriptase inhibitors (PMPA and FTC) for 42 weeks also did not significantly affect RPS13 expression with mean log levels of 5.24 ± 0.18 and 5.09 ± 0.23 (ALC, n=6) in control (n=6) and alcohol (n=6) animals (Bonferroni-Adjusted p = 0.24) (Fig. 3C). Overall, no significant differences in RPS13 mRNA levels were observed between control and alcohol animals. Additionally, neither SIV-infection (Bonferroni-Adjusted p = 0.16) nor ART (Bonferroni-Adjusted p = 0.94) significantly impacted RPS13 mRNA expression, indicating that RPS13 expression is not altered by alcohol administration, SIV-infection, nor treatment with the antiretroviral drugs PMPA and FTC.
Figure 3.

RPS13 mRNA expression is not affected by alcohol consumption, SIV-infection or ART administration. (A) PBMC RPS13 mRNA levels in SIV naïve animals receiving chronic alcohol (open circle; n=13) or sucrose as control (solid square; n=13). (B) PBMC RPS13 mRNA levels in SIV-infected animals receiving alcohol (open circle; n=14) or sucrose (solid square; n=12). (C) PBMC RPS13 mRNA levels in SIV-infected animals receiving ART (combination PMPA and FTC therapy) and either alcohol (open circle; n=6) or sucrose (solid square; n=6).
3.4 RPS13 mRNA Expression Varies Across Tissues
All RNA reference genes display some degree of intra- and inter-tissue variation. While intra-tissue expression of ribosomal proteins, such as RPS13, have been shown to be extremely stable across individuals, previous studies have reported marked variability in inter-tissue RPS13 mRNA expression. To define this limitation of RPS13, we sought to establish baseline RPS13 expression values in several tissue types central to alcohol and SIV research fields. RPS13 mRNA levels were quantified in rhesus macaque liver, prefrontal cortex (PFC), mesenteric lymph node, and bronchial lymph node tissue samples (Fig. 4). As previously observed, similar levels of RPS13 mRNA expression were detected in each tissue across treatment groups (Bonferroni-Adjusted p > 0.05). On the other hand, significant differences in RPS13 mRNA expression were observed across tissue type, with lower RPS13 expression observed in less proliferative tissues such as liver (mean log 3.97 ± 0.11 RPS13 copies per ng of input RNA) and PFC (mean log 4.21 ± 0.10 RPS13 copies per ng input RNA) compared to the highly proliferative bronchial and mesenteric lymph nodes (mean log 4.94 ± 0.16 & 4.81 ± 0.22 RPS13 copies per ng input RNA respectively) (Bonferroni-Adjusted p < 0.001). Furthermore, variation in RPS13 mRNA expression is also related to the proliferative capacity of a specific tissue, as lower intra-tissue RPS13 mRNA variability was observed in less proliferative tissues (liver = 2.84%; PFC = 2.31%) when compared to tissues with greater proliferation (bronchial lymph node = 3.69% and mesenteric lymph node = 4.51%). Within similar tissues types, mesenteric and bronchial lymph nodes, comparable levels of RPS13 mRNA expression were observed. Overall, these results demonstrate that RPS13 expression varies across tissue type, rendering the use of RPS13 most appropriate for intra-tissue or similar tissue-type comparisons.
Figure 4.
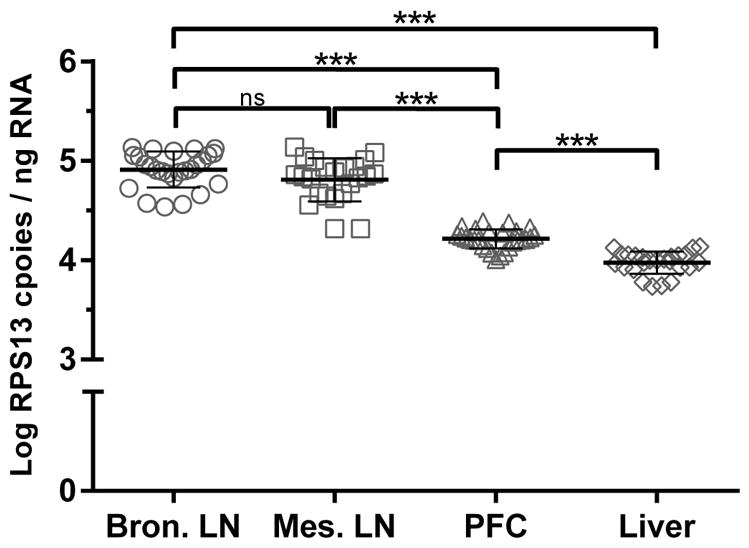
Intra-tissue variation of RPS13 mRNA expression. Rhesus macaque RPS13 mRNA expression levels in four distinct tissues: bronchial lymph node (n=26), mesenteric lymph node (n=23), prefrontal cortex (n=27), and liver (n=25). All tissues were harvest 52 weeks post-SIV inoculation. Symbols depict individual animal RPS13 mRNA levels, and lines represent mean ± standard deviation. ***p<0.001, ns = not significant
3.5 RPS13 mRNA Accurately Normalizes SIV to Amplifiable RNA
Previous studies have classified RPS13 as a mid-level expression, relative reference RNA, however the utility of RPS13 normalization for absolute SIV quantification has not been demonstrated. To assess whether RPS13 mRNA could be utilized to functionally normalize both high and low SIV RNA levels, we performed a freeze thaw experiment with known copy numbers of virion RNA in the background of cellular RNA. RPS13 mRNA levels were first quantified and normalized to ng of input RNA in samples subjected to 0, 3, and 10 freeze thaws over the course of several hours (Fig. 5A). Significant reduction in RPS13 levels were observed by a one-way ANOVA for number of freeze thaws, F(2, 27) =19.77, p < 0.001. Post-hoc analysis revealed significant reductions in RPS13 levels with increased numbers of freeze thaws, indicating that a reduction of RPS13 mRNA levels is seen with RNA degradation. To assess whether RPS13 and SIV RNA shared similar degradation kinetics and could be used to functionally normalize SIV levels in tissue samples, low (approximately 500 copies) and high (approximately 50,000) virion RNA copies were spiked into the background of 75ng of cellular RNA and subjected to 3 and 10 freeze thaws respectively (Fig. 5B,C). In each case, SIV levels were quantified and normalized to both input ng of RNA (solid symbols) and RPS13 levels (open symbols). Both low (p < 0.01) and high (p < 0.05) absolute SIV RNA copy numbers, normalized to input ng of RNA, showed significant reduction when subjected to multiple freeze thaws. Alternatively, irrespective of SIV copy number and number of freeze thaws, normalization of SIV to RPS13 levels mitigated the significant reductions in SIV levels attributable to degradation.
Figure 5.

Validation of endogenous RPS13 mRNA reference gene functionality. (A) RPS13 mRNA levels in a cellular RNA sample subjected to the indicated number of freeze thaws. (B & C) SIV RNA quantities measured following freeze thaw of low and high copy number SIV virions spiked into the background of 75 ng of cellular RNA. Symbol shading depicts method of SIV copy number normalization, with shaded symbols normalized to μg of input RNA and open symbols normalized to μg of amplifiable RNA determined by RPS13 copy number (5.75 × 10⁷ RPS13 copies per μg of amplifiable RNA). ** p<0.01, *p<0.05, ns = not significant
4. Discussion
In this study, we validated RPS13 as a stable reference gene for the absolute quantification of SIV RNA in tissue reservoirs of rhesus macaques. To this extent, we demonstrated our RPS13 standard and RPS13 RT-qPCR assay showed excellent intra- and inter-assay reproducibility, rendering it appropriate for RNA normalization in non-human primate studies that typically utilize stored tissues collected over several months. Additionally, we demonstrated that normalization of SIV RNA quantity to RPS13 mRNA levels accurately controls for sample loss by RNA degradation and mitigates other artifactual differences secondary to poor sample quality and RNA integrity. Critical to our studies, we demonstrated RPS13 mRNA expression is not affected by alcohol administration, SIV-infection, or the antiretroviral therapy agents PMPA and FTC. These results combined with previous reports on the stability of RPS13 expression demonstrate the suitability of this gene for normalization and comparison of absolute SIV RNA quantities within a tissue or among similar tissue types.
The variability of RPS13 mRNA expression across tissues has been noted and could significantly bias intra-tissue comparisons made with data normalized to RPS13 (Thorrez et al., 2008). Intra-tissue expression variability is not unique to RPS13 as many commonly used reference genes also show considerable intra-tissue expression variability, typically exhibiting a trade-off between intra- and inter-tissue variability much like the relationship between sensitivity and specificity. (Glare et al., 2002; Lee et al., 2002; Suzuki, Higgins, and Crawford, 2000; Thellin et al., 1999). Accordingly, our results corroborate this inter-tissue variability, as RPS13 mRNA expression significantly varied across tissues types with liver and PFC tissue samples exhibiting significantly less RPS13 expression relative to bronchial and mesenteric lymph node samples.
Such variation does not strictly permit the use of RPS13 mRNA to normalize absolute quantities of SIV RNA across diverse tissue types, however consistent intra-tissue RPS13 mRNA expression permits the further normalization of RPS13 copies to tissue RNA quantities, for any particular tissue-type. Further, the invariability of RPS13 mRNA levels within a tissue-type indicates that inter-tissue comparisons of SIV can be facilitated by establishing a tissue-specific RPS13 copy number in 1 ng of RNA, thereby permitting normalization of SIV quantities to μg of amplifiable RNA, as shown in figures 4 and 5. In practice, the SIV:RPS13 copy ratio would be multiplied by the average number of RPS13 amplified from 1 μg of tissue.
Using RPS13 as a reference gene, we have developed a streamlined protocol to efficiently measure SIV levels in tissue reservoirs (Fig. 6). Following isolation from tissue, purified RNA is diluted or concentrated to 25 ng/μl. RPS13 levels are quantified using 1 μl (25 ng) of sample RNA, while 3 μl (75ng) are used for SIV quantification. These RNA quantities permit accurate RPS13 measures while maximizing quantitative SIV sensitivity. As detailed in the methods section, our absolute SIV RT-qPCR quantitation assay is performed using a two-step complete overlay procedure where the entire 10μl reverse transcription reaction is utilized in a 25 μl total volume qPCR reaction. This method minimizes the amount of RNA required for duplicate reverse transcription reactions that are then overlain for qPCR. Using the entire RT reaction increases qPCR sensitivity and minimizes variation due to inconsistent pipetting techniques or user error. The direct overlay of the qPCR reagents is more amenable to high-throughput applications. Additionally, our RPS13 standard and RPS13 qPCR assay can easily be adapted for absolute HIV quantification in clinical tissue samples as rhesus macaque RPS13 mRNA (GenBank accession no. NM_001265917) demonstrates a 98% nucleic acid identity with human RPS13 mRNA (GenBank accession no. NM_001017) when aligned with BLASTN.
Figure 6.

Workflow schematic for absolute SIV RT-qPCR quantification in tissues.
5. Conclusion
RPS13 is an appropriate reference gene to use for absolute SIV quantification in tissues by RT-qPCR. Utilizing RPS13 for normalization is most appropriate for intra-tissue or similar tissue type comparisons of SIV quantities.
Table 1.
Primer and Probe Sequences
| RPS13F* | 5′-CAGTCGGCTTTACCCTATCG-3′ |
| RPS13R* | 5-TCTGCTCCTTCACGTCGTC-3′ |
| RPS13Probe* | 5′-6FAM-CAACTTCAACCAAGTGGGGACGCT-TAMRA-3′ |
| SIVgagF | 5′-AGCCTTTATAATACTGTCTGCGTCA-3′ |
| SIVgagR | 5′-TGCACTATCTGTTTTGCTTCCTCA-3′ |
| SIVgagProbe | 5′-6FAM-TGGTGCATTCACGCAGAAGAGAAAGTGA-3BHQ_1–3′ |
RPS13 primer and probes were previous validated in humans for relative gene expression application using TaqMan RT-qPCR Pr009255687
Highlights.
Endogenous RPS13 mRNA is a stable reference gene for RT-qPCR.
RPS13 mRNA expression exhibits limited intra-subject and inter-tissue variation.
RPS13 mRNA expression is unchanged by chronic alcohol, SIV infection, or ART.
We describe a streamlined RPS13/SIV assay for absolute tissue SIV RNA quantification.
Acknowledgments
We thank directors of the Comprehensive Alcohol Research Center at LSUHSC (New Orleans, LA), Dr. Steve Nelson and Dr. Patricia Molina for providing samples for this study. We also thank Jane A. Schexnayder, Amy B. Weinberg, Rhonda R. Martinez, Dr. Paige S. Katz, and John K. Maxi for technical assistance, and Dr. Robert W. Siggins for critical manuscript review. From the LSUHSC Microbiology, Immunology and Parasitology Department (New Orleans, LA) we thank Dr. Ashok Aiyar for analytical and technical assistance and critical manuscript review. This work was supported by the National Institute of Health and the National Institute on Alcohol Abuse and Alcoholism, P60 AA09803 and T32 AA007577–15. The authors have no conflict of interests to declare.
Footnotes
Publisher's Disclaimer: This is a PDF file of an unedited manuscript that has been accepted for publication. As a service to our customers we are providing this early version of the manuscript. The manuscript will undergo copyediting, typesetting, and review of the resulting proof before it is published in its final citable form. Please note that during the production process errors may be discovered which could affect the content, and all legal disclaimers that apply to the journal pertain.
References
- Amedee AM, Nichols WA, Robichaux S, Bagby GJ, Nelson S. Chronic alcohol abuse and HIV disease progression: studies with the non-human primate model. Curr HIV Res. 2014;12:243–53. doi: 10.2174/1570162x12666140721115717. [DOI] [PMC free article] [PubMed] [Google Scholar]
- Bagby GJ, Amedee AM, Siggins RW, Molina PE, Nelson S, Veazey RS. Alcohol and HIV Effects on the Immune System. Alcohol Res. 2015;37:287–97. doi: 10.35946/arcr.v37.2.12. [DOI] [PMC free article] [PubMed] [Google Scholar]
- Boujedidi H, Bouchet-Delbos L, Cassard-Doulcier AM, Njiké-Nakseu M, Maitre S, Prévot S, Dagher I, Agostini H, Voican CS, Emilie D, Perlemuter G, Naveau S. Housekeeping gene variability in the liver of alcoholic patients. Alcohol Clin Exp Res. 2012;36:258–66. doi: 10.1111/j.1530-0277.2011.01627.x. [DOI] [PubMed] [Google Scholar]
- Bustin SA, Benes V, Garson JA, Hellemans J, Huggett J, Kubista M, Mueller R, Nolan T, Pfaffl MW, Shipley GL, Vandesompele J, Wittwer CT. The MIQE guidelines: minimum information for publication of quantitative real-time PCR experiments. Clin Chem. 2009;55:611–22. doi: 10.1373/clinchem.2008.112797. [DOI] [PubMed] [Google Scholar]
- de Jonge HJ, Fehrmann RS, de Bont ES, Hofstra RM, Gerbens F, Kamps WA, de Vries EG, van der Zee AG, te Meerman GJ, ter Elst A. Evidence based selection of housekeeping genes. PloS one. 2007;2:e898. doi: 10.1371/journal.pone.0000898. [DOI] [PMC free article] [PubMed] [Google Scholar]
- Dupasquier S, Delmarcelle AS, Marbaix E, Cosyns JP, Courtoy PJ, Pierreux CE. Validation of housekeeping gene and impact on normalized gene expression in clear cell renal cell carcinoma: critical reassessment of YBX3/ZONAB/CSDA expression. BMC Mol Biol. 2014;15:9. doi: 10.1186/1471-2199-15-9. [DOI] [PMC free article] [PubMed] [Google Scholar]
- Galvan FH, Bing EG, Fleishman JA, London AS, Caetano R, Burnam MA, Longshore D, Morton SC, Orlando M, Shapiro M. The prevalence of alcohol consumption and heavy drinking among people with HIV in the United States: results from the HIV Cost and Services Utilization Study. Journal of studies on alcohol. 2002;63:179–86. doi: 10.15288/jsa.2002.63.179. [DOI] [PubMed] [Google Scholar]
- Gardner MB, Luciw PA. Animal models of AIDS. FASEB J. 1989;3:2593–606. doi: 10.1096/fasebj.3.14.2556312. [DOI] [PubMed] [Google Scholar]
- Glare EM, Divjak M, Bailey MJ, Walters EH. beta-Actin and GAPDH housekeeping gene expression in asthmatic airways is variable and not suitable for normalising mRNA levels. Thorax. 2002;57:765–70. doi: 10.1136/thorax.57.9.765. [DOI] [PMC free article] [PubMed] [Google Scholar]
- Guénin S, Mauriat M, Pelloux J, Van Wuytswinkel O, Bellini C, Gutierrez L. Normalization of qRT-PCR data: the necessity of adopting a systematic, experimental conditions-specific, validation of references. J Exp Bot. 2009;60:487–93. doi: 10.1093/jxb/ern305. [DOI] [PubMed] [Google Scholar]
- Hansen SG, Ford JC, Lewis MS, Ventura AB, Hughes CM, Coyne-Johnson L, Whizin N, Oswald K, Shoemaker R, Swanson T, Legasse AW, Chiuchiolo MJ, Parks CL, Axthelm MK, Nelson JA, Jarvis MA, Piatak M, Jr, Lifson JD, Picker LJ. Profound early control of highly pathogenic SIV by an effector memory T-cell vaccine. Nature. 2011;473:523–7. doi: 10.1038/nature10003. [DOI] [PMC free article] [PubMed] [Google Scholar]
- Hansen SG, Piatak M, Jr, Ventura AB, Hughes CM, Gilbride RM, Ford JC, Oswald K, Shoemaker R, Li Y, Lewis MS, Gilliam AN, Xu G, Whizin N, Burwitz BJ, Planer SL, Turner JM, Legasse AW, Axthelm MK, Nelson JA, Fruh K, Sacha JB, Estes JD, Keele BF, Edlefsen PT, Lifson JD, Picker LJ. Immune clearance of highly pathogenic SIV infection. Nature. 2013;502:100–4. doi: 10.1038/nature12519. [DOI] [PMC free article] [PubMed] [Google Scholar]
- Hasin DS, Stinson FS, Ogburn E, Grant BF. Prevalence, correlates, disability, and comorbidity of DSM-IV alcohol abuse and dependence in the United States: results from the National Epidemiologic Survey on Alcohol and Related Conditions. Archives of general psychiatry. 2007;64:830–42. doi: 10.1001/archpsyc.64.7.830. [DOI] [PubMed] [Google Scholar]
- Hatziioannou T, Evans DT. Animal models for HIV/AIDS research. Nat Rev Microbiol. 2012;10:852–67. doi: 10.1038/nrmicro2911. [DOI] [PMC free article] [PubMed] [Google Scholar]
- Hendriks-Balk MC, Michel MC, Alewijnse AE. Pitfalls in the normalization of real-time polymerase chain reaction data. Basic Res Cardiol. 2007;102:195–7. doi: 10.1007/s00395-007-0649-0. [DOI] [PMC free article] [PubMed] [Google Scholar]
- Jacob F, Guertler R, Naim S, Nixdorf S, Fedier A, Hacker NF, Heinzelmann-Schwarz V. Careful selection of reference genes is required for reliable performance of RT-qPCR in human normal and cancer cell lines. PloS one. 2013;8:e59180. doi: 10.1371/journal.pone.0059180. [DOI] [PMC free article] [PubMed] [Google Scholar]
- Lee PD, Sladek R, Greenwood CM, Hudson TJ. Control genes and variability: absence of ubiquitous reference transcripts in diverse mammalian expression studies. Genome Res. 2002;12:292–7. doi: 10.1101/gr.217802. [DOI] [PMC free article] [PubMed] [Google Scholar]
- Loganantharaj N, Nichols WA, Bagby GJ, Volaufova J, Dufour J, Martin DH, Nelson S, Amedee AM. The effects of chronic binge alcohol on the genital microenvironment of simian immunodeficiency virus-infected female rhesus macaques. AIDS Res Hum Retroviruses. 2014;30:783–91. doi: 10.1089/aid.2014.0065. [DOI] [PMC free article] [PubMed] [Google Scholar]
- Lorenzo-Redondo R, Fryer HR, Bedford T, Kim EY, Archer J, Kosakovsky Pond SL, Chung YS, Penugonda S, Chipman JG, Fletcher CV, Schacker TW, Malim MH, Rambaut A, Haase AT, McLean AR, Wolinsky SM. Persistent HIV-1 replication maintains the tissue reservoir during therapy. Nature. 2016;530:51–6. doi: 10.1038/nature16933. [DOI] [PMC free article] [PubMed] [Google Scholar]
- Malygin AA, Parakhnevitch NM, Ivanov AV, Eperon IC, Karpova GG. Human ribosomal protein S13 regulates expression of its own gene at the splicing step by a feedback mechanism. Nucleic Acids Res. 2007;35:6414–23. doi: 10.1093/nar/gkm701. [DOI] [PMC free article] [PubMed] [Google Scholar]
- Molina PE, Amedee AM, Veazey R, Dufour J, Volaufova J, Bagby GJ, Nelson S. Chronic binge alcohol consumption does not diminish effectiveness of continuous antiretroviral suppression of viral load in simian immunodeficiency virus-infected macaques. Alcohol Clin Exp Res. 2014;38:2335–44. doi: 10.1111/acer.12507. [DOI] [PMC free article] [PubMed] [Google Scholar]
- North TW, Higgins J, Deere JD, Hayes TL, Villalobos A, Adamson L, Shacklett BL, Schinazi RF, Luciw PA. Viral sanctuaries during highly active antiretroviral therapy in a nonhuman primate model for AIDS. J Virol. 2010;84:2913–22. doi: 10.1128/JVI.02356-09. [DOI] [PMC free article] [PubMed] [Google Scholar]
- Rentoft M, Hultin S, Coates PJ, Laurell G, Nylander K. Tubulin alpha-6 chain is a stably expressed reference gene in archival samples of normal oral tissue and oral squamous cell carcinoma. Exp Ther Med. 2010;1:419–423. doi: 10.3892/etm_00000065. [DOI] [PMC free article] [PubMed] [Google Scholar]
- Rocha-Martins M, Njaine B, Silveira MS. Avoiding pitfalls of internal controls: validation of reference genes for analysis by qRT-PCR and Western blot throughout rat retinal development. PloS one. 2012;7:e43028. doi: 10.1371/journal.pone.0043028. [DOI] [PMC free article] [PubMed] [Google Scholar]
- Suzuki T, Higgins PJ, Crawford DR. Control selection for RNA quantitation. Biotechniques. 2000;29:332–7. doi: 10.2144/00292rv02. [DOI] [PubMed] [Google Scholar]
- Thellin O, Zorzi W, Lakaye B, De Borman B, Coumans B, Hennen G, Grisar T, Igout A, Heinen E. Housekeeping genes as internal standards: use and limits. J Biotechnol. 1999;75:291–5. doi: 10.1016/s0168-1656(99)00163-7. [DOI] [PubMed] [Google Scholar]
- Thorrez L, Van Deun K, Tranchevent LC, Van Lommel L, Engelen K, Marchal K, Moreau Y, Van Mechelen I, Schuit F. Using ribosomal protein genes as reference: a tale of caution. PloS one. 2008;3:e1854. doi: 10.1371/journal.pone.0001854. [DOI] [PMC free article] [PubMed] [Google Scholar]
- Veazey RS, Amedee A, Wang X, Bernice Kaack M, Porretta C, Dufour J, Welsh D, Happel K, Pahar B, Molina PE, Nelson S, Bagby GJ. Chronic Binge Alcohol Administration Increases Intestinal T-Cell Proliferation and Turnover in Rhesus Macaques. Alcohol Clin Exp Res. 2015;39:1373–9. doi: 10.1111/acer.12784. [DOI] [PMC free article] [PubMed] [Google Scholar]
- Wong JK, Yukl SA. Tissue reservoirs of HIV. Curr Opin HIV AIDS. 2016;11:362–70. doi: 10.1097/COH.0000000000000293. [DOI] [PMC free article] [PubMed] [Google Scholar]
- Zhang Q, Wang J, Deng F, Yan Z, Xia Y, Wang Z, Ye J, Deng Y, Zhang Z, Qiao M, Li R, Denduluri SK, Wei Q, Zhao L, Lu S, Wang X, Tang S, Liu H, Luu HH, Haydon RC, He TC, Jiang L. TqPCR: A Touchdown qPCR Assay with Significantly Improved Detection Sensitivity and Amplification Efficiency of SYBR Green qPCR. PloS one. 2015;10:e0132666. doi: 10.1371/journal.pone.0132666. [DOI] [PMC free article] [PubMed] [Google Scholar]