

Abstract
Objective
Micro-RNAs (miRNAs) are a class of posttranscriptional regulators that play crucial roles in various biological processes. Emerging evidence suggests a direct link between miRNAs and development of several diseases including type 2 diabetes (T2D). In this study, we aimed to investigate the effect of predicted miRNA and target genes on insulin resistance.
Materials and Methods
This experimental study was conducted on the C2C12 cell line. Using bioinformatics tools miRNA-135 and two respective target genes-insulin receptor (Insr) and vesicle associated membrane protein 2 (Vamp2)were selected as potential factors involved in insulin resistance process. Levels of glucose uptake miRNA expression and respective gene targets were determined after cell transfaction by miR-135.
Results
It was determined that Insr gene expression was significantly down-regulated in miR-135 transfected C2C12 cell line (P≤0.05). Interestingly; these transfected cells have shown a significant difference in glucose uptake incomparision the positive control cells, while it was similar to the insulin resistant cell line (P≤0.05). In contrast, no significant alteration of Vamp2 gene expression was observed.
Conclusion
Our data indicated no change on the Vamp2 expression level after miRNA transfection, while expression level of Insr was reduced and miR-135 expression was contrarily increased leading to poor stimulation of glucose uptake through insulin, and development of insulin resistance phenotype in C2C12 cell line.
Keywords: Insulin Resistance, MiR-135, Insulin Receptor, C2C12
Introduction
Micro-RNAs (miRNAs) are small noncoding RNA molecules composed of 21-23 nucleotides regulating gene expression through inhibition or degradation of 3´UTR of target mRNA (1). Several evidences indicate on the pivotal roles of these biological molecules in a wide variety of physiological processes and diseases (2,5). Thus, it is not surprising that the discovery of entirely new class of gene expression regulators prompted several research teams to investigate the potential effect of miRNAs on the development of diabetes and its complications (6,7). Now a day, growing evidences indicate that miRNAs are involved in the pathogenesis of type 2 diabetes (T2D) (7,8).
T2D is a less defined condition, culminating in dysregulation of blood glucose levels due to development of insulin resistance and/or relative insulin deficiency. Insulin resistance, as a major component of T2D disease, is thought to result mainly from the various environmental factors including obesity (8).
Skeletal muscle insulin resistance is the earliest visible metabolic defect during the onset of T2D disease (9,10). Additionally, skeletal muscle insulin resistance could lead to the other metabolic syndrome related deregulations (11,12). Therefore, further understanding of skeletal muscle insulin resistance mechanisms is imperative.
Diverse mechanisms have been identified as underlying factors responsible for skeletal muscle insulin resistance, such as genetic components (13,14). Using different approaches to identify the genes associated with T2D, more than 30 genes have determined contributing to insulin resistance, most of which could affect insulin signaling pathway (15).
Alternatively, detection of miRNAs, as important metabolic regulators, have highlighted a novel regulatory mechanism of action suggesting a possible role of these RNA molecules in diabetes. Consistent with previous studies demonstrating contribution of very specific miRNAs in various metabolic processes associated to T2D, it is proposed that miRNAs play critical roles during the inception and progression of this complex metabolic disease (16,18).
Although unusual miRNA signatures have been reported with regards to diabetes, the status and role of these miRNAs have yet remained to be elucidated in the diabetic skeletal muscle. Therefore, an exhaustive investigation of miRNA roles in the diabetic skeletal muscle is necessary (19). It has been demonstrated that insulin resistance was developed in skeletal muscle cell lines, including C2C12 muscle cells (20,21). Therefore, this cell line could be used to screen the potential compounds like miRNAsinvolved in insulin resistance of skeletal muscle.
In this study, we bioinformatically focused on miR-135 and two predicted target genes, insulin receptor (Insr) and vesicle associated membrane protein 2 (Vamp2) as the first components in the cascade causing insulin resistance in cells. Insulin receptor signal transduction has been shown in Figure 1. Decrease in INSR expression has been described in the obese insulin resistant patients with T2D, as remarkably hyperinsulinemic individuals (15,22).
Insulin helps glucose transportation by promoting the exocytosis of the glucose transporter type 4 (GLUT4) through plasma membrane. Delivery of GLUT4 to the plasma membrane is mediated by formation of functional complexes containing VAMP2 that mediates cAMP-stimulated exocytosis in endocrine cells. Delivery of GLUT4 has been indicated to be impaired in the disease states of insulin resistance and T2D (23).
In this study, we aimed to investigate the effect of predicted miRNA (miR-135) and two respective target genes in development of insulin resistance. We have provided evidences that miR-135 directly induces insulin resistance in C2C12 cell line by targeting the insulin signaling pathway.
Materials and Methods
Cell culture
With regards to presence of large amount of the total insulin mediating glucose uptake, this experimental study was conducted on the C2C12 cell line obtained from skeletal muscle, as one of the major insulin target tissues (24).
C2C12 myoblasts line (obtained from Stem Cells Technology Research Center, Tehran, Iran) were cultured in growth medium (GM) composed of Dulbecco’s Modified Eagle Medium (DMEM, Gibco, UK), 10% fetal bovine serum (FBS, Gibco, UK), penicillin 100 IU/ml and streptomycin 100 μg/ml (Gibco, UK) followed by incubation at 37˚C and 5% CO2 , before starting differentiation process. Upon reaching cell density to 70%, they were digested with 0.25% trypsin and seeded into culture dishes. As soon as obtaining more than 90% confluent dish, C2C12 myoblast cells differentiation procedure was initiated by changing GM to differentiation medium (DM) containing DMEM supplemented with 3% horse serum (Gibco, UK). According to previous studies, 70% confluent C2C12 cells were converted in differentiation medium in absence of insulin sensitive cell (IN) or in chronic presence of 100 nM insulin (Gibco, UK) resistant cell (IRC) for 3 days.
Immunocytochemistry
After inducing myogenic differentiation, the cultured C2C12 cells in 12-well plates were washed with PBS and fixed with 4% paraformaldehyde for 15 minutes. 0.5% Triton X-100 was used for permeabilization. The cells were then blocked in 2% goat serum (Sigma, USA) diluted in phosphatebuffered saline (PBS). After blocking, the cells were incubated with anti-PAX7 or anti-myosin primary antibody (Sigma, USA) at 37˚C for 1-2 hour(s). Subsequently, the cells were washed and, the secondary fluorescent antibodies (Ray Biothech, USA) were added to the cells at 37˚C for 1 hour. The nuclei were ultimately stained with DAPI (Invitrogen, USA) for 30 seconds.
Glucose uptake study
In this study, untreated differentiated C2C12 cells (NCC) were incubated in DMEM culture media and considered as negative control. In contrast, differentiated C2C12 cells treating with 1 mM insulin (Sigma, USA) DMEM culture media, during the glucose uptake procedure, was used as positive control. Differentiated C2C12 cells treated with 100 nM insulin for 72 hours or transfected with miR-135 during differentiation process were utilized as experimental cells. After treatment, a glucose uptake assay was performed. Cells were incubated for 1 hour in glucose and serum-free media followed by 3 hour incubation in DMEM containing 5 mM glucose in the presence and absence of 1 mM insulin. Based on Gallant et al. (25) study, after insulin exposure, 50 ml of the media aliquots were taken from the respective wells and added to 150 ml distilled water to achieve four times dilution. The remaining glucose in the media was quantified using the COBAS INTEGRA Glucose HK GEN.3 kit (Roche, Germany). A glucose standard curve was constructed using glucose concentrations ranging between 0.25 mmol and 2 mmol (4.5 mg/dl and 36 mg/dl), which was measured spectrophotometrically at 340 nm (data not shown). All standard curve concentrations were determined by triplicate values.
Target prediction and pathway analysis
According to a wide range literature review and KEGG database (www.genome.jp/kegg), we categorized a set of significantly important genes in insulin resistance pathway. Using Target Scan 6.2, miRWalk and RNAhybrid, we generated a list of miRNA candidates containing a seed site for the previously categorized genes (26,28). Those genes were predicted as miRNA targets by at least two of three prediction databases. Based on bioinformatics prediction, we found that miR-135 targeted several biological molecules, which are regulator of insulin signaling pathway such as Insr and Vamp2, as an important component of glucose transporter type 4 (Gut4) translocation pathway (Fig.1).
Fig.1.

Insulin receptor signal transduction via PI3K/PKB pathway.
Insulin activates tyrosine kinase, which phosphorylates and recruits different substrate adaptors such as the IRS protein family. Tyrosine-phosphorylated IRS subsequently displays binding sites for numerous signaling partners, among which PI3K has a major role in insulin function, mainly via the activation of the PKB and the PKC pathways. It stimulates glucose uptake in the muscles via translocation of GLUT4 vesicles to the plasma membrane through phosphorylation of AS160. Under basal conditions, small positive GLUT4 vesicles also contain VAMP2. VAMP2 is involved in the docking and fusion of GLUT4 vesicles with the plasma membrane and indeed, studies have implicated a role for VAMP2 in insulin-dependent trafficking in cell.
PI3K; Phosphatidylinositol-4,5-bisphosphate 3-kinase, PKB; Protein kinase B, IRS; Insulin receptor substrate, PKC; Protein kinase C, GLUT4; Glucose transporter type 4, VAMP2; Vesicle-associated membrane protein 2, AS160; AKT substrate of 160 kDa, and INSR; Insulin receptor.
Construction of miR-135 expression vector
To create pre-miR expression vectors, we first amplified a 400 bp DNA fragment covering a premiR, using mouse genomic DNA as a template. PCR reactions were performed corresponding specific primers and then amplified fragment was cloned into a lentiviral vector (pCDH-CMVMCSEF1-copGFP from System Biosciences, USA) at XbaI and EcoR1 sites. Partial digestions were performed in cases that there was an internal XbaI and EcoR1 site to obtain the DNA fragment carrying the pre-miR. Expression of mature miR was confirmed by the TaqMan real-time PCR kit (Applied Biosystems, USA) (29) and bidirectional sequencing (Microgene, Korea).
Transfection of miR-135
C2C12 cells were transfected immediately after trypsinization, while the cells were in suspension with the scramble or miR-135 mimic (pCDH/miR135) using Lipofectamine 2000 (Invitrogen, USA). The 70% confluent C2C12 cells were trypsinized and then seeded in 6-well plates in growth medium. Immediately after plating the cells, while they were still in suspension, differentiation medium was supplemented with the complexes and added to the cells. The cells were incubated with lipid-DNA complexes, while they were attached to the culture dish at 37˚C and 5% CO2.The complex medium was removed after 24 hours followed by adding fresh differentiation medium. Ultimately, the cells and respective media were collected at 72-hour post-transfection of the cell differentiation and subjected to reverse transcriptase-polymerase chain reaction (RT-PCR) and glucose uptake analyses.
RNA isolation and quantitative reverse transcriptase-polymerase chain reaction
Total RNA was extracted from the cells using TRIzol (Invitrogen, USA) according to the manufacturer’s instruction. The quality and concentration of total RNA were subsequently estimated using denatured gel electrophoresis and spectrophotometer, respectively. According to previous study miR could be amplified with stem-loop realtime PCR using specific stem-loop primers (30). Expression level of the corresponding predicted mRNA targets (Insr and Vamp2) to the selected miR was also validated by real-time PCR using gene specific primers. The threshold cycle average was used for data analysis by Rotor-gene Q software (Corbett, Australia). Genes and related specific primers are presented in the Table 1. Insr and Vamp2 expressions were normalized against the expression of β-actin. Snord-6 (U6) was also selected as internal control for miR expression. All PCRs were performed in triplicates and run in at least 3 independent experiments. The 2−ΔΔCtalgorithm was employed to evaluate the relative expression level of each gene.
Table 1.
Designed specific primers for PCR assays
| Primer | Sequence (5´-3´) |
|---|---|
| Reverse transcription | |
| miR 135astem-loop | 5ˊGTCGTATGCAGAGCAGGGTCCGAGGTATTCGCACTGCATACGACTCACA 3ˊ |
| qRT-PCR | |
| miR-135a | F : 5ˊCGATATGGCTTTTTATTCCTA3ˊ |
| R : 5ˊGAGCAGGGTCCGAGGT 3ˊ | |
| Insr | F: 5ˊAACAGATGCCACTAATCCTTC 3ˊ |
| R: 5ˊGCCCTTTGAGACAATAATCC 3ˊ | |
| Vamp2 | F: 5ˊGTCACTGCCTCTGCCAAG3ˊ |
| R: 5ˊGTCCACCACCTCATCCAC3ˊ | |
qRT-PCR; Quantitive reverse transcriptase-polymerase chain reaction.
Comparison of quantitative reverse transcriptase-polymerase chain reaction result by a high throughput method data
We next investigated whether the candidate gene expression levels obtained by quantitative RTPCR (qRT-PCR) were comparable with other methods. To this end, the qRT-PCR results of candidate genes were compared with two microarray data Gene Expression Omnibus (GEO) including muscle samples from insulin resistance individuals (GEO accession # GSE6798) and blood samples from T2D patients (GEO accession # GSE26168) (31,32).
Statistical analysis
The data are presented as mean GS.E.M. To determine statistical significance, student’s t test was applied. The significance threshold was set at P≤0.05. All experiments were performed tree times.
Results
Characterization of C2C12 differentiation
C2C12 cells were proliferated in the presence of serum and differentiated upon partial serum deprivation from myoblast cells causing their differentiation into myocytes. This was validated by positive Immunocytochemistry (ICC) result for specific skeletal marker, myosin. Using ICC technique, we also determined C2C12 myoblast cell type expressing precursor cells marker, PAX7 (Fig.2).
Fig.2.
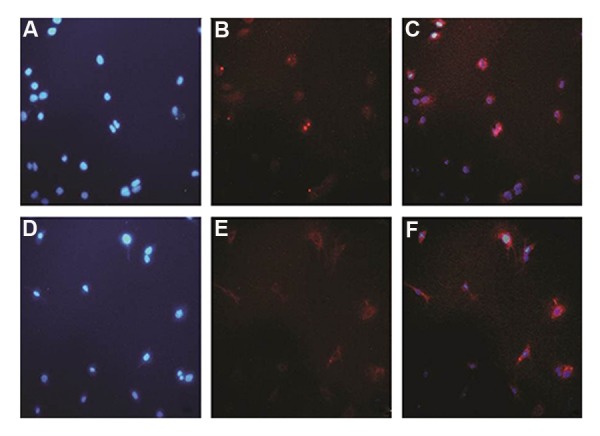
Myoblast to myocyte differentiation using 3% horse serum. A-C. C2C12 myoblasts were stained with PAX and DAPI antibodies, as positive control of precursor cells. After that myoblasts were differentiated with DMEM medium containing 3% horse serum during 3 days and D-F. The differentiated cells were seeded in new plate and stained with (MyHC) antibody as well as DAPI. DAPI; 4´,6-diamidino2-phenylindole and DMEM; Dulbecco’s Modified Eagle Medium.
In vitro studies on miR135-transfected C2C12 cells
Quantitative reverse transcriptase-polymerase chain reaction analysis
qRT-PCR analysis showed that miR-135 was induced and had significantly altered expression pattern in miR-transfected C2C12 cells compared to negative control cell line scramble (miR-135 fold change: 1.537, P≤0.05). We have examined Vamp2 and Insr expressions in transfected C2C12 cells, to identify potential markers within development of insulin resistance (Fig.3). Interestingly, qRT-PCR analysis, showed that expression level of Insr targeted by miR-135 in silico, was down-regulated in transfected cells (Insr fold change: 0.168, P≤0.05). There was a significant decrease in Insr gene expression in the transfected C2C12 cells compared to negative control, indicating a down-regulation of Insr gene expression due to the miR-135 transfection. In contrast to Insr expression level in transfected C2C12 cells, miR-135 expression level was upregulate (P≤0.05), suggesting this miR is responsible for the decreased level of Insr. No significant alteration was observed on the expression of Vamp2 (Vamp2 fold change: 1.366, P>0.05).
Fig.3.

Expression pattern of the candidate genes during miR-135 transfection. Based on real time (qRT-PCR) results which were concurrent to miR-135 up-regulation in transfected cells, Insr has significant down-regulated profile during differentiation process (P≤0.05). In contrast, no significant overexpression of Vamp2 was observed (P>0.05). Error bars indicate SEM (n=3). qRT-PCR; Quantitive reverse transcriptase-polymerase chain reaction.
Sustained expression of miR-135 attenuated glucose uptake in C2C12
Insulin was shown to provide a significant increase in the amount of glucose taken up by positive control cell (PCC).
Our PCC, showed a significant increase in glucose uptake in C2C12 cells (G uptake: 48 mg/dl) compared to the negative control (NCC, G uptake: 32 mg/dl, P≤0.05).
Hyperinsulinemia was used to induce insulin resistance in the C2C12 cells (IRC, G uptake: 7 mg/ dl). Findings showed a significant suppression of glucose uptake in the IRC compared to the PCC (Fig.4).
Fig.4.

Image illustrates glucose uptake in different status of C2C12 cells. IRC and TCC showed a reduction in G uptake compared to PCC. Error bars indicate SEM (n=3).
NCC; Normal control negative, PCC; Normal control positive, IRC; Insulin resistance cell, and TCC; miR-135-trasfected Cell.
Transfected C2C12 (TCC) where exposed for 72 hours to differentiation medium. Thereafter glucose uptake was determined. Interestingly, the miR-135-trasfected cells (G uptake: 9 mg/dl) showed a significant difference in glucose uptake in comparison with PCC (P≤0.05), while it was similar to IRC (P=0.71).
Evaluation of reverse transcriptase-polymerase chain reaction result by microarray data
To extend the results of qRT-PCR, we used Affymetrix cDNA microarray row data (GEO accessions # GSE6798 and GSE26168) and analyzed relative transcript levels Vamp2 and INSR in control samples compared to insulin resistance in muscle and blood samples (31,32).
Data analysis reflected similar down-regulation trends for INSR expression obtained from both microarray results; muscle samples (INSR fold change: 0.884, P≤0.05) and blood samples (INSR fold change: 0.552, P≤0.001). This was similar to our observation obtained from qRT-PCR analysis (Fig.5). On the contrary, there was an up-regulation for VAMP2 expression in all three studies. Muscle microarray analysis showed a significant up-regulation for VAMP2 (VAMP2 fold change: 1.156, P=0.036), although no significant change was observed for VAMP2 expression in blood sample (VAMP2 fold change: 3.1949, P=0.271) in comparison with healthy control (Fig.5).
Fig.5.

Comparison of miR-135 predicted gene target expression levels during myogenesis using two different methods. Fold changes in qRT-PCR and two microarrays were compatible for INSR as well as qRT-PCR Muscle microarray for VAMP2 (P≤0.05). Error bars indicate SEM (n=3). qRT-PCR; Quantitive reverse transcriptase-polymerase chain reaction.
Discussion
The present study investigated association of the miR-135 and relative targets to insulin resistance in vitro, with the aim to understand the processes involved in pathogenesis of T2D. It has been reported that miRs can potentially be served as novel regulator of diseases, including T2D (6,14). This theory was supported by Kosaka et al. (33) which generated the idea of miRs-mediated intercellular statement. Although there are several reports describing the status and role of miRs in diabetic tissues, very few studies have focused on the diabetic skeletal muscle (7,8,17,18,34).
The principal objective of present study was based on the fact that defects in the insulin signaling pathway leads to T2D and insulin resistance is crucial stage on the onset of this disease. Based on our comprehensive integrative bioinformatics analysis, several pathways intermediate a role in T2D development, including insulin signaling pathway. Along with all those candidates, miR135 and the relative targets, especially Insr, are among the original top-ranking T2D risk factors. Our data showed that Insr gene expression was significantly down-regulated in C2C12 cells after transfection with miR-135. Increased expression of the miR-135 had accompanied with decline in the expression of Insr, as the first component of the insulin signaling pathway, compared to the control cell line. However, Vamp2 was not significantly changed after transfection with miR-135. Since we had observed an inverse expression pattern of miR-135 and Insr in the transfected C2C12 cells, our team sought to identify whether it has any effect on glucose uptake. Interestingly, the miR-135 transfected cells showed a down-regulation of Insr gene expression accompanied with a significant decrease in glucose uptake when compared to PCC, while it was the same as IRC. We determined that reduction of Insr expression level in the presence of miR-135, contributed to the downstream effects of insulin action. INSR is a critical component of the insulin signaling cascade .Therefore, abnormality of INSR expression appears to be a significant defect that may result in reduction of insulin-stimulated glucose disposal in muscle. To confirm our results, we compared them with Affymetrix cDNA microarray data obtained from GEO accession numbers GSE6798 and GSE26168. Skov et al. (31) had previously analyzed 13 different RNA samples from healthy control and 16 different RNA samples from obese human insulin resistance vastus lateralis muscle (overall 29 microarrays, GEO accession # GSE6798). These individuals were selected from a larger cohort who participated in a previously reported study. In the other study, Karolina et al. (32), carried out mRNA microarray investigation on 8 different peripheral blood RNA samples of T2D individuals and 9 control samples (GEO accession # GSE26168). Microarray analysis confirmed our findings (P≤0.05) except for VAMP2. However, the magnitude of microarray data changes was not similar to qRTPCR results. Regarding that qRT-PCR indicator is linear over a wide concentration series (35), as completed by serial dilution tests with different samples (data not shown), we believe that this technique provides a more accurate representation of changes in the level of specific transcripts in the miR-135 transfected versus the normal C2C12 cells, compared to the microarray analysis. Never the less, both studies indicated that there is a significant down-regulation of INSR expression pattern in insulin resistance and T2D samples.
According to our main results, miR-135 overexpression has negative effects on glucose uptake seemingly through targeting Insr in the insulin signaling pathway. It gives the impressions that overexpression of miR-135 could be involved in insulin resistance, and it could affect related pathways responding normally to insulin using signaling molecules involved in removing glucose in tissues, through down-regulation of Insr. Consistent with our finding, Agarwal et al. (36) found that miR-135 level was elevated in diabetic skeletal muscle and miR-135 silence in vivo improved glucose tolerance via downregulation of IRS2, the other member of insulin signaling cascade. Targeting different components of one signaling pathway by a single miR implicates the regulatory role of respective miR (37,38). Hence, our results accompanied with Agawal’s finding further confirming the involvement of miR-135 in insulin resistance.
Conclusion
In this study, it was demonstrated that the lack of Insr expression and increased level of miR-135, contributed to the poor stimulation of glucose uptake by insulin in C2C12 cell line developing insulin resistance phenotype. However, further studies are required to address complex regulatory roles of this miR. Establishing the role and regulation of muscle miRs will enhance our understanding about insulin resistance development. Combining informatics, biochemical and genetic approaches not only will lucid the miR regulatory role in T2D, but also will raise new opportunities for therapeutic intervention in this complex diseases by identifying candidate miRs as potential targets for clinical application.
Acknowledgments
This research was funded by Qazvin University of Medical Sciences incorporation with Stem Cell Technology Center (Bonyakhteh), Tehran, Iran. The authors declare that have no conflict of interest and also would like to thank to Dr. Samira Mohammadi Yeganeh and Ms. Rezvan Tavakoli for their helps during this survey.
References
- 1.Xu L, Qi X, Duan S, Xie Y, Ren X, Chen G, et al. MicroRNAs: potential biomarkers for disease diagnosis. Biomed Mater Eng. 2014;24(6):3917–3925. doi: 10.3233/BME-141223. [DOI] [PubMed] [Google Scholar]
- 2.Zhang X, Wang H, Zhang S, Song J, Zhang Y, Wei X, et al. MiR-134 functions as a regulator of cell proliferation, apoptosis, and migration involving lung septation. In Vitro Cell Dev Biol Anim. 2012;48(2):131–136. doi: 10.1007/s11626-012-9482-3. [DOI] [PubMed] [Google Scholar]
- 3.He L, He X, Lim LP, de Stanchina E, Xuan Z, Liang Y, et al. A microRNA component of the p53 tumour suppressor network. Nature. 2007;447(7148):1130–1134. doi: 10.1038/nature05939. [DOI] [PMC free article] [PubMed] [Google Scholar]
- 4.Tavazoie SF, Alarcón C, Oskarsson T, Padua D, Wang Q, Bos PD, et al. Endogenous human microRNAs that suppress breast cancer metastasis. Nature. 2008;451(7175):147–152. doi: 10.1038/nature06487. [DOI] [PMC free article] [PubMed] [Google Scholar]
- 5.Small EM, Olson EN. Pervasive roles of microRNAs in cardiovascular biology. Nature. 2011;469(7330):336–342. doi: 10.1038/nature09783. [DOI] [PMC free article] [PubMed] [Google Scholar]
- 6.Tang X, Tang G, Ozcan S. Role of MicroRNAs in Diabetes. Biochim Biophys Acta. 2008;1779(11):697–701. doi: 10.1016/j.bbagrm.2008.06.010. [DOI] [PMC free article] [PubMed] [Google Scholar]
- 7.Guay C, Roggli E, Nesca V, Jacovetti C, Regazzi R. Diabetes mellitus, a microRNA-related disease? Transl Res. 2011;157(4):253–264. doi: 10.1016/j.trsl.2011.01.009. [DOI] [PubMed] [Google Scholar]
- 8.Williams MD, Mitchell GM. MicroRNAs in insulin resistance and obesity. Exp Diabetes Res. 2012;2012:484696–484696. doi: 10.1155/2012/484696. [DOI] [PMC free article] [PubMed] [Google Scholar]
- 9.Weyer C, Bogardus C, Mott DM, Pratley RE. The natural history of insulin secretory dysfunction and insulin resistance in the pathogenesis of type 2 diabetes mellitus. J Clin Invest. 1999;104(6):787–794. doi: 10.1172/JCI7231. [DOI] [PMC free article] [PubMed] [Google Scholar]
- 10.Warram JH, Martin BC, Krolewski AS, Soeldner JS, Kahn CR. Slow glucose removal rate and hyperinsulinemia precede the development of type II diabetes in the offspring of diabetic parents. Ann Intern Med. 1990;113(12):909–915. doi: 10.7326/0003-4819-113-12-909. [DOI] [PubMed] [Google Scholar]
- 11.Petersen KF, Dufour S, Savage DB, Bilz S, Solomon G, Yonemitsu S, et al. The role of skeletal muscle insulin resistance in the pathogenesis of the metabolic syndrome. Proc Natl Acad Sci USA. 2007;104(31):12587–12594. doi: 10.1073/pnas.0705408104. [DOI] [PMC free article] [PubMed] [Google Scholar]
- 12.Bouzakri K, Koistinen HA, Zierath JR. Molecular mechanisms of skeletal muscle insulin resistance in type 2 diabetes. Curr Diabetes Rev. 2005;1(2):167–174. doi: 10.2174/1573399054022785. [DOI] [PubMed] [Google Scholar]
- 13.Schäfer SA, Machicao F, Fritsche A, Häring HU, Kantartzis K. New type 2 diabetes risk genes provide new insights in insulin secretion mechanisms. Diabetes Res Clin Pract. 2011;93(Suppl 1):S9–24. doi: 10.1016/S0168-8227(11)70008-0. [DOI] [PubMed] [Google Scholar]
- 14.Chen H, Lan HY, Roukos DH, Cho WC. Application of microRNAs in diabetes mellitus. J Endocrinol. 2014;222(1):R1–R10. doi: 10.1530/JOE-13-0544. [DOI] [PubMed] [Google Scholar]
- 15.Honardoost M, Sarookhani MR, Arefian E, Soleimani M. Insulin resistance associated genes and miRNAs. Appl Biochem Biotechnol. 2014;174(1):63–80. doi: 10.1007/s12010-014-1014-z. [DOI] [PubMed] [Google Scholar]
- 16.Gong W, Xiao D, Ming G, Yin J, Zhou H, Liu Z. Type 2 diabetes mellitus-related genetic polymorphisms in microRNAs and microRNA target sites. J Diabetes. 2014;6(4):279–289. doi: 10.1111/1753-0407.12143. [DOI] [PubMed] [Google Scholar]
- 17.Ortega FJ, Mercader JM, Moreno-Navarrete JM, Rovira O, Guerra E, Esteve E, et al. Profiling of circulating microRNAs reveals common microRNAs linked to type 2 diabetes that change with insulin sensitization. Diabetes Care. 2014;37(5):1375–1383. doi: 10.2337/dc13-1847. [DOI] [PubMed] [Google Scholar]
- 18.Wang X, Sundquist J, Zöller B, Memon AA, Palmér K, Sundquist K, et al. Determination of 14 circulating microRNAs in Swedes and Iraqis with and without diabetes mellitus type 2. PLoS One. 2014;9(1):e86792–e86792. doi: 10.1371/journal.pone.0086792. [DOI] [PMC free article] [PubMed] [Google Scholar]
- 19.McClelland AD, Kantharidis P. microRNA in the development of diabetic complications. Clin Sci (Lond) 2014;126(2):95–110. doi: 10.1042/CS20130079. [DOI] [PubMed] [Google Scholar]
- 20.Kumar N, Dey CS. Metformin enhances insulin signalling in insulin-dependent and-independent pathways in insulin resistant muscle cells. Br J Pharmacol. 2002;137(3):329–336. doi: 10.1038/sj.bjp.0704878. [DOI] [PMC free article] [PubMed] [Google Scholar]
- 21.Marquette ML, Byerly D, Sognier M. A novel in vitro threedimensional skeletal muscle model. In Vitro Cell Dev Biol Anim. 2007;43(7):255–263. doi: 10.1007/s11626-007-9054-0. [DOI] [PubMed] [Google Scholar]
- 22.Imano E, Kadowaki H, Kadowaki T, Iwama N, Watarai T, Kawamori R, et al. Two patients with insulin resistance due to decreased levels of insulin-receptor mRNA. Diabetes. 1991;40(5):548–557. doi: 10.2337/diab.40.5.548. [DOI] [PubMed] [Google Scholar]
- 23.Schwenk RW, Angin Y, Steinbusch LK, Dirkx E, Hoebers N, Coumans WA, et al. Overexpression of vesicle-associated membrane protein (VAMP) 3, but not VAMP2, protects glucose transporter (GLUT) 4 protein translocation in an in vitro model of cardiac Insulin Resistance. J Biol Chem. 2012;287(44):37530–37539. doi: 10.1074/jbc.M112.363630. [DOI] [PMC free article] [PubMed] [Google Scholar]
- 24.Chen JC, Goldhamer DJ. Skeletal muscle stem cells. Reprod Biol Endocrinol. 2003;1:101–101. doi: 10.1186/1477-7827-1-101. [DOI] [PMC free article] [PubMed] [Google Scholar]
- 25.Gallant M, Odei-Addo F, Frost CL, Levendal RA. Biological effects of THC and a lipophilic cannabis extract on normal and insulin resistant 3T3-L1 adipocytes. Phytomedicine. 2009;16(10):942–949. doi: 10.1016/j.phymed.2009.02.013. [DOI] [PubMed] [Google Scholar]
- 26.Lewis BP, Burge CB, Bartel DP. Conserved seed pairing, often flanked by adenosines, indicates that thousands of human genes are microRNA targets. Cell. 2005;120(1):15–20. doi: 10.1016/j.cell.2004.12.035. [DOI] [PubMed] [Google Scholar]
- 27.Dweep H, Gretz N, Sticht C. miRWalk database for miRNA-target interactions. Methods Mol Biol. 2014;1182:289–305. doi: 10.1007/978-1-4939-1062-5_25. [DOI] [PubMed] [Google Scholar]
- 28.Krüger J, Rehmsmeier M. RNAhybrid: microRNA target prediction easy, fast and flexible. Nucleic Acids Res. 2006;34(Web Server issue):W451–454. doi: 10.1093/nar/gkl243. [DOI] [PMC free article] [PubMed] [Google Scholar]
- 29.Chen C, Ridzon DA, Broomer AJ, Zhou Z, Lee DH, Nguyen JT, et al. Real-time quantification of microRNAs by stem-loop RT-PCR. Nucleic Acids Res. 2005;33(20):e179–e179. doi: 10.1093/nar/gni178. [DOI] [PMC free article] [PubMed] [Google Scholar]
- 30.Honardoost M, Soleimani M, Arefian E, Sarookhani MR. Expression change of miR-214 and miR-135 during muscle differentiation. Cell J. 2015;17(3):461–470. doi: 10.22074/cellj.2015.7. [DOI] [PMC free article] [PubMed] [Google Scholar]
- 31.Skov V, Glintborg D, Knudsen S, Jensen T, Kruse TA, Tan Q, et al. Reduced expression of nuclear-encoded genes involved in mitochondrial oxidative metabolism in skeletal muscle of insulin-resistant women with polycystic ovary syndrome. Diabetes. 2007;56(9):2349–2355. doi: 10.2337/db07-0275. [DOI] [PubMed] [Google Scholar]
- 32.Karolina DS, Armugam A, Tavintharan S, Wong MT, Lim SC, Sum CF, et al. MicroRNA 144 impairs insulin signaling by inhibiting the expression of insulin receptor substrate 1 in type 2 diabetes mellitus. PLoS One. 2011;6(8):e22839–e22839. doi: 10.1371/journal.pone.0022839. [DOI] [PMC free article] [PubMed] [Google Scholar]
- 33.Kosaka N, Yoshioka Y, Hagiwara K, Tominaga N, Ochiya T. Functional analysis of exosomal microRNA in cell-cell communication research. Methods Mol Biol. 2013;1024:1–10. doi: 10.1007/978-1-62703-453-1_1. [DOI] [PubMed] [Google Scholar]
- 34.Rome S. Are extracellular microRNAs involved in type 2 diabetes and related pathologies? Clin Biochem. 2013;46(10-11):937–945. doi: 10.1016/j.clinbiochem.2013.02.018. [DOI] [PubMed] [Google Scholar]
- 35.Qin LX, Beyer RP, Hudson FN, Linford NJ, Morris DE, Kerr KF. Evaluation of methods for oligonucleotide array data via quantitative real-time PCR. BMC Bioinformatics. 2006;7:23–23. doi: 10.1186/1471-2105-7-23. [DOI] [PMC free article] [PubMed] [Google Scholar]
- 36.Agarwal P, Srivastava R, Srivastava AK, Ali S, Datta M. miR-135a targets IRS2 and regulates insulin signaling and glucose uptake in the diabetic gastrocnemius skeletal muscle. Biochim Biophys Acta. 2013;1832(8):1294–1303. doi: 10.1016/j.bbadis.2013.03.021. [DOI] [PubMed] [Google Scholar]
- 37.Mao Y, Mohan R, Zhang S, Tang X. MicroRNAs as pharmacological targets in diabetes. Pharmacol Res. 2013;75:37–47. doi: 10.1016/j.phrs.2013.06.005. [DOI] [PMC free article] [PubMed] [Google Scholar]
- 38.Yu Y, Chai J. The function of miRNAs and their potential as therapeutic targets in burn-induced insulin resistance (review) Int J Mol Med. 2015;35(2):305–10. doi: 10.3892/ijmm.2014.2023. [DOI] [PubMed] [Google Scholar]