Summary
Latent autoimmune diabetes of the adults (LADA) accounts for up to 12% of all patients with diabetes. Initially the disease resembles type 2 diabetes (T2D); however, the typical presence of β cell autoantibodies indicates an autoimmune basis of LADA. While dysfunctional regulatory T cells (Tregs) have been implicated in autoimmune diabetes, these cells have been scarcely studied in LADA. The aim of this study was to investigate the frequency and phenotype of circulating Tregs in LADA patients early during disease progression. Flow cytometric analysis was performed on whole blood and peripheral mononuclear cells (PBMC) from patients diagnosed with LADA prior to insulin deficiency (n = 39) and from healthy volunteers (n = 20). Overall, we found the frequency and activation status of peripheral putative Tregs to be altered in LADA patients compared to healthy controls. While total T cells and CD4+ T cells expressing high levels of CD25 (CD4+CD25hi) were unchanged, the frequency and total numbers of CD4+ T cells expressing an intermediate level of CD25 (CD4+CD25int) were decreased in LADA patients. Interestingly, the expression of the Treg‐specific marker forkhead box protein 3 (FoxP3), as well as the activation and memory makers CD69, cytotoxic T lymphocyte associated antigen 4 (CTLA‐4), CCR4 and CD45RO were increased in CD4+CD25+ T cells of the patients. Our data depict phenotypical changes in T cells of LADA patients that may reflect a derangement in peripheral immune regulation contributing to the slow process leading to insulin‐dependent diabetes in these patients.
Keywords: autoimmunity, diabetes, regulatory T cells
Introduction
Latent autoimmune diabetes of the adult (LADA), a slow progressive form of type 1 diabetes (T1D) 1, shares features of both T1D and type 2 diabetes (T2D), with a late onset above 30 years of age, insulin independency for at least 6 months following diagnosis and single autoantibody positivity for either islet cell cytoplasmic autoantibodies (ICA) or glutamic acid decarboxylase (GADA) 2. In addition to autoantibody positivity, LADA patients carry the transcription factor 7‐like 2 (TCF7L2) gene polymorphism that is associated with T2D and display insulin resistance, often resulting in T2D as a primary classification 1, 3. Furthermore, although the T1D high‐risk alleles human leucocyte antigen (HLA)‐DR3 and HLA‐DR4 have also been implicated in susceptibility to LADA, other HLA alleles (DR2 or DQB1*0602) that are considered as being protective against T1D are more common in LADA 4. Besides genetic discrepancies between T1D, T2D and LADA, early treatment of LADA patients consists of diet and lifestyle changes as well as hypoglycaemic drugs. However, more than 70% of LADA patients develop insulin dependency over time, reflecting a slow progressive β cell loss 3, indicating that β cell autoimmunity might play a significant role in the pathogenesis of LADA.
Although peripheral cellular immunology has not been investigated deeply in LADA, it has been reported that T cells reactive to GAD65 in LADA patients secrete higher levels of interferon (IFN)‐γ compared to T2D patients 5, and show augmented proliferative responses to islet antigens in peripheral mononuclear cells 6. Similar patterns of cellular and systemic proinflammatory cytokine profile 7, alterations of natural killer (NK) cells frequency and phenotype 8, 9 and the presence of beta cell‐specific autoantibodies 10, 11 are immunological evidences that LADA shares common immunological features with T1D.
Regulatory T cells (Tregs) are an important component of the immune system and may be involved in autoimmunity 12, 13, 14. The suppressive function of Tregs affects proliferation and cytokine secretion of CD4+ and CD8+ T cells among other cell types, and Treg dysfunction may lead to immunopathology 14. It has been reported that the impaired function of Tregs in T1D could be caused in part by resistance of T effector cells (Teffs) to Treg‐mediated suppression, rather than due to a deficiency in Treg numbers 15. Tregs typically express high levels of the interleukin (IL)‐2 receptor α‐chain (CD25) and the transcription factor forkhead box protein 3 (FoxP3), which are required for their development and function and are both used currently as markers for the characterization of these cells 12, 14.
Studies investigating the phenotype and frequencies of Tregs in LADA have been scarce. Interestingly, some studies have demonstrated a significant decrease in the expression of FoxP3 mRNA in CD4+ T cells in LADA subjects 16. Supporting this finding, the FoxP3 promoter region was determined to be hypermethylated in CD4+ T cells from LADA patients 17. Overall, several studies published controversial results regarding the total number and frequency of Tregs in T1D patients compared to healthy controls 18, 19, 20, 21. CD4+FoxP3+CD25hi has been considered to be representative of the peripheral natural Treg population, although the characterization of Tregs is still problematic, as CD25 and FoxP3 are also expressed on recently activated effector T (Teff)+ cells 22.
In this study we aimed to investigate the frequency and phenotype of circulating peripheral Tregs in LADA patients in order to identify specific cellular signatures of disease progression.
Research design and methods
Study population
Blood samples were collected from a total of 47 patients diagnosed with LADA (Table 1). These patients were selected based on the following criteria: (1) male and female patients aged between 30 and 70 years; (2) diagnosis of T2D within the previous 5 years; (3) presence of GADA; and (4) non‐insulin‐dependent and treated only with diet and oral hypoglycaemic agents. Fasting glucose, fasting and 2‐h Sustacal stimulated C‐peptide and long‐term metabolic control assessed by haemoglobin A1c (HbA1c) levels were taken into consideration when the diabetes status was determined. The following data were recorded specifically for the clinical characterization of these subjects: age, body mass index (BMI), fB‐glucose and fS‐insulin. We enrolled 47 patients into this study. The patients were generally overweight, with a mean BMI of 27 kg/m2. The P‐glucose ranged between 5·5 and 17·4 mol/l (mean 8·7) (Table 1).
Table 1.
Demographic and metabolic characteristics of study subjects
| LADA | Healthy controls | |
|---|---|---|
| Number of subjects | 47 | 20 |
| Age (years) | 56 (37–69) | 46·2 (30–59) |
| Males | 39 | 9 |
| BMI (kg/m2) | 27 (20–39) | 24 (20–24) |
| HbAlc% | 6·7 (4·6 −10·9) | n.d. |
| Fasting p‐glucose (mmol/l) | 8·7 (5·5–17·4) | n.d. |
| Fastine: C‐peptide (nmol/l) | 0·65 (0·3 – 1·8) | n.d. |
| Stimulated C‐peptide (nmol/l) | 1·5 (0·5–5·1) | n.d. |
| Loe:‐GADA (U/ml) | 1·94 (1·4–5·8) | neg |
| IA‐2A‐positive (n) | 5 | 0 |
| Duration of diabetes (years) | 3 (2–5) | n.a. |
Median values (range) are shown. LADA = latent autoimmune diabetes of adults; BMI = body mass index; n.a. = not available; n.d. = not determined; IA‐2A = insulinoma associated‐2 autoantibodies; GADA = glutamic acid decarboxylase; HbAlc% = haemoglobin A1c.
As controls, we recruited 20 healthy age‐ and sex‐matched individuals, without history of diabetes or other autoimmune diseases (Table 1). None of the healthy controls or the patients enrolled into this study had concurrent infections or anti‐inflammatory treatment at the time of blood withdrawal. All blood samples were taken from all participants in the morning and fasting. The Lund University Research Ethics Committee approved the study and informed consent was obtained from all participants.
Reagents
For flow cytometric analysis, all stainings were performed in fluorescence activated cell sorter (FACS) buffer containing phosphate‐buffered saline (PBS) (Life Technologies, Paisley, Scotland), supplemented with 2% bovine serum albumin (BSA; ICN Biomedicals Inc., Aurora, Ohio, USA) and 2 mM ethylenediamine tetraacetic acid (EDTA) (Sigma‐Aldrich, St Louis, MO, USA) (pH 7·2) (PBS). FACS lysing solution 2 (BD Biosciences, San Jose, CA, USA) was used to lyse erythrocytes before analysis. For freezing of peripheral blood mononuclear cells (PBMC), 90% human serum from clotted whole blood (Sigma‐Aldrich) was mixed with 10% (vol/vol) dimethyl sulphoxide (DMSO) (Sigma‐Aldrich). For thawing PBMC, complete RPMI‐1640 medium (C‐RPMI) was used (Life Technologies) supplemented with 5% vol/vol pooled human serum from clotted male whole blood (Sigma‐Aldrich), 1% sodium pyruvate (Life Technologies), 7·5% sodium bicarbonate (Life Technologies,) L‐glutamine (ICN Biomedicals Inc.), antibiotic mixture (penicillin, streptomycin, neomicin; Life Technologies), β‐mercaptoethanol (ICN Biomedicals Inc.) and non‐essential amino acids (MEM; Life Technologies).
Antibodies
Cells were stained with fluorochrome‐conjugated antibodies directed against the following surface markers: CD3 [phycoerythrin (PE)‐ or fluorescein isothiocyanate (FITC)‐conjugated], CD4 (peridin chlorophyll (PerCp)‐conjugated), CD8 (PE‐ or PerCp‐conjugated), CD25 (FITC‐conjugated), CD45RO [allophycocyanin (APC)‐conjugated], CD19 (PerCp‐conjugated), CCR4 (PE‐conjugated), CTLA4 (CD152, PE‐conjugated) and isotype controls, immunoglobulin (Ig)G2a (FITC‐conjugated) and IgG1 (PE‐ and APC‐conjugated), all from BD Biosciences; and FoxP3 APC‐conjugated (eBioscience, San Diego, CA, USA).
Preparation of PBMC
PBMC were separated from whole blood using Lymphoprep (Axis‐Shield PoC AS, Oslo, Norway) or Vacutainer Cell Preparation Tubes (BD Biosciences). The isolated lymphocytes were washed with PBS and frozen in freezing media containing 90% human serum (Sigma‐Aldrich) and 10% DMSO (Sigma‐Aldrich), which was added dropwise to the cells before they were frozen and stored in liquid nitrogen 23. The cells were used to perform intracellular and intranuclear staining to evaluate cytotoxic T lymphocyte antigen 4 (CTLA‐4) and FoxP3 expression on CD4+CD25+ T cells as described below.
Flow cytometry
All antibodies were titrated carefully and unspecific staining was verified using irrelevant isotype monoclonal antibody for each fluorochrome and the FMO (fluorescence‐minus‐one) method was used to set the compensation for each sample.
Whole blood staining
A small aliquot of whole blood was analysed using an AC900 AutoCounter (Swelab Instruments AB, Spånga, Sweden) to determine the absolute numbers of lymphocytes in each sample that was used to calculate the total numbers of different lymphocytes subsets obtained by flow cytometry. Another aliquot of whole blood was used for flow cytometry. Briefly, 100 µl of blood was used for each staining and the samples were incubated for 20–30 min at room temperature. Erythrocytes were lysed using BD FACS lysing Solution 2 (BD Bioscience) and the samples were washed with FACS buffer. Cells were resuspended in 300 µl FACS buffer and stored overnight at 4°C until flow cytometry analysis was performed using a FACSCalibur (Becton Dickinson).
Frozen PBMC staining
Frozen PBMC were used to determine the expression of membrane bound and intracellular CTLA‐4 as well as intranuclear FoxP3. PBMC were thawed as described 23, and only samples with > 98% viability and > 70% recovery were used. Staining of cells was performed according to the manufacturer's protocol (eBioscience). Briefly, samples were washed with staining buffer containing 2% fetal calf serum (FCS; Biochrom AG, Berlin, Germany), 0·01% sodium azide in PBS (pH 7·2 Gibco/Invitrogen Life Technologies, Paisley, Scotland) and thereafter stained with various combinations of anti‐human monoclonal antibodies. After 20 min of incubation at 4°C the cells were washed with staining buffer. Fix/Perm buffer (eBioscience) was added to permeabilize the cells for 45 min at 4°C. The cells were washed and 2% rat serum (eBioscience) for 15 min at 4°C was used to block non‐specific binding. CTLA‐4 and/or FoxP3 antibodies were next added to the wells. After incubation for 30 min at 4°C, the cells were washed with permeabilization buffer and thereafter resuspended in staining buffer for acquisition. Data were acquired using a FACSCalibur (Becton Dickinson) and analysed using CellQuest software (BD Biosciences).
Autoantibody assay
Autoantibodies against GAD65 or IA‐2 in plasma were analysed using a radiobinding assay, as described previously 24, 25. Blood samples were collected into EDTA tubes at Skåne University Hospital in Malmö and processed within 24 h. Levels of autoantibodies were assessed in the serum of each patient using the World Health Organization (WHO) standard and appropriate dilutions of the samples 26.
Data and statistical analysis
Statistically significant differences were determined using the Mann–Whitney two‐tailed U‐test for unpaired observation, as data were determined to be significantly different from a Gaussian distribution. When several groups were compared, correction for multiple comparisons was performed using a Bonferroni post‐hoc test. To evaluate the relationship between C‐peptide and glucose as well as age and BMI with different T cell populations Spearman's correlation coefficient was used. A probability level less than 0·05 was considered to be statistically significant unless stated otherwise. All statistical analyses were performed using Graph Pad Prism (Graph Pad Software, San Diego, CA, USA) and spss for Windows (www.spss.com) software.
Results
Altered frequency of peripheral CD4+CD25+ T cell population in LADA patients
We initially analysed the frequency and total numbers of CD4+CD25+ T cells by flow cytometry in whole blood (Fig. 1). A significant decrease of total number (P = 0·0189) and percentage of CD4+CD25+ T cells (P = 0·0053) was observed in LADA patients compared to the age‐matched healthy subjects (Fig. 1d and data not shown). Furthermore, when we divided the CD4+CD25+ T cell population into CD4+CD25int and CD4+CD25hi according to CD25 expression levels (Fig. 1b,c), we only observed a decrease in the total number (P = 0·0130) and percentage (P = 0·0049) of CD4+CD25int T cells (Fig. 1e and data not shown), while there was no significant difference in the CD4+CD25hi T cell population (Fig. 1f and data not included). No changes were observed in the frequency and absolute numbers of total T cells and B cells as well as total CD4+ or CD8+ T cells (data not shown).
Figure 1.
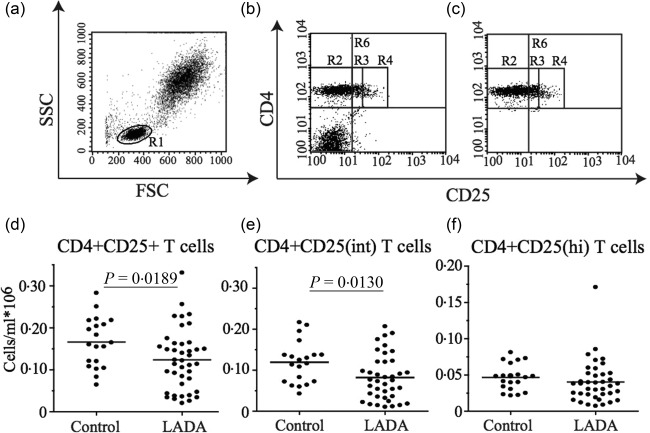
Flow cytometric analysis of T cell populations in whole blood. (a) Gating strategy of the lymphocyte populations. The lymphocyte population (R1) was gated based on its characteristic appearance in forward scatter–side‐scatter (FSC‐SSC). (b) Representative dot‐plots showing the gating for total CD4+CD25+ T cells (R6) and (c) Representative dot‐plots of R6 used to calculate the frequency and total cell numbers of different populations within the CD4+ T cells. The CD4+ T cell population was divided based on the CD25 expression into CD4+CD25– T cells (R2), CD4+CD25int T cells (R3) and CD4+CD25hi T cells (R4). Frequency of total CD4+CD25+ (d), CD4+CD25int (e) and CD4+CD25hi (f) T cells in the 39 of the total 47 LADA patients of which we could performed the analysis on frozen peripheral blood mononuclear cells (PBMC) and healthy control individuals (n = 20). Mean value for each group is indicated with a horizontal line.
Increased expression of FoxP3 in CD4+CD25int T cell LADA patients
Based on the findings of a decrease in frequency and cell number of CD4+CD25int T cells in whole blood of LADA patients we wanted to characterize these cells further by the expression of the transcription factor FoxP3, a more specific Treg marker. To do this, we used frozen PBMC isolated from the same blood sample from 36 of the total 47 LADA patients where enough cells were available and the PBMC passed the quality control. We investigated FoxP3 expression in the CD4+ T cell population, which was divided into three subgroups, CD4+CD25–, CD4+CD25int and CD4+CD25hi T cells (Fig. 2). The percentage of cells expressing FoxP3 was increased in the total CD4+ population of LADA patients compared to controls (P = 0·0002) (Fig. 2a). Furthermore, a significant increase in FoxP3 expression was evident in both the CD4+CD25– (P < 0·0001) (Fig. 2b) and the CD4+CD25int populations (P = 0·0092) (Fig. 2c) of LADA patients. However, the percentage of cells expressing FoxP3 among the CD4+CD25hi T cells was unchanged (Fig. 2d). In addition, when we measured the level of protein expression of FoxP3 and CD25 by calculating the mean fluorescence intensity (MFI) by flow cytometry, we observed a statistically significant increased level of FoxP3 and a significant decrease of CD25 in the CD4+CD25int (P = 0·0012 and P = 0·0023, respectively) and CD4+CD25hi (P = 0·0045 and P = 0·0001, respectively) T cell populations in LADA patients compared to healthy individuals.
Figure 2.
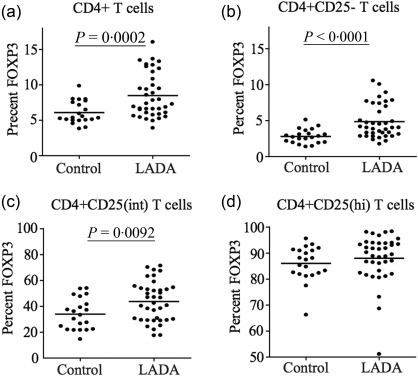
Flow cytometric analysis of forkhead box protein 3 (FoxP3) expression in CD4+ T cells. Percentage of FoxP3 expression in the total CD4+ T cell pool (a), among the CD4+CD25– T cells (b), the CD4+CD25int T cells (c) and the CD4+CD25hi T cells (d) in latent autoimmune diabetes of adults (LADA) patients (n = 38) and healthy control individuals (n = 20). Mean value for each group is indicated with a horizontal line.
Altered expression of activation/memory markers in CD4+ T cells of LADA patients
We next wanted to expand our analysis of CD4+CD25+ cells by investigating the expression of the activation/memory markers CD69, CTLA‐4, CCR4 and CD45RO, known to be expressed constitutively on Tregs and up‐regulated on both Tregs and Teff upon activation. Flow cytometric analysis was performed in 38 (36 for CD69) of the total 47 LADA patients where enough cells were available and the PBMC passed the quality control. There was a statistically significant increase in the percentage of CD4+CD25–CD69+ (P = 0·0105) (Fig. 3a), CD4+CD25intCD69+ (P = 0·0259) (Fig. 3b) and CD4+CD25hiCD69+ T cell populations (P = 0·0016) (Fig. 3c) in LADA patients compared to healthy individuals. LADA patients also had an increased proportion of cells co‐expressing CD69 and FoxP3 in all three T cell populations analysed, CD4+CD25– (P = 0·0048) (Fig. 3d), CD4+CD25int (P < 0·0001) (Fig. 3e) and CD4+CD25hi (P = 0·0001) (Fig. 3f).
Figure 3.
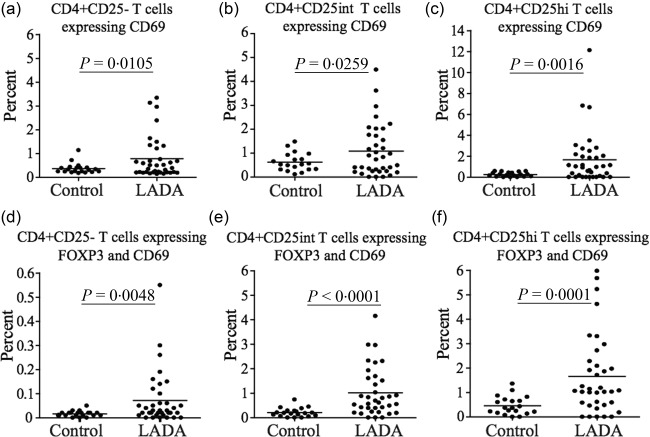
Flow cytometric analysis of CD69 expression in CD4+ T cells. Flow cytometric comparison of CD69 expression in the (a) CD4+CD25–, (b) CD4+CD25int and (c) CD4+CD25hi T cell populations in latent autoimmune diabetes of adults (LADA) patients (n = 36) and healthy control individuals (n = 20). Flow cytometric comparison of the percentage of CD69+FoxP3+ T cells among the (d) CD4+CD25–, (e) CD4+CD25int and (f) CD4+CD25hi T cell populations in LADA (n = 36) and healthy control individuals (n = 20). Mean value for each group is indicated with a horizontal line.
While the percentage of cells expressing CTLA‐4 was increased only in CD4+CD25– T cells (P < 0·0001) (Fig. 4a), the proportion of cells co‐expressing FoxP3 and CTLA‐4 was increased significantly in CD4+CD25– (P < 0·0001) (Fig. 4d), CD4+CD25int (P < 0·0001) (Fig. 4e) and CD4+CD25hi (P = 0·004) (Fig. 4f) in LADA patients compared to controls.
Figure 4.
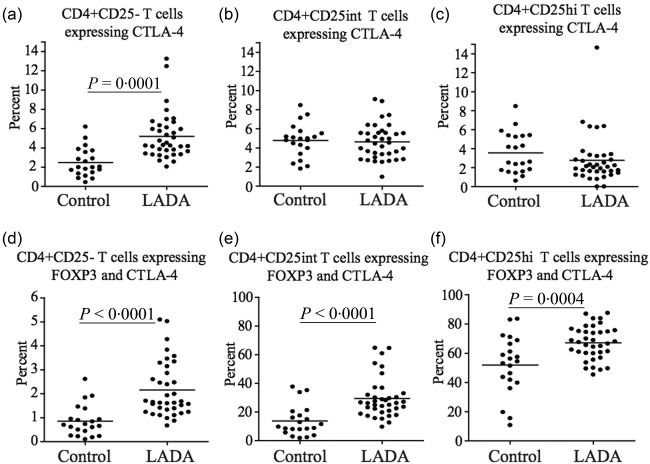
Flow cytometric analysis of cytotoxic T lymphocyte antigen (CTLA)−4 expression in CD4+ T cells. Flow cytometric comparison of CTLA‐4 expression in the (a) CD4+CD25–, (b) CD4+CD25int and (c) CD4+CD25hi T cell populations in latent autoimmune diabetes of adults (LADA) (n = 37) and healthy control individuals (n = 20). Flow cytometric comparison of the percentage of CTLA‐4 forkhead box protein 3 (FoxP3)+ T cells among (d) CD4+CD25–, (e) CD4+CD25int and (f) CD4+CD25hi T cell populations in LADA patients (n = 37) and healthy control individuals (n = 20). Mean value for each group is indicated with a horizontal line.
We next analysed the expression of the chemokine receptor CCR4 and we observed that while the percentage of CD4+CD25+intCCR4+ T cells was decreased in LADA patients (P = 0·0002) (Fig. 5b), the percentage of CCR4+ cells co‐expressing FoxP3 were increased significantly in the CD4+CD25– (P = 0·0001) (Fig. 5a) and CD4+CD25int (P = 0·0098) (Fig. 5b) T cell populations. No significant difference was observed in the CD4+CD25hi population (Fig. 5c).
Figure 5.
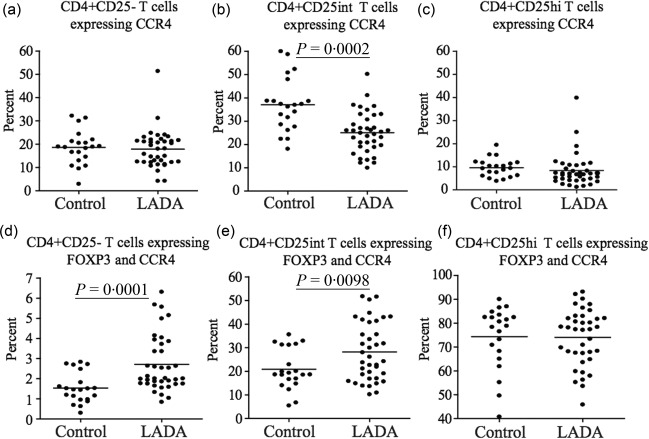
Flow cytometric analysis of CCR4 expression in CD4+ T cells. Flow cytometric comparison of CCR4 expression in the (a) CD4+CD25–, (b) CD4+CD25int and (c) CD4+CD25hi T cell populations in latent autoimmune diabetes of adults (LADA) (n = 38) and healthy control individuals (n = 20). Flow cytometric comparison of the percentage of CCR4+ forkhead box protein 3 (FoxP3)+ T cells among the (d) CD4+CD25–, (e) CD4+CD25int and (f) CD4+CD25hi T cell populations in LADA (n = 38) and healthy control individuals (n = 20). Mean value for each group is indicated with a horizontal line.
Finally, a similar pattern was observed when we analysed the expression of the memory T cell marker CD45RO. The percentage of CD4+CD25–CD45RO+ T cells was increased significantly (P < 0·0004) (Fig. 6a), while in the CD4+CD25+intCD45RO+ T cell population it was decreased significantly (P = 0·0003) (Fig. 6b) in LADA patients compared to healthy subjects. However, the percentage of cells co‐expressing CD45RO and FoxP3 were increased significantly in CD4+CD25– and CD4+CD25int T cells in LADA patients. There was no significant difference in the expression of CD45RO in the CD4+CD25hi population (Fig. 6c).
Figure 6.
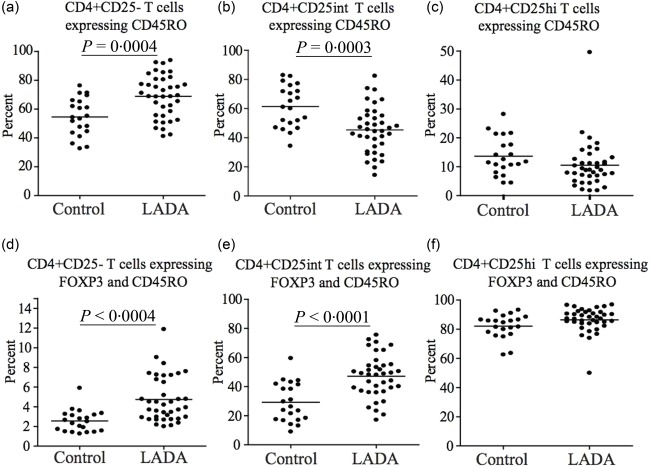
Flow cytometric analysis of CD45RO expression in CD4+ T cells. Flow cytometric comparison of CD45RO expression in the (a) CD4+CD25–, (b) CD4+CD25int and (c) CD4+CD25hi T cell populations in latent autoimmune diabetes of adults (LADA) (n = 38) and healthy control individuals (n = 20). Flow cytometric comparison of the percentage of CD45RO+ forkhead box protein 3 (FoxP3)+ T cells among the (d) CD4+CD25–, (e) CD4+CD25int and (f) CD4+CD25hi T cell populations in LADA (n = 38) and healthy control individuals (n = 20). Mean value for each group is indicated with a horizontal line.
Correlation of T cell phenotypes with metabolic parameters
Statistically significant correlations were observed between the frequency of CD4+CD25hi T cells and C‐peptide, fasting (r = 0·36; P = 0·027) and stimulated (r = 0·46; P = 0·004) while CD4+CD25int T cells correlated significantly only with stimulated C‐peptide (r = 0·38; P = 0·019) (Fig. 7). CD4+CD25hi T cells were correlated negatively with fasting glucose (r = −0·38, P = 0·020). Both the percentage and total number of CD4+CD25int population correlated positively with BMI (kg/m2) (r = 0·55; P< 0·001 and r = 0·50; P = 0·002, respectively).
Figure 7.
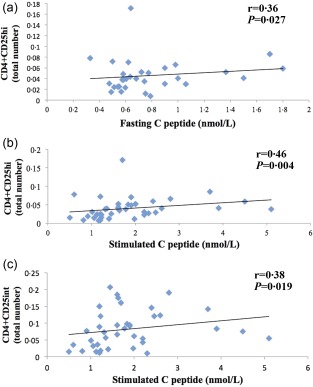
Statistical correlations between CD4+CD25+ T cell populations and C‐peptide in latent autoimmune diabetes of adults (LADA) patients. (a) Correlation between high and CD4+CD25hi T cells and fasting C‐peptide; (b) correlation between CD4+CD25hi T cells and stimulated C‐peptide and (c) correlation between CD4+CD25int T cells and stimulated C‐peptide.
Discussion
The main finding of this study is the difference in the phenotype and frequency of circulating peripheral CD4+CD25+ T cells in LADA patients compared to healthy individuals.
The initial analysis of peripheral T cells showed a significant lower frequency and lower number of total CD4+CD25+ T cells in LADA patients compared to controls, while no differences were found in the frequency and number of both CD4+ and CD8+ T cells (CD3+).
In humans, it has been shown that the population of peripheral blood Tregs with the highest suppressive activity expresses high levels of CD25 27, 28. Thus, we went deeper into the immunophenotypical analysis to characterize these cells more clearly. To this end, we divided the CD4+CD25+ population into CD4+CD25hi and CD4+CD25int fractions based on CD25 expression (Fig. 2). Interestingly, our results do not indicate an alteration in the bulk of the total CD4+CD25hi population in LADA patients. The decrease observed in the total CD4+CD25+ T cells in LADA patients thus appears to be due entirely to a decrease in the CD4+CD25int population. The significance of this finding is not easy to interpret, as little is known about the characteristics and function of peripheral CD4+CD25int T cells. However, it appears that this T cell population is heterogeneous, probably containing recently activated T cells as well as Tregs with low CD25 expression (transition phenotype), and still maintains detectable regulatory function 28. It is tempting to speculate that CD4+CD25int T cells represent, at least in part, an early differentiation stage of peripheral Tregs. Therefore, a significant decrease of these cells might reflect a relative impairment of peripheral tolerance and thus contribute to the chronic autoimmune process leading to beta cell impairment in LADA patients.
The transcription factor FoxP3 has been proved to be essential for Treg development and function 12, 14, and has been considered as a specific marker for CD4+CD25+ Tregs 29. We therefore continued our investigation by analysing the expression of FoxP3 in CD4+CD25+ T cells in LADA patients. Interestingly, the percentage of FoxP3 in the CD4+CD25hi population was no different from that of healthy controls, suggesting that the frequency of highly suppressive Tregs in LADA patients is not affected. However, the percentage of CD4+CD25hi T cells expressing FoxP3 did not account for the amount of the protein expressed by each cell. Thus, to investigate the expression level of FoxP3 protein, we analysed the mean fluorescence intensity (MFI) in CD4+CD25int and CD4+CD25hi T cells. Surprisingly, we observed an increased level of FoxP3 protein expression in both CD4+CD25int and CD4+CD25hi T cells, which is in line with the finding of an increased frequency of cells expressing this marker. Interestingly, the density of the CD25 receptor was decreased in circulating Tregs in LADA patients, indicating a possible impaired IL‐2 signalling and, in turn, potential impairment of suppressive function.
Conversely, the percentage of FoxP3+ cells was increased in both the CD4+CD25– and the CD4+CD25int populations, which supports evidence that FoxP3 is expressed transiently in non‐suppressive CD4+CD25– cells upon activation 22. The observed up‐regulation of FoxP3 in CD4+CD25– and CD4+CD25int cells in our study may therefore be explained by increased activation due to the ongoing autoimmune inflammation in LADA. A specific Teff population, Th17, has been shown recently to be increased proportionally in T1D 31. These cells constitute a proinflammatory IL‐17‐secreting T cell subpopulation within the CD4+CD25int T cells with low expression of FoxP3, and it has been suggested that these cells could be involved directly in the pathogenesis of LADA. In contrast, other studies have demonstrated that cells transiently expressing FoxP3+ within the CD4+CD25– and CD4+CD25int T cell populations possess suppressive functionality. Therefore, another possible scenario is that the increased expression of FoxP3 in CD4+CD25– and CD4+CD25int is a compensatory mechanism with the purpose of down‐modulating autoimmune inflammation in LADA.
Although a previous study also observed a decrease in CD4+CD25+ T cells in LADA patients 16, our results regarding the expression of FoxP3 in CD4+ T cells contradicts earlier studies reporting a decrease in FoxP3 mRNA levels in CD4+ T cells in LADA patients and an alteration of the methylation state of the gene 17. In that study, all the 15 patients studied had less than a year of disease history, and therefore one possible explanation of this discrepancy could be the more heterogeneous LADA cohort in our study.
We continued our investigation by interrogating the activation and memory status of Treg cells using activation and memory markers. Overall, we determined an increase of the activated and memory phenotype in several CD4+ subpopulations. The expression of the early T cell activation marker CD69 was up‐regulated in all CD4+ populations studied, indicating a general T cell activation which can be explained by the autoimmune inflammation 32. However, the functionality of CD69 is still controversial, and has been suggested to be a regulatory function for Th17 T cells 33.
We investigated further the expression of the surface receptor CTLA‐4, which is involved in down‐regulation of T cell activation 34. CTLA‐4 appears important for the functionality of Tregs 35 and has been demonstrated to be involved in the prevention of islet destruction in animal models of autoimmune diabetes and other autoimmune diseases 36. Our results revealed an over‐expression of CTLA‐4 in all CD4+ subpopulations studied, and it is tempting to speculate that this might reflect the chronic immunological response to islet antigens during progression to insulin deficiency in LADA patients. In support of this hypothesis, we also observed an increase in the frequency of CD4+CD25int expressing the CCR4 chemokine receptor and the CD45RO isoform, both markers of activation and antigen experienced Tregs.
Finally, to investigate the possible impact of CD4+CD25hi and CD4+CD25int cell populations on beta cell function, we performed correlations between these cell populations and C‐peptide and glucose levels (fasting and stimulating) as well with age and BMI. We determined a positive correlation of CD4+CD25hi and CD4+CD25int cell levels, suggesting an interesting interplay between glucose metabolism, beta cell function and specific alteration of the regulatory arm of the immune system. It plausible to speculate that the relative frequency of these cells could counteract the inflammatory response in pancreatic islets contributing to maintain insulin secretion and slow the process leading to insulin deficiency in LADA patients.
A weakness in our study is that we could not perform Treg cell functional studies to determine whether the alterations observed in the Treg population also reflect a decreased suppressive function or whether the alterations are a consequence of the ongoing inflammation or the hyperglycaemic status of LADA patients. Hyperglycaemia has been shown to affect the phenotype and function of human T cells 30 and could therefore contribute to the changes in phenotype observed. Indeed, the total number of CD4+CD25hi T cells do not differ significantly between healthy controls, although correlate negatively with fasting glucose levels. Conversely, no statistically significant correlations were found between HbA1c levels, reflecting the chronic hyperglycaemic status, and any of the T cell phenotypes studied.
It important to note that some of the phenotypes showed a large overlap between LADA patients and controls. Although the overall differences are significant, we were not able to demonstrate any particular correlation with other T cell phenotypes or with the metabolic parameters that could explain this individual variability. Further studies in a larger cohort of patients followed prospectively and during clinical trials are necessary to determine whether these T cell signatures might identify subgroups of patients with different progression towards beta cell insufficiency, to evaluate whether defective Treg frequency, phenotype and function contribute to LADA pathogenesis and to determine whether the observed phenotype might represent a reliable cellular biomarkers to monitor tolerance induction during immunomodulatory intervention in LADA patients.
In conclusion, we identified a specific signature of peripheral T cells and circulating potential Tregs in LADA patients that could be of importance in understanding more clearly the immunological pathogenesis of diabetes in LADA patients.
Disclosures
The authors have no disclosures to declare.
Author contributions
This study was designed by C. M. C. and C.‐D. A. C. S., J. A. and M. R. contributed to FACS acquisition and analysis. K. L., Å. S. and M. R. performed the statistical analysis. C. S., J. A. and M. R. collected the data. M. R., C.‐D. A., S. C. and C. M. C. revised and interpreted the results. M. R. and C. M. C. wrote the paper. Å. L. and R. A. H. reviewed and edited the manuscript. All the authors have read and edited the manuscript and approved the version to be published.
Acknowledgements
This work was supported by the Swedish Research Council, Marianne and Marcus Wallenberg Foundation, Swedish Diabetes Foundation, Barndiabetesfonden.
This work is in memory of Professor Carl‐David Agardh.
References
- 1. Redondo MJ. LADA: time for a new definition. Diabetes 2013; 62:339–40. [DOI] [PMC free article] [PubMed] [Google Scholar]
- 2. Nambam B, Aggarwal S, Jain A. Latent autoimmune diabetes in adults: a distinct but heterogeneous clinical entity. World J Diabetes 2010; 1:111–5. [DOI] [PMC free article] [PubMed] [Google Scholar]
- 3. Tuomi T, Groop LC, Zimmet PZ, Rowley MJ, Knowles W, Mackay IR. Antibodies to glutamic acid decarboxylase reveal latent autoimmune diabetes mellitus in adults with a non‐insulin‐dependent onset of disease. Diabetes 1993; 42:359–62. [DOI] [PubMed] [Google Scholar]
- 4. Tuomi T, Carlsson A, Li H et al Clinical and genetic characteristics of type 2 diabetes with and without GAD antibodies. Diabetes 1999; 48:150–7. [DOI] [PubMed] [Google Scholar]
- 5. Zhang Y, Zhou ZG, Yang L, Lin J, Li X, He WM. [Abnormal T cell autoimmunity against GAD65 in LADA patients]. Zhonghua Yi Xue Za Zhi 2010; 90:1963–5. [PubMed] [Google Scholar]
- 6. Brooks‐Worrell BM, Juneja R, Minokadeh A, Greenbaum CJ, Palmer JP. Cellular immune responses to human islet proteins in antibody‐positive type 2 diabetic patients. Diabetes 1999; 48:983–8. [DOI] [PubMed] [Google Scholar]
- 7. Pham MN, Hawa MI, Pfleger C et al Pro‐ and anti‐inflammatory cytokines in latent autoimmune diabetes in adults, type 1 and type 2 diabetes patients: action LADA 4. Diabetologia 2011; 54:1630–8. [DOI] [PubMed] [Google Scholar]
- 8. Akesson C, Uvebrant K, Oderup C et al Altered natural killer (NK) cell frequency and phenotype in latent autoimmune diabetes in adults (LADA) prior to insulin deficiency. Clin Exp Immunol 2010; 161:48–56. [DOI] [PMC free article] [PubMed] [Google Scholar]
- 9. Rodacki M et al Altered natural killer cells in type 1 diabetic patients. Diabetes 2007; 56:177–85. [DOI] [PubMed] [Google Scholar]
- 10. Groop LC, Bottazzo GF, Doniach D. Islet cell antibodies identify latent type I diabetes in patients aged 35‐75 years at diagnosis. Diabetes 1986; 35:237–41. [DOI] [PubMed] [Google Scholar]
- 11. Zimmet PZ, Tuomi T, Mackay IR et al Latent autoimmune diabetes mellitus in adults (LADA): the role of antibodies to glutamic acid decarboxylase in diagnosis and prediction of insulin dependency. Diabet Med 1994; 11:299–303. [DOI] [PubMed] [Google Scholar]
- 12. Sakaguchi S, Miyara M, Costantino CM, Hafler DA. FOXP3+ regulatory T cells in the human immune system. Nat Rev Immunol 2010; 10:490–500. [DOI] [PubMed] [Google Scholar]
- 13. Sakaguchi S, Sakaguchi N, Asano M, Itoh M, Toda M. Immunologic self‐tolerance maintained by activated T cells expressing IL‐2 receptor alpha‐chains (CD25). Breakdown of a single mechanism of self‐tolerance causes various autoimmune diseases. J Immunol 1995; 155:1151–64. [PubMed] [Google Scholar]
- 14. Sakaguchi S, Yamaguchi T, Nomura T, Ono M. Regulatory T cells and immune tolerance. Cell 2008; 133:775–87. [DOI] [PubMed] [Google Scholar]
- 15. Lindley S, Dayan CM, Bishop A, Roep BO, Peakman M, Tree TI. Defective suppressor function in CD4(+)CD25(+) T‐cells from patients with type 1 diabetes. Diabetes 2005; 54:92–9. [DOI] [PubMed] [Google Scholar]
- 16. Yang Z, Zhou Z, Huang G et al The CD4(+) regulatory T‐cells is decreased in adults with latent autoimmune diabetes. Diabetes Res Clin Pract 2007; 76:126–31. [DOI] [PubMed] [Google Scholar]
- 17. Li Y, Zhao M, Hou C et al Abnormal DNA methylation in CD4+ T cells from people with latent autoimmune diabetes in adults. Diabetes Res Clin Pract 2011; 94:242–8. [DOI] [PubMed] [Google Scholar]
- 18. Brusko T, Wasserfall C, McGrail K et al No alterations in the frequency of FOXP3+ regulatory T‐cells in type 1 diabetes. Diabetes 2007; 56:604–12. [DOI] [PubMed] [Google Scholar]
- 19. Brusko TM, Wasserfall CH, Clare‐Salzler MJ, Schatz DA, Atkinson MA. Functional defects and the influence of age on the frequency of CD4+ CD25+ T‐cells in type 1 diabetes. Diabetes 2005; 54:1407–14. [DOI] [PubMed] [Google Scholar]
- 20. Kukreja A, Cost G, Marker J et al Multiple immuno‐regulatory defects in type‐1 diabetes. J Clin Invest 2002; 109:131–40. [DOI] [PMC free article] [PubMed] [Google Scholar]
- 21. Putnam AL, Vendrame F, Dotta F, Gottlieb PA. CD4+CD25high regulatory T cells in human autoimmune diabetes. J Autoimmun 2005; 24:55–62. [DOI] [PubMed] [Google Scholar]
- 22. Wang J, Ioan‐Facsinay A, van der Voort EI, Huizinga TW, Toes RE. Transient expression of FOXP3 in human activated nonregulatory CD4+ T cells. Eur J Immunol 2007; 37:129–38. [DOI] [PubMed] [Google Scholar]
- 23. Mallone R, Mannering SI, Brooks‐Worrell BM, Cilio CM, Wong FS, Schloot NC. Isolation and preservation of peripheral blood mononuclear cells for the analysis of islet antigen‐reactive T‐cell responses: position statement of the T‐cell Workshop Committee of The Immunology of Diabetes Society. Clin Exp Immunol 2010; 162:197–209. [DOI] [PMC free article] [PubMed] [Google Scholar]
- 24. Delli AJ, Vaziri‐Sani F, Lindblad B et al Zinc transporter 8 autoantibodies and their association with SLC30A8 and HLA‐DQ genes differ between immigrant and Swedish patients with newly diagnosed type 1 diabetes in the Better Diabetes Diagnosis study. Diabetes 2012; 61:2556–64. [DOI] [PMC free article] [PubMed] [Google Scholar]
- 25. Grubin CE, Daniels T, Toivola B et al A novel radioligand binding assay to determine diagnostic accuracy of isoform‐specific glutamic acid decarboxylase antibodies in childhood IDDM. Diabetologia 1994; 37:344–50. [DOI] [PubMed] [Google Scholar]
- 26. Mire‐Sluis AR, Gaines Das R, Lernmark A. The World Health Organization International Collaborative Study for islet cell antibodies. Diabetologia 2000; 43:1282–92. [DOI] [PubMed] [Google Scholar]
- 27. Baecher‐Allan C, Brown JA, Freeman GJ, Hafler DA. CD4+CD25high regulatory cells in human peripheral blood. J Immunol 2001; 167:1245–53. [DOI] [PubMed] [Google Scholar]
- 28. Baecher‐Allan C, Wolf E, Hafler DA. Functional analysis of highly defined, FACS‐isolated populations of human regulatory CD4+ CD25+ T cells. Clin Immunol 2005; 115:10–8. [DOI] [PubMed] [Google Scholar]
- 29. Fontenot JD, Gavin MA, Rudensky AY. Foxp3 programs the development and function of CD4+CD25+ regulatory T cells. Nat Immunol 2003; 4:330–6. [DOI] [PubMed] [Google Scholar]
- 30. Marwaha AK, Crome SQ, Panagiotopoulos C et al Cutting edge: increased IL‐17‐secreting T cells in children with new‐onset type 1 diabetes. J Immunol 2010; 185:3814–8. [DOI] [PubMed] [Google Scholar]
- 31. González‐Amaro R, Cortés JR, Sánchez‐Madrid F, Martín P. Is CD69 an effective brake to control inflammatory diseases? Trends Mol Med 2013; 19:625–32. [DOI] [PMC free article] [PubMed] [Google Scholar]
- 32. Martin P, Sanchez‐Madrid F. CD69: an unexpected regulator of TH17 cell‐driven inflammatory responses. Sci Signal 2011; 4:2001825. [DOI] [PubMed] [Google Scholar]
- 33. Egen JG, Kuhns MS, Allison JP. CTLA‐4: new insights into its biological function and use in tumor immunotherapy. Nat Immunol 2002; 3:611–8. [DOI] [PubMed] [Google Scholar]
- 34. Walker LS. Treg and CTLA‐4: two intertwining pathways to immune tolerance. J Autoimmun 2013; 45:49–57. [DOI] [PMC free article] [PubMed] [Google Scholar]
- 35. Chang TT, Kuchroo VK, Sharpe AH. Role of the B7‐CD28/CTLA‐4 pathway in autoimmune disease. Curr Dir Autoimmun 2002; 5:113–30. [DOI] [PubMed] [Google Scholar]
- 36. Stentz FB, Kitabchi AE. Hyperglycemia‐induced activation of human T‐lymphocytes with de novo emergence of insulin receptors and generation of reactive oxygen species. Biochem Biophys Res Commun 2005; 335:491–5. [DOI] [PubMed] [Google Scholar]


