

Abstract
Background: Black adolescents are at increased risk of cardiometabolic disease but have lower fasting triglyceride, which is usually associated with decreased risk. No one has studied racial differences in triglycerides or free fatty acids (FFAs) after a high-fat meal.
Methods: Oral glucose tolerance testing was used to assess insulin secretion, sensitivity, and disposition index (DI). Endothelial function, triglycerides, FFA, c-reactive protein, interleukin 6 (IL6), and adiponectin were measured both pre- and 3 hr postprandially (McDonald's Big Breakfast® and 12 ounce Sprite®) in obese adolescents (10–13 years, 9 black and 7 white). Endothelial function was assessed using reactive hyperemic changes in forearm vascular resistance (FVR).
Results: Oral glucose tolerance test (OGTT) showed no difference in insulin sensitivity, but blacks tended to have (P = 0.08) higher insulin secretion and had increased DI (P = 0.003). After a high-fat meal, triglycerides increased in both groups (P < 0.001), tended to be lower in blacks compared with whites preprandially (64 ± 33 mg/dL vs 110 ± 80, P = 0.064), and was lower postprandially (112 ± 63 vs 188 ± 112, P = 0.039). Pre- and postprandial FFA (Black: 0.58 ± 0.15 and 0.39 ± 0.18 vs. white: 0.44 ± 0.14 and 0.26 ± 0.06, P = 0.020) and adiponectin (P = 0.002) were increased in blacks. FFA decreased in both groups postprandially (P = 0.002). IL6 increased after the meal (P = 0.022). Endothelial function decreased postprandially (P < 0.02), but this was due to a decrease in preocclusion FVR.
Conclusions: These results indicate that differences in fat metabolism are present in both black and white obese adolescents. How these differences explain higher rates of cardiometabolic disease in blacks is unclear.
Introduction
Obesity has become a nationwide epidemic, and consequences of obesity, including cardiovascular and metabolic disease, are the cause of a great deal of both morbidity and mortality. Black Americans are at increased risk of metabolic disease (e.g., type 2 diabetes) and cardiovascular morbidity and mortality compared with their white counterparts.1 However, studies looking at the rates of metabolic syndrome in black and white American adults and adolescents have found varying results.
In the NHANES (1999–2010) study, the prevalence of the metabolic syndrome was significantly lower in non-Hispanic black compared with non-Hispanic white men (16.1% vs. 29.3%), but not women (25.6% vs. 23.5%, respectively).2 In a much smaller study, Lteif et al.3 found no racial difference in adults. In the NHANES study, adolescent blacks tended to have lower rates of metabolic syndrome.4 Weiss et al.5 found that nearly 50% of severely obese white adolescents versus 40% of similar black adolescents met the criteria for metabolic syndrome. The lower percentage was secondary to lower fasting triglyceride values.
The mechanisms for the increased risk of cardiometabolic disease, despite a similar or decreased frequency of the metabolic syndrome in blacks compared with whites, are unclear but may relate to differences in other risk factors and need to be explored early in the developmental process. Black adolescents have been shown to have increased insulin secretion, reduced insulin sensitivity, decreased endothelial function, and lower fasting triglycerides compared with white adolescents.6 Endothelial dysfunction, insulin resistance, and hypertriglyceridemia are early pathophysiologic triumvirates for increased cardiometabolic risk. In whites, hypertriglyceridemia is associated with increased atherosclerosis, myocardial infarction, ischemic heart disease, and death.7 The association of reduced triglycerides with increased cardiometabolic risk in blacks presents a conundrum. Clearly, there is a different mechanism of cardiometabolic risk between these groups. Racial differences in fat reactivity and metabolism, specifically differences in postprandial responses, are potential explanations for the increased cardiometabolic risk in black individuals.
Therefore, we examined changes in endothelial function, triglycerides, free fatty acids (FFAs), glucose, insulin, C-reactive protein (CRP), interleukin 6 (IL6), and adiponectin after a high-fat meal in obese African Americans compared with obese Caucasian adolescents at high risk for future cardiovascular disease. We hypothesized that black adolescents would have greater changes in triglycerides, endothelial function, inflammatory markers, and oxidation compared with their Caucasian counterparts 3 hr after ingestion of a high-fat meal. Relationships between pre- and postprandial measures to endothelial function, insulin sensitivity, and insulin secretion were determined.
Methods
Subjects
Nine obese black adolescents and seven obese non-Hispanic white adolescents were included in this study. There were four men and five women in the black group and five men and two women in the white group. These subjects were recruited from the Ambulatory Care Clinics, Pediatric Endocrinology Clinics, and Center for Healthy Weight and Nutrition at Nationwide Children's Hospital in Columbus, Ohio. Informed consent and assent were obtained from a parent or legal guardian, and assent was obtained from the subject. The study was approved by the Institutional Review Board of Nationwide Children's Hospital.
For inclusion, subjects were 10–15 years old, with body mass index (BMI) ≥95th percentile, ≥Tanner stage 2 pubertal status, and were overall healthy. The only allowable medical diagnoses included mild intermittent asthma and attention deficit hyperactivity disorder (ADHD). Subjects with BMI <95th percentile for age, pregnancy, Tanner 1 pubertal status, blood pressure ≥95th percentile for height and age, medical and/or syndromic obesity (e.g., hypothyroidism, Cushing's syndrome, Prader–Willi), active smoking, diabetes mellitus, hypertension, other chronic medical conditions, and use of any medications except ADHD medications and/or nonsteroidal asthma oral or inhaled medications were excluded from the study.
Protocol
Subjects were seen twice at the Clinical Research Center of the Clinical and Translation Study Center of The Ohio State University. The first visit occurred in the morning after a minimum of 10 hr fasting; a standard oral glucose tolerance test (OGTT) was performed with the purpose of excluding any subjects with previously undiagnosed diabetes mellitus. Baseline blood samples were drawn for plasma glucose and insulin. At the time of baseline testing, a lipid profile, including total cholesterol, VLDL, low-density lipoprotein (LDL), and high-density lipoprotein (HDL), was also obtained. Subjects were then given 1.75 grams/kg of oral glucose (up to a maximum of 75 grams). Blood samples for plasma glucose and insulin were drawn every 30 min for 120 min.
The second visit occurred in the morning after a minimum of 10 hr fasting and occurred at least 1 week later. Subjects were advised to avoid any moderate physical activity for 24 hr before the visit and to maintain an adequate sleep cycle of the same bedtime and waking time for the week before the visit. Moderate physical activity reduces both triglyceride levels and vascular function, and sleep deprivation has other metabolic effects.8,9 Female participants were evaluated during the first week of their menstrual cycle in an attempt to minimize the possible effect of hormonal changes on endothelial function.10,11
Endothelially dependent and independent vasodilation was measured as described later. Baseline blood samples for triglycerides (TG), glucose, insulin, FFAs, CRP, IL6, adiponectin, and soluble intracellular adhesion molecule (SICAM), a marker of endothelial damage, were obtained. The subjects were then given a high-fat meal consisting of a Big Breakfast (classic large size)® from McDonald's® and a 12 ounce Sprite can (940 calories, 52 grams fat, 18 grams saturated fat, 94 grams carbohydrate, 555 mg cholesterol, and 41 grams sugar). Caloric data were provided by McDonald's and The Coca-Cola Company®. Blood sampling and endothelial function measurement were repeated 3 hr after the meal.
The Big Breakfast from McDonald's is similar in fat content to the meal that was used in previous studies to examine the effect of a high-fat meal on endothelial function but has been changed somewhat for ease of food handling procedures.12,13 It was chosen for use in this study, because it is representative of a commonly consumed breakfast by Americans. Three hours later, endothelial function (EF) and non-endothelial function were re-measured and blood samples were repeated. The 3-hr time period was chosen, because the time of the maximal impairment in endothelial function is between 2 and 4 hr and 3 hr is the time at which a significant change in postprandial triglycerides occurs.12,13
OGTT calculations
OGTT was used to assess insulin secretion (SEC), sensitivity (IS), and disposition index (DI). Values were based on the five plasma glucose and insulin levels obtained during the OGTT. IS was calculated using the Matsuda Index [IS = 10,000/√ (fasting glucose × fasting insulin) × (mean glucose × mean insulin)], whereas SEC was calculated as the change in insulin divided by the change in glucose from 0 to 30 min (SEC = ΔI0–30/ΔG0–30).14 DI was calculated by multiplying both these values (DI = IS × SEC).15
Vascular measurements
Endothelial function was assessed using reactive hyperemic changes in forearm vascular resistance (FVR) after 5 min of upper arm vascular occlusion. Forearm blood flow (FBF) was measured with strain gauge venous occlusion plethysmography using a Hokanson A16 plethysmograph. Two minutes of baseline FBF was measured, and then the upper arm cuff was inflated to 200-mmHg pressure for 5 min to occlude flow to the arm. The blood pressure cuff was then released, and FBF was measured again for 1 min. FVR was calculated by dividing mean arterial blood pressure by FBF. Mean arterial blood pressure was measured with an automated sphygmomanometer. This noninvasive method of measuring endothelial function has been shown to correlate with results from endothelial function assessed by intra-arterial acetylcholine infusion.14 After a 20-min rest, subjects were given 0.3 mg sublingual glycerol trinitrate to assess endothelial-independent vasodilation. FBF was assessed 1 min before and 5 min after the drug was given. EF was again measured as described earlier.
Laboratory assays
Glucose, insulin, lipid profile, TG, FFA, and IL6 were run in the core lab through the Clinical Research Center at The Ohio State University. SICAM, CRP, and adiponectin were run by Drs. Huang and Bauer's laboratory. The high-sensitivity C-reactive protein (hsCRP) assay kit was from Biocheck, Inc., Foster City, CA (Cat# BC-1119). Soluble ICAM-1 was from R&D systems, Inc., Minneapolis, MN (Cat#DY720). Adiponectin was also from R&D systems (Cat#1065).
Statistical analysis
Data were analyzed using analysis of variance with repeated measures, Student t-tests, and Pearson correlations using Systat 13 (Systat, Inc., Evanston, IL). Data were log normalized as needed, specifically the DI and triglycerides. Results are presented as mean ± SD.
Results
Demographics and OGTT results
Table 1 shows the demographic characteristics, OGTT, and lipid results of both groups of subjects. There were no racial differences in age, height, weight, or BMI. Results from the OGTT showed no difference in IS, but blacks tended to have higher SEC and had increased DI. The only cholesterol difference was higher HDL levels in the blacks compared with the whites.
Table 1.
Subject Characteristics (Mean ± SD)
| Black | White | P | |
|---|---|---|---|
| Number | 9 | 7 | |
| Age (years) | 12.72 ± 0.99 | 12.85 ± 0.87 | 0.787 |
| Gender | |||
| Female (%) | 5 (56) | 2 (29) | |
| Male (%) | 4 (44) | 5 (71) | |
| Height (cm) | 163.13 ± 7.51 | 160.30 ± 6.62 | 0.444 |
| Weight (kg) | 92.38 ± 23.61 | 86.33 ± 22.44 | 0.612 |
| BMI (kg/m2) | 34.45 ± 7.38 | 33.24 ± 6.39 | 0.737 |
| Insulin sensitivity (IS) | 3.17 ± 2.75 | 1.56 ± 0.5 | 0.152 |
| Insulin secretion (SEC) | 4.41 ± 1.67 | 2.98 ± 1.15 | 0.08 |
| Glucose effectiveness (GE) | 2.52 ± 0.72 | 2.60 ± 0.69 | 0.693 |
| Disposition index (DI = IS × SEC) | 11.63 ± 5.73 | 4.34 ± 1.45 | 0.003* |
| HOMA-IR | 3.895 ± 2.1 | 6.781 ± 2.94 | 0.046 |
| HOMA-β | 2.78 ± 1.22 | 3.28 ± 1.21 | 0.446 |
| Lipids (mg/dL) | |||
| Cholesterol | 148.44 ± 35.77 | 137.17 ± 19.92 | 0.497 |
| LDL | 96 ± 29.38 | 95.17 ± 16.57 | 0.951 |
| HDL | 47.33 ± 11.66 | 32.67 ± 6.06 | 0.015 |
Signifies that the value was determined using log normalized data.
BMI, body mass index; HDL, high-density lipoprotein; HOMA-IR, homeostasis model assessment of insulin resistance; LDL, low-density lipoprotein.
Meal effects
Plasma glucose levels 3 hr after the meal were not different from baseline, whereas plasma insulin levels increased (Table 2). Fasting triglycerides tended to be lower in blacks compared with whites at baseline (P = 0.064) and were significantly lower after the meal (P = 0.039). Triglycerides increased in both groups after the high-fat meal (P < 0.001). FFA levels were higher in blacks both pre- and postprandially compared with whites and significantly decreased in the subjects as a whole after the meal (P = 0.002). Adiponectin did not change postprandially (P = 0.406) but was significantly higher in blacks (P = 0.002). IL6 but not CRP increased postprandially (P = 0.022). There were no racial differences.
Table 2.
Meal Effect on Outcome Measures (Mean ± SD)
| Black | White | P | |||||
|---|---|---|---|---|---|---|---|
| Outcome measure | Pre-Meal | Post-Meal | Pre-Meal | Post-Meal | Race | Meal | Meal × race |
| Glucose (mg/dL) | 86.78 ± 3.11 | 87.44 ± 6.56 | 92 ± 5.54 | 90 ± 8.56 | 0.158 | 0.69 | 0.429 |
| Insulin (μU/mL) | 26.63 ± 23.27 | 48.53 ± 37.35 | 22.56 ± 7.46 | 44.81 ± 14.31 | 0.773 | 0.001 | 0.898 |
| Triglyceride (mg/dL) | 63.67 ± 32.47 | 112.44 ± 62.47 | 109.71 ± 79.91 | 188.43 ± 111.49 | 0.064 | <0.001 | 0.039 |
| IL6 (ng/mL) | 2.14 ± 1.47 | 4.67 ± 3.45 | 1.93 ± 0.94 | 2.59 ± 1.74 | 0.235 | 0.022 | 0.152 |
| CRP (ng/mL) | 2.23 ± 1.98 | 2.24 ± 1.94 | 3.61 ± 2.15 | 3.46 ± 2 | 0.219 | 0.391 | 0.343 |
| FFA (mmol/L) | 0.58 ± 0.15 | 0.39 ± 0.18 | 0.44 ± 0.14 | 0.26 ± 0.06 | 0.02 | 0.002 | 0.864 |
| Adiponectin (ng/mL) | 3919.84 ± 1145.18 | 3854 ± 911.26 | 2188.06 ± 921.17 | 2676.31 ± 286.59 | 0.002 | 0.406 | 0.28 |
| SICAM (ng/mL) | 202.82 ± 58.44 | 205.13 ± 42.97 | 254.97 ± 86.82 | 252.98 ± 84.19 | 0.184 | 0.982 | 0.760 |
CRP, c-reactive protein; FFA, free fatty acid; IL6, interleukin 6; SICAM, soluble intracellular adhesion molecule.
Analysis of variance revealed a significant meal effect (P = 0.02) and meal by occlusion interaction (P = 0.002) on the FVR response to upper arm vascular occlusion (Fig. 1). Planned post hoc comparisons showed that preocclusion FVR was significantly lower after the meal than at baseline (P = 0.007). Postocclusion FVR did not differ between before and after the meal. There were no significant race or meal effects on the response to nitroglycerin.
FIG. 1.

Pre- and postprandial FVR (mean ± SD) responses to occlusion in obese black (solid) and white (hashed) obese adolescents. ANOVA of repeated measures demonstrated significant meal by occlusion interaction (P = 0.002). Specific difference as indicated in preocclusive FVR. ANOVA, analysis of variance; FVR, forearm vascular.
Interrelationships
In all subjects, SEC increased as pre-meal FFA increased (r = 0.733; P = 0.002). This relationship remained present when adjusted for race, and the racial difference in SEC was no longer present when pre-meal FFA was included in the equation (Table 3). Individually, log DI tended to positively correlate with post-meal FFA (r = 0.513; P = 0.051), significantly correlated with pre-meal adiponectin (r = 0.544; P = 0.036), and negatively correlated with CRP both pre- and post-meal (r = −0.65, P = 0.008) (Fig. 2). Similarly, there was a tendency for DI to decrease as pre-meal IL6 increased (r = −0.46, P = 0.083). None of these variables accounted for the racial difference in DI, and the relationships to adiponectin and FFA were no longer significant when race was included in the equation (Table 3). When race and CRP or IL6 were included, DI was significantly related to both.
Table 3.
Predictors of Insulin Secretion (SEC), DI, and Endothelial Function (Postocclusion FVR) in Obese Black and White Adolescents
| Dependent variable | Independent variable | Coefficient | P |
|---|---|---|---|
| SEC | Constant | 0.67 | |
| Race | −0.32 | 0.66 | |
| Pre-meal FFA | 0.68 | 0.012 | |
| Log DI | Constant | 1.44 | |
| Race | −0.40 | 0.011 | |
| Pre-meal FFA | −0.04 | 0.917 | |
| Log DI | Constant | 1.22 | |
| Race | −0.34 | 0.036 | |
| Pre-meal Adiponectin | 3.2 × 10⁻⁵ | 0.57 | |
| Log DI | Constant | 1.43 | |
| Race | −0.30 | 0.011 | |
| Pre-meal CRP | −0.06 | 0.028 | |
| Log DI | Constant | 1.62 | |
| Race | −0.112 | <0.001 | |
| Pre-meal IL6 | −0.40 | 0.009 | |
| Fasting postocclusion FVR | Constant | −3.2 | |
| BMI | 0.17 | 0.22 | |
| Pre-meal insulin | 0.12 | 0.026 | |
| Fasting postocclusion | Constant | −6.2 | |
| FVR | BMI | 0.30 | 0.035 |
| Pre-meal IL6 | 0.44 | 0.15 |
DI, disposition index; FVR, forearm vascular resistance.
FIG. 2.
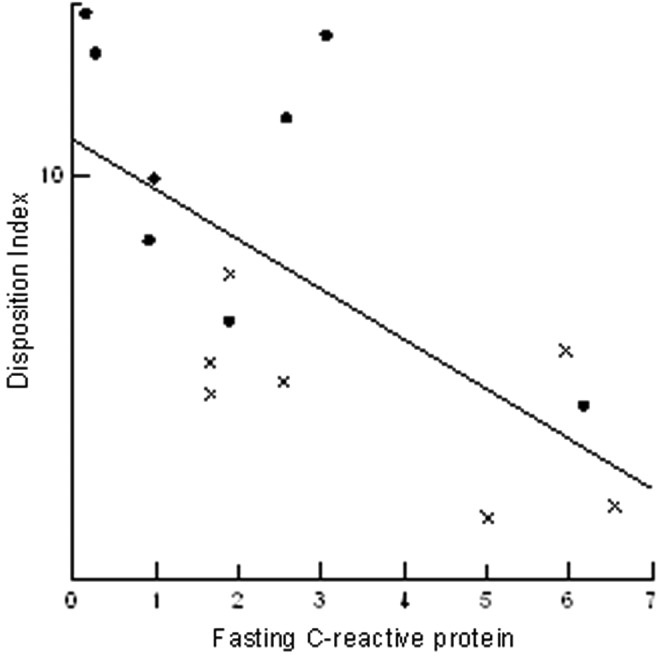
Correlation (r = −0.65, P = 0.008) between disposition index (DI) and C-reactive protein in obese black (circles) and white (x) obese adolescents.
In the fasting state, postocclusion FVR was positively correlated with BMI (r = 0.652, P = 0.012), pre-meal IL6 (r = 0.56; P = 0.037), and pre-meal insulin (r = 0.742; P = 0.002). However, when all variables were included in the regression analysis, only the relationship to pre-meal insulin remained significant (P = 0.031). Pre-meal postocclusion FVR also tended to positively correlate with post-meal IL6 (r = 0.496, P = 0.071). Post-meal postocclusion FVR was positively correlated with post-meal IL6 (r = 0.76; P = 0.002).
Discussion/Conclusions
Childhood obesity has been described as “a new pandemic of the new millennium.”16 Recent studies have shown a nearly fourfold rise in the prevalence of childhood obesity, with 1%–3% being affected by morbid obesity17,18 and obese adolescents have an increased prevalence of metabolic syndrome and increased biomarkers for cardiovascular risk.4,5 Furthermore, many studies have shown a high likelihood of adolescent obesity continuing into adulthood.19,20 Because of this clear evidence that cardiovascular risk begins in adolescents, it is likely that the pathophysiological differences responsible for increased cardiometabolic disease in African Americans begin in adolescence as well.
Adipose tissue secretes various proinflammatory cytokines, including IL-6, adiponectin, and CRP,21,22 that create a proinflammatory, prothrombotic state in obese, insulin-resistant adults, conferring an increased risk of cardiometabolic disease (type 2 diabetes, myocardial infarction, etc.).23,24 It has also been demonstrated that the postprandial state is associated with a further increase in oxidative stress and inflammation.25–29 There is considerable evidence that increased oxidative stress and inflammation cause endothelial dysfunction, a pathophysiologic precursor for increased cardiometabolic disease.30,31 Mauras et al.32 confirmed that obesity in children, as well as adults, is associated with a proinflammatory, prothrombotic state even when adult co-morbidities are not present.
We explored metabolic, vascular, and inflammatory racial differences in response to a high-fat meal and their relationships to differences in lipids, insulin physiology, and endothelial function in obese adolescents. Our goal was to determine whether differences in the metabolic and inflammatory responses to a high-fat meal might explain differences in cardiometabolic risk factors in blacks. As expected, triglyceride levels increased in both groups after the meal but were significantly lower in blacks. In spite of the lower triglyceride levels, blacks had higher FFA both before and after the meal. FFA decreased after the meal. These results clearly demonstrate that differences in lipid metabolism are present between black and white Americans.
A mechanism for the increased FFA in blacks is not readily apparent. It is likely that decreased FFA levels after the meal are due to increased insulin-induced lipolytic suppression, but insulin levels before and after the meal were not different between black and white subjects. Beyond this, blacks had evidence of increased, not decreased, insulin secretion during OGTT. In fact, increased pre-meal FFA was associated with increased insulin secretion in response to OGTT and when FFA levels were accounted for, the tendency for increased SEC in blacks was no longer present. Studies in adult women have demonstrated that FFA oxidation after a high-fat meal increases in white women but not black women, indicating decreased metabolic flexibility in black Americans.33 Differences in mitochondrial metabolic recovery in response to exercise have also been demonstrated between black and white women.34 Further research will be needed to determine whether these differences are responsible for our findings.
We found no racial differences in inflammatory or vascular responses to the meal. IL-6 levels increased in response to meals, demonstrating meal-induced inflammation, although CRP levels did not increase. We found significant evidence for adverse inflammatory effects in the group as a whole. Specifically, increased CRP both pre- and postprandially and increased pre-meal IL6 were associated with lower DI. There were trends toward positive correlations between pre-meal, postocclusion FVR and post-meal IL6 and post-meal; postocclusion FVR was positively correlated with post-meal IL6. These results infer a relationship between endothelial dysfunction and increased inflammation, since increased postocclusion FVR would indicate decreased endothelial-induced vasodilation. These results are not completely conclusive, since multi-linear regression analysis indicated that the main factor responsible for increased pre-meal postocclusive FVR was the pre-meal insulin level. The mechanism for this relationship is not clear.
The occlusive change in FVR was decreased after the meal in both races, but this was primarily due to a decrease in preocclusive FVR. Postocclusive FVR did not change after the meal. The post-meal decrease in preocclusive FVR may be due to increased post-meal insulin levels, since insulin has pronounced vasodilator effects.35 A second possible mechanism could be post-meal hyperglycemia, since hyperglycemia has been shown to have vasodilatory properties independent of increases in insulin36,37 although glucose levels had returned to baseline by the time of the second measurement. It is unknown as to how long the hyperglycemic vasodilator effect lasts. An important side note to these results is that they make it difficult to determine the true meal effect on endothelial function because of the pre-meal vasodilation. If only the change in response to occlusion is reported, there may be a ceiling or floor effect present depending on whether FBF, arterial diameter, or FVR is the primary outcome measure.
Several other differences were also present between black and white subjects. Interestingly, adiponectin, HDL, and DI were all increased in obese black compared with white adolescents. Other studies have also found these differences between black and white subjects.6 These differences, however, clearly do not explain the increased cardiometabolic risk in blacks, since each should be associated with decreased risk.
The small pilot study may not have been large enough to demonstrate subtle, but significant, racial differences in endothelial function, inflammatory markers, and oxidation. Specifically, we did not find reduced endothelial function in obese blacks, as previously reported.3,38,39 We acknowledge that further studies with a larger number of subjects are warranted. This would also allow us to study racial differences in the relationships between the various factors studied. Differences have been reported in both adults and adolescents.3,40 Another potential limitation is that we did not account for each subject's physically activity level before participating in the study. Subjects were only advised to avoid any moderate physical activity for 24 hr before their study visit, as moderate physical activity both reduces triglyceride levels and improves vascular function. Therefore, participant physical activity level could have impacted our results.
Gender differences could have influenced our results. A higher percentage of our white subjects were male (71%), whereas the gender distribution of our black cohort was more even (44% male). There are gender differences in the way metabolic syndrome is expressed (i.e., different metabolic risk markers) and in the way that the different metabolic syndrome combinations are associated with mortality risk.41,42 Key sex differences in the metabolic syndrome include variances in glycemic indices, body fat distribution, adipocyte size and function, hormonal regulation of body weight and adiposity, and the influence of estrogen decline on risk factor clustering.42 Analysis of the NHANES III data by Kuk and Ardern found that the most prevalent metabolic syndrome combination was the clustering of increased triglyceride, low HDL, and hypertension in young men (<65 years of age); whereas it was increased triglyceride, low HDL, and increased waist circumference in young women (<65 years of age).41 No gender differences were found in our study, and inclusion of sex in the analysis did not alter the racial difference in FFAs.
Although no explanation for the increased cardiometabolic risk in black Americans is readily apparent, our results clearly demonstrate that differences in fat metabolism are present between obese black and white adolescents and that being white and having higher inflammatory markers results in a lower DI in obese adolescents. To our knowledge, our study is the first to demonstrate higher FFA in blacks before and in response to a high-fat meal. It is also the first to demonstrate increased inflammatory markers, specifically IL6, after a high-fat meal in obese adolescents. This has been previously described in healthy and obese adults.43,44 There was no racial difference in response.
Further research regarding the mechanisms of the higher FFA levels in obese black adolescents is needed. This should include measurement of VLDL-TG turnover and assessment of contribution of apolipoproteins, subcutaneous and visceral adipose tissues to VLDL-TG production. Further studies are also needed to evaluate the relationship between chronic inflammation and the development of diabetes, the association of reduced triglycerides with increased cardiometabolic risk, and racial differences in fat reactivity/metabolism.
Acknowledgments
The authors would like to thank the staff at the Clinical Research Center at The Ohio State University for their assistance. This study was funded with an Intramural Grant from the Research Institute at Nationwide Children's Hospital. This study was supported by the Clinical Research Center at The Ohio State University, grant UL1-RR05755 from the National Center of Research Resources of the NIH.
Author Disclosure Statement
No competing financial interests exist.
References
- 1.Manhapra A, Canto JG, Vaccarino V, et al. Relation of age and race with hospital death after acute myocardial infarction. Am Heart J 2004;148:92–98 [DOI] [PubMed] [Google Scholar]
- 2.Gurka MJ, Lilly CL, Oliver MN, et al. An examination of sex and racial/ethnic differences in the metabolic syndrome among adults: A confirmatory factor analysis and a resulting continuous severity score. Metabolism 2014;63:218–225 [DOI] [PMC free article] [PubMed] [Google Scholar]
- 3.Lteif AA, Han K, Mather KJ. Obesity, insulin resistance, and the metabolic syndrome: Determinants of endothelial dysfunction in whites and blacks. Circulation. 2005;112:32–38 [DOI] [PubMed] [Google Scholar]
- 4.Ferranti SD, Gauvreau K, Ludwig DS, et al. Prevalence of the metabolic syndrome in American adolescents: Findings from the Third National Health and Nutrition Examination Survey. Circulation 2004;110:2494–2497 [DOI] [PubMed] [Google Scholar]
- 5.Weiss R, Dziura J, Burgert T, et al. Obesity and the metabolic syndrome in children and adolescents. N Engl J Med 2004;350:2362–2374 [DOI] [PubMed] [Google Scholar]
- 6.Hoffman RP. Metabolic syndrome racial differences in adolescents. Curr Diabetes Rev 2009;5:259–265 [DOI] [PubMed] [Google Scholar]
- 7.Nordestgaard BG, Benn M, Schnohr P, et al. Nonfasting triglycerides and risk of myocardial infarction, ischemic heart disease, and death in men and women. JAMA 2007;298:299–308 [DOI] [PubMed] [Google Scholar]
- 8.Gill JM, Al-Mamari A, Ferrell WR, et al. Effects of prior moderate exercise on postprandial metabolism and vascular function in lean and centrally obese men. J Am Coll Cardiol 2004;44:2375–2382 [DOI] [PubMed] [Google Scholar]
- 9.Knutson KL, Spiegel K, Penev P, et al. The metabolic consequences of sleep deprivation. Sleep Med Rev 2007;11:163–178 [DOI] [PMC free article] [PubMed] [Google Scholar]
- 10.Hashimoto M, Akishita M, Eto M, et al. Modulation of endothelium-dependent flow-mediated dilatation of the brachial artery by sex and menstrual cycle. Circulation 1995;92:3431–3435 [DOI] [PubMed] [Google Scholar]
- 11.Williams MR, Westerman RA, Kingwell BA, et al. Variations in endothelial function and arterial compliance during the menstrual cycle. J Clin Endocrinol Metab 2001;86:5389–5395 [DOI] [PubMed] [Google Scholar]
- 12.Blendea MC, Bard M, Sowers JR, et al. High-fat meal impairs vascular compliance in a subgroup of young healthy subjects. Metabolism 2005;54:1337–1344 [DOI] [PubMed] [Google Scholar]
- 13.Vogel RA, Corretti MC, Plotnick GD. Effect of a single high-fat meal on endothelial function in healthy subjects. Am J Cardiol 1997;79:350–354 [DOI] [PubMed] [Google Scholar]
- 14.Higashi Y, Yoshizumi M. New methods to evaluate endothelial function: Method for assessing endothelial function in humans using a strain-gauge plethysmography: Nitric oxide-dependent and independent vasodilation. J Pharmacol Sci 2003;93:399–404 [DOI] [PubMed] [Google Scholar]
- 15.Utzschneider KM, Prigeon RL, Faulenbach MV, et al. Oral disposition index predicts the development of future diabetes above and beyond fasting and 2-h glucose levels. Diabetes Care 2009;32:335–341 [DOI] [PMC free article] [PubMed] [Google Scholar]
- 16.Kimm SY, Obarzanek E. Childhood obesity: A new pandemic of the new millennium. Pediatrics 2002;110:1003–1007 [DOI] [PubMed] [Google Scholar]
- 17.Skinner A, Skelton JA. Prevalence and trends in obesity and severe obesity among children in the United States, 1999–2012. JAMA Pediatr 2014;168:561–566 [DOI] [PubMed] [Google Scholar]
- 18.Claire Wang Y, Gortmaker SL, Taveras EM. Trends and racial/ethnic disparities in severe obesity among US children and adolescents, 1976–2006. Int J Pediatr Obes 2011;6:12–20 [DOI] [PubMed] [Google Scholar]
- 19.Whitaker RC, Wright JA, Pepe MS, et al. Predicting obesity in young adulthood from childhood and parental obesity. N Engl J Med 1997;337:869–873 [DOI] [PubMed] [Google Scholar]
- 20.The NS, Suchindran C, North KE, et al. Association of adolescent obesity with risk of severe obesity in adulthood. JAMA 2010;304:2042–2047 [DOI] [PMC free article] [PubMed] [Google Scholar]
- 21.Guerre-Millo M. Adipose tissue and adipokines: For better or worse. Diabetes Metab 2004;30:13–19 [DOI] [PubMed] [Google Scholar]
- 22.Calabro P, Chang DW, Willerson JT, et al. Release of C-reactive protein in response to inflammatory cytokines by human adipocytes: Linking obesity to vascular inflammation. J Am Coll Cardiol 2005; 46:1112–1113 [DOI] [PubMed] [Google Scholar]
- 23.Danesh J, Wheeler JG, Hirschfield GM, et al. C-reactive protein and other circulating markings of inflammation in the prediction of coronary heart disease. N Eng J Med 2004; 350:1387–1397 [DOI] [PubMed] [Google Scholar]
- 24.Ridker PM, Stampfer MJ, Rifai N. Novel risk factors for systemic atherosclerosis: A comparison of c-reactive protein, fibrinogen, homocysteine, lipoprotein (a), and standard cholesterol screening as predictors of peripheral artery disease. JAMA 2001; 285:2481–2485 [DOI] [PubMed] [Google Scholar]
- 25.Nicholls SJ, Lundman P, Harmer JA, et al. Consumption of saturated fat impairs the anti-inflammatory properties of high-density lipoproteins and endothelial function. J Am Coll Cardiol 2006; 48:715–720 [DOI] [PubMed] [Google Scholar]
- 26.Tushuizen ME, Nieuwland R, Scheffer PG, et al. Two consecutive high-fat meals affect endothelial-dependent vasodilation, oxidative stress and cellular microparticles in healthy men. J Thromb Haemost 2006; 4: 1003–1010 [DOI] [PubMed] [Google Scholar]
- 27.Anderson RA, Evans LM, Ellis GR, et al. The relationship between post-prandial lipaemia, endothelial function and oxidative stress in healthy individuals and patients with type 2 diabetes. Atherosclerosis 2001; 154: 475–483 [DOI] [PubMed] [Google Scholar]
- 28.Bae JH, Bassenge E, Kim KB, et al. Postprandial hypertriglyceridemia impairs endothelial function by enhanced oxidant stress. Atherosclerosis 2001;155:517–523 [DOI] [PubMed] [Google Scholar]
- 29.Ceriello A, Taboga C, Tonutti L, et al. Evidence for an independent and cumulative effect of postprandial hypertriglyceridemia and hyperglycemia on endothelial dysfunction and oxidative stress generation: Effects of short- and long-term simvastatin treatment. Circulation 2002;106:1211–1218 [DOI] [PubMed] [Google Scholar]
- 30.Cai H, Harrison DG. Endothelial dysfunction in cardiovascular diseases: The role of oxidant stress. Circ Res 2000;87:840–844 [DOI] [PubMed] [Google Scholar]
- 31.Libby P, Ridker P, Maseri A. Inflammation and atherosclerosis. Circulation 2002;105:1135–1143 [DOI] [PubMed] [Google Scholar]
- 32.Mauras N, Delgiorno C, Kollman C, et al. Obesity without established comorbidities of the metabolic syndrome is associated with a proinflammatory and prothrombotic state, even before the onset of puberty in children. J Clin Endocrinol Metab 2010;95:1060–1068 [DOI] [PubMed] [Google Scholar]
- 33.Berk ES, Kovera AJ, Boozer CN, et al. Metabolic inflexibility in substrate use is present in African-American but not Caucasian healthy, premenopausal, nondiabetic women. J Clin Endocrinol Metab 2006;91:4099–4106 [DOI] [PMC free article] [PubMed] [Google Scholar]
- 34.Sirikul B, Gower BA, Hunter GR, et al. Relationship between insulin sensitivity and in vivo mitochondrial function in skeletal muscle. Am J Physiol Endocrinol Metab 2006;291:E724–E728 [DOI] [PubMed] [Google Scholar]
- 35.Anderson EA, Hoffman RP, Balon TW, et al. Hyperinsulinemia produces both sympathetic neural activation and vasodilation in normal humans J Clin Invest 1991;87:2246–2252 [DOI] [PMC free article] [PubMed] [Google Scholar]
- 36.Dye AS, Huang H, Bauer JA, et al. Hyperglycemia Increases Muscle Blood Flow and Alters Endothelial Function in Adolescents with type 1 diabetes. Exp Diabetes Res 2012;2012:9. [DOI] [PMC free article] [PubMed] [Google Scholar]
- 37.Hoffman RP, Hausberg M, Sinkey CA, et al. Hyperglycemia without hyperinsulinemia produces both sympathetic neural activation and vasodilation in normal humans. J Diabetes Complications 1999;13:17–22 [DOI] [PubMed] [Google Scholar]
- 38.Duck MM, Hoffman RP. Impaired endothelial function in healthy African-American adolescents compared to Caucasians. J Pediatr 2007;150:400–406 [DOI] [PMC free article] [PubMed] [Google Scholar]
- 39.Hoffman RP. Effect of adolescent obesity on cardiometabolic risk in African-Americans and Caucasians. ISRN Obes 2012;2012:603205. [DOI] [PMC free article] [PubMed] [Google Scholar]
- 40.Hoffman RP. Increased fasting triglyceride levels are associated with hepatic insulin resistance in Caucasian but not African-American adolescents. Diabetes Care 2006;29:1402–1404 [DOI] [PubMed] [Google Scholar]
- 41.Kuk JL, Ardern Cl. Age and sex differences in the clustering of metabolic syndrome factors: Association with mortality risk. Diabetes Care 2010;33:2457–2461 [DOI] [PMC free article] [PubMed] [Google Scholar]
- 42.Pradhan AD. Sex differences in the metabolic syndrome: Implications for cardiovascular health in women. Clin Chem 2014;60:44–52 [DOI] [PubMed] [Google Scholar]
- 43.Gregersen S1, Samocha-Bonet D, Heilbronn LK, et al. Inflammatory and oxidative stress responses to high-carbohydrate and high-fat meals in healthy humans. J Nutr Metab 2012;2012:238056. [DOI] [PMC free article] [PubMed] [Google Scholar]
- 44.Miglio C1, Peluso I, Raguzzini A, et al. Antioxidant and inflammatory response following high-fat meal consumption in overweight subjects. Eur J Nutr 2013;52:1107–1114 [DOI] [PubMed] [Google Scholar]