

Abstract
The cellular adaptive immune system mounts a response to many solid tumors mediated by tumor infiltrating T lymphocytes (TILs). Basic measurements of these TILs, including total count, show promise as prognostic markers for a variety of cancers, including ovarian and colorectal. In addition, recent therapeutic advances are thought to exploit this immune response to effectively fight melanoma with promising studies showing efficacy in additional cancers. However, many of the basic properties of TILs are poorly understood including specificity, clonality, and spatial heterogeneity of the T cell response. We utilize deep sequencing of rearranged T-cell receptor beta (TCRB) genes to characterize the basic properties of TILs in ovarian carcinoma. Due to somatic rearrangement during T cell development, the TCR beta chain sequence serves as a molecular tag for each T cell clone. Using these sequence tags, we assess similarities and differences between infiltrating T cells in discretely sampled sections of large tumors and compare to T cells from peripheral blood. Within the limits of sensitivity of our assay, the TIL repertoires show strong similarity throughout each tumor and are distinct from the circulating T cell repertoire. We conclude that the cellular adaptive immune response within ovarian carcinomas is spatially homogeneous and distinct from the T cell compartment of peripheral blood.
Keywords: T cells, High-throughput sequencing, Tumor-infiltrating lympohcytes (TILs), Tumor heterogeneity, Ovarian carcinoma
INTRODUCTION
The adaptive immune response to tumors is re-emerging as both a promising prognostic marker [1] and diagnostic target for multiple cancers [2]. In colorectal cancer the presence, abundance, and population types of Tumor Infiltrating Lymphocytes (TILs) is reported to be a better measure of prognosis than traditional methods [3]. In addition, ipilimumab is an immunotherapy agent that up-regulates the immune response by globally stimulating T lymphocytes and is the first therapy developed in the last 40 years that has proven to extend overall survival in a subset of metastatic melanoma patients with an enhanced immune response [4, 5]. These emerging cancer therapeutics, including immunomodulators like ipilimumab and adoptive T-cell therapy, highlight the need to better understand and monitor TILs.
The correlation between TILs and cancer prognosis is well established for several types of cancer, including ovarian, lung, colorectal, and melanoma [1]. The data are especially strong for ovarian cancers; over the last decade multiple independent studies indicate that the presence and quantity of intraepithelial TILs are strongly correlated with Disease Free Survival (DFS) and Overall Survival (OS) [6]. Additionally, ovarian tumors can be quite large at time of surgery making these tumors a good model in which to study spatial variability in the antigen receptor repertoire of TILs. While technologies that define and quantify types of T cells help to clarify how population-level measurements of effector, helper, and regulatory T cells correlate with clinical outcomes [1, 6–8], there are only minimal data addressing whether these TIL populations are spatially restricted to the tumor microenvironment (i.e. distinct from the circulating T cell repertoire). To address this issue we apply high-throughput sequencing to quantify the antigen receptor repertoire within ovarian carcinomas, as well as matched peripheral blood samples.
Another potential complication in measuring the immune response to tumors is the possibility for a spatially heterogeneous mixture of infiltrating lymphocytes; a given tumor can include cells with multiple genotypes and sensitivity to therapies at distinct locations [9–11]. This heterogeneity is likely driven by intra-tumor competition and selection by both the host's immune response to the tumor and cancer therapeutics [12, 13]. These factors could cause data collected from any given tumor biopsy to be unrepresentative of the tumor as a whole. However, clinical development of TILs requires that relevant measurements be reproducible across the spatial extent of a tumor so that the exact location of a tissue sample does not affect test results. To address tumor heterogeneity we systematically measure the antigen receptor repertoire of multiple tumor biopsies collected from primary and/or metastatic ovarian tumors from five patients.
To capture the antigen receptor repertoire of lymphocytes infiltrating ovarian tumors, we performed deep sequencing of T-cell receptor β (TCRB) Complimentary Determining Region 3 (CDR3) chains. To generate an αβ T cell receptor repertoire with sufficient diversity to recognize the universe of potential pathogens, αβ T lymphocytes acquire a nearly-unique CDR3 nucleotide sequence through a process that involves rearrangement of germline DNA [14]. We used a multiplex PCR approach to amplify the TCRB CDR3 regions followed by high-throughput sequencing to interrogate hundreds of thousands of receptor sequences [15]. For this project we sequenced the immune repertoire of multiple tumor punch biopsies from each patient as well as peripheral blood. With these data we tested 1) if the intratumoral TCRB repertoire is distinct from that of peripheral blood 2) if the intratumoral TCRB repertoire is spatially homogenous.
METHODS
Patients and Sample Preparation
Patient enrollment and specimen collection was performed by the Pacific Ovarian Cancer Research Consortium (POCRC) with approval from the Fred Hutchinson Cancer Research Center's (FHCRC) Institutional Review Board (FHCRC IR file numbers #4771 and #4563). Our study included tissue and blood specimens collected from five patients diagnosed with stage III/IV ovarian carcinoma at the time of primary tumor debulking surgery. The initial diagnosis was made intrasurgically by the on-call pathologist. The debulking surgeries and tissue collections took place at the Swedish Medical Center – First Hill Campus (Seattle, WA). POCRC's research pathologist confirmed the diagnosis of late-stage, high-grade serous ovarian cancer. None of these patients had received prior chemotherapy.
Table 1 provides a summary of the precise numbers and types of samples collected from each patient. Tumor tissue was collected from the primary ovarian tumor and/or metastatic tumor in the omentum, when present, with the guidance of the on-call pathologist. Longitudinal slices, approximately one centimeter in width, were taken from the middle of the resected tumor tissue (Figure 1A). When possible for the primary tumors, up to three serial slices were taken and labeled slice B, C and D, where slice C represents the middle slice. A single slice was taken from metastatic tumor (slice A). Each tumor slice was laid onto a sterile surface and 1.5 cm tumor punches were taken from throughout the slice in a gridded pattern where the punches were spaced 2 cm apart. Four punches were also taken around the periphery on the tumor slice at 12, 3, 6 and 9 o'clock (Figure 1B). Each punch was then divided into thirds, with the outer two thirds being snap-frozen in foil on dry ice and the inner third being put into formalin for paraffin embedding.
Table 1. Summary of tissue sample collection.
The number and type of tissue samples acquired for each of the five patients investigated.
| Patient | # Tumor samples | # Metastasis samples | PBMC? | Total Samples |
|---|---|---|---|---|
| 1 | 1 | 9 | No | 10 |
| 2 | 22 | 0 | Yes | 23 |
| 3 | 1 | 21 | Yes | 23 |
| 4 | 8 | 14 | Yes | 23 |
| 5 | 8 | 5 | Yes | 14 |
| 40 | 49 | 4 | 93 |
Figure 1. Schematic of sample collection.

(A) After debulking, a one centimeter slice was taken from the center of the primary and metastatic tumor along the longest diameter. These middle slices were designated Slice A from the metastasis and Slice C from the primary tumor. Additional 1-cm slices from either side of the middle slice were taken when possible from the primary tumor (slices B and D). (B) These slices were aligned with a grid allowing for up to 25 biopsy punches to be taken from each slice with a 2-cm spacing from the center of one punch to the center of the adjacent punch. Additionally, four punches were taken around the periphery of the tumor slice at 12, 3, 6 and 9 o'clock (punches 26, 27, 28 and 29). A peripheral blood sample was also collected from which mononuclear cells were isolated.
Blood was also drawn at the time of surgery into K2EDTA tubes prior to anesthesia. Within 16 hours of the draw, blood was centifuged at 1,300g for 15 min at 4°C. The buffy coat was removed and peripheral blood mononuclear cells (PBMCs) isolated by the following protocol. RPMI 1640 cell culture media was added to the buffy coat to a final volume of 10 mL and layered on top of 5 mL of Lymphocyte Separation Medium (LSM) (Sigma Aldrich) and spun at 400g for 40 min at room temperature. The layer of mononuclear cells was collected and washed twice with RPMI 1640 media (10 mL – spun at 300g for 10 min), resuspending the pellet each time. After aspirating off the final wash, the cell pellet was resuspended in 1 mL of chilled “Freeze Media” (RMPI 1640 with 15% fetal calf serum and 10% DMSO), transferred to a cryovial and frozen at −80°C. DNA was extracted from the frozen tissue and PBMCs using GenFIND DNA (Agencourt) extraction kits following manufacturer's instructions.
Droplet Digital PCR
For precise measurement of the quantity of TILs as a fraction of total cells in the tumor, we use the QX100 droplet digital PCR system from Biorad. Using 45V and 13J primers as in the ImmunoSEQ assay, we designed 35 V region probes within the amplicon. Taken together, every V segment is bound by one of the 35 probes. To measure total cells, a separate color probe was designed to a housekeeping gene, RNase P. The ratio of digital droplets with T cell amplicons divided by the RNase P amplicons (including a correction factor to account for two RNase P alleles per cell), gives an accurate TIL count.
High-throughput sequencing
For each sample, TCRB CDR3 regions were amplified and sequenced from 2 ug of genomic DNA, or if there was less than 2 ug, all available extracted DNA. Amplification and sequencing of TCRB CDR3 regions was carried out using the ImmunoSEQ platform at Adaptive Biotechnologies [15]. The TCRB CDR3 regions were identified within the sequencing reads according to the definition established by the International ImMunoGeneTics (IMGT) collaboration [16]. Sequencing reads that did not match the canonical structure of CDR3 sequences were removed from the analysis. A standard algorithm was used to identify which V, D, and J segments contributed to each TCRB CDR3 sequence [16].
CDR3 Sequence Analysis
To assess similarity of TCRB repertoires between samples both within tumors and between tumor and other tissue types, we used the metric of TCRB repertoire overlap. For two samples, a and b, we identified the n TCRB CDR3 sequences present in both samples, along with the sequencing read counts C of each sequence in each sample. TCRB repertoire overlap between samples is defined as the sum of the sequencing reads from shared TCRB sequences divided by the total number of sequencing reads observed in both samples, and ranges from 0 to 1:
To transform this overlap metric into a distance metric, we calculate:
which transforms the TCRB repertoire overlap to be higher for less related TCRB repertoires and to range from 0 to infinity. This calculation roughly corresponds to the number of sequencing reads required (in excess of one) to expect one read from a TCRB rearrangement shared between the two samples. For clustering analysis, TCRB repertoire distance was used to construct a neighbor-joining tree using MEGA5 software [17, 18]; the resulting trees were visualized using Dendroscope 3 [19].
RESULTS
Droplet digital PCR of tumor infiltrating lymphocytes in ovarian tumors
Table 1 summarizes the samples collected from each of the five patients. To assess the heterogeneity of TIL levels within and between patient samples, we employed a droplet digital PCR technique to count the proportion of cells with rearranged TCR loci in each sample. Levels of T cell infiltration are quite distinct between the five tumors studied (Figure 2), ranging from an average of 0.24% T cells in patient 5 to an average of 14% T cells in patient 3. Only two tumors, those from patients 1 and 2, had similar levels of T cell infiltration (7.6% and 7.4% T cells, respectively). Each of the other 9 unique pairs of tumors has significantly different level of T cell infiltration as determined by a two-tailed T-test (p < 0.01 in each case), indicating that the level of T cell infiltration is a distinguishing characteristic of each ovarian tumor.
Figure 2. T cell infiltration in five ovarian carcinomas.
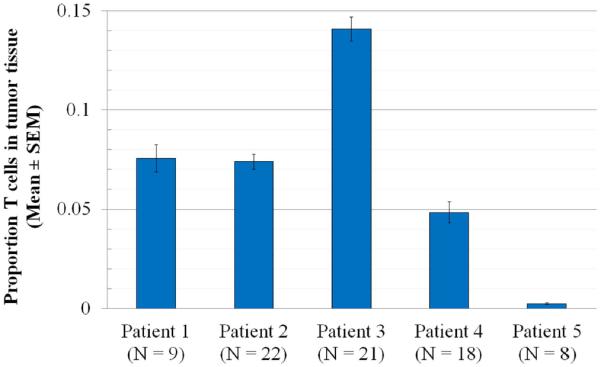
We used a droplet digital PCR assay to determine the level of T cell infiltration in patient samples. Among tumor tissue samples from the major site of each patient's malignancy (primary tumor in patients 2 and 5; metastatic tumor in patients 1, 3 and 4), we calculated the proportion of T cells for each patient among nucleated cells (mean ± SEM; N= the number of different tissue cores examined for each patient). With the exception of patients 1 and 2, whose tumors have very similar T cell numbers, each pair of tumors has significantly different level of T cell infiltration (n = 9 pairwise comparisons, p < 0.01 by two-tailed T test in each case).
High-throughput sequencing of tumor infiltrating lymphocytes in ovarian tumors
To assess the heterogeneity of the intratumoral immune response, we used multiplex PCR to amplify TCRB CDR3 regions and then used high-throughput sequencing to sequence receptor sequences, a method we have used previously [15]. We produced, on average, 2.65 million sequence reads, distributed among an average of 13,000 unique TCRB CDR3 rearrangements for each tissue sample from four patients (Table 1). In tumor samples from the fifth patient, we observed an average of only 300 unique TCRB rearrangements, indicating a homogenous but very limited T cell response to the tumor. Additionally, the metastatic samples from this patient were located in a lymph node, making it impossible to isolate the intratumoral immune repertoire from the T cell repertoire of the lymph node. Due to these issues, patient 5 was excluded from further analyses of the intratumoral T cell repertoire.
In order to assess the distinctness and spatial heterogeneity of the intratumoral T cell repertoire, we identified TCRB rearrangements that were shared between different tumor punches, and between tumor punches and peripheral blood. These shared rearrangements were used to calculate the TCRB repertoire overlap between each pairwise combination of samples (see Methods). This metric was used to determine that tumor samples showed much more repertoire overlap with each other than with blood, and that the intratumoral TCRB repertoire is homogeneous over the mass of a tumor, since adjacent tumor punches have no more TCRB overlap than punches from opposite ends of the tumor. Full results for each sample can be found in the Supplemental Data.
We find for all patients that the TCRB repertoire overlap within primary tumors or metastases is higher than between tumor and blood. Figure 3 exemplifies the TCRB repertoire overlap of intra-tumor comparisons against tumor/blood comparisons by summarizing the results for patient 3. We present the TCRB repertoire overlap between the central punch (Punch 13) of the major (metastatic) tumor site and other samples taken from this patient, including the other metastatic tumor punches as well as single samples of peripheral blood and primary tumor. TCRB overlap between the central punch and adjacent punches is uniformly high among samples from the major metastatic tumor site, with values ranging from (0.63 – 0.75). TCRB repertoire overlap between the central tumor punch and the primary tumor sample is lower (0.57), and much lower in peripheral blood (0.19). Among punches from the metastatic site, there is no apparent relation between distance from the central punch and TCRB repertoire overlap with the central punch (R2 = 0.014). These data strongly suggest that the intra-tumor TCRB repertoire is not spatially structured within the tumor and is distinct from the TCRB repertoire of peripheral blood.
Figure 3. TCRB repertoire overlap across a large metastatic tumor slice.

We calculated TCRB repertoire overlap between the central punch (13) of a large tumor slice from patient 3 and all other samples from the same patient, including one peripheral blood sample and one primary tumor sample. The spatial organization of the metastatic tumor punches is shown and each sample is colored according to its degree of TCRB repertoire overlap with the central punch. Other punches from the metastatic tumor in this patient share high TCRB repertoire overlap (0.75), with no obvious relationship between TCRB repertoire overlap and distance from the center punch (R2 = 0.014). TCRB repertoire overlap is somewhat lower in the primary tumor punch (0.57), and considerably lower in peripheral blood (0.19). All comparisons are marked on the color scale at bottom. Quartile ranges are shown for the metastatic punches.
Spatial heterogeneity within a single large tumor
TCRB repertoire overlap among metastatic tumor samples from patient 3 was high, but well below 100% (Figure 3). However, some difference in the observed TCRB repertoire is expected between samples even when drawn from the same underlying TCRB repertoire due to the noise inherent in sampling randomly from a diverse population. To assess the contribution of sequencing error and sampling noise introduced by our PCR and sequencing approach relative to genuine spatial TCRB repertoire variability, we identified that we had enough gDNA to perform duplicate PCR reactions in several of the samples from patient 4. When performing replicate PCR reactions from the same pool of gDNA, the only effects expected to influence our TCRB overlap metric are technical error and sampling noise (i.e. sampling from a diverse repertoire of T cells in which many clones are present at low levels produces different gDNA input when amplified in duplicate). At the extreme, each TCRB rearrangement present once in the original sample must assort to one of two PCR replicates and cannot contribute to TCRB repertoire overlap between them. In addition, when comparing samples from a different location within a tumor mass this noise is compounded by spatial heterogeneity. All of these effects would tend to reduce TCRB overlap. The four tissue samples were amplified and sequenced in duplicate and we compared the mean TCRB overlap of within-sample comparisons (n = 4) to that of between-sample comparisons (n = 24) (Figure 4). TCRB overlaps within and between tissue samples were nearly identical (p = 0.81), indicating that after controlling for the effects of technical error and for the effects of sampling a diverse repertoire, the influence of spatial heterogeneity on TCRB repertoire overlap between several tissue samples from a large tumor is negligible.
Figure 4. Within and between-sample TCRB repertoire overlap and variability.
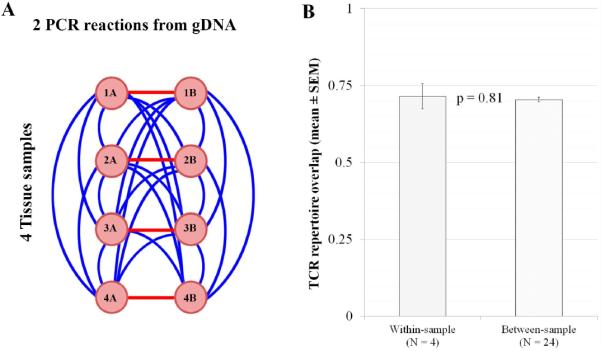
A) Genomic DNA from four tissue punches from a metastatic tumor (patient 4) was extracted and PCR and sequencing reactions were performed in duplicate for each sample. Measurements were made to calculate the within-tissue sample comparison (red lines, n = 4; which should be influenced only by technical error and TCRB repertoire sampling error) and between-tissue sample comparisons (blue lines, n = 24; which should be affected by technical error, sampling error and spatial heterogeneity). B) TCRB repertoire overlap between each pair of samples was calculated, and we compared the mean TCRB repertoire overlap (+/− Standard Error of the Mean) of within-sample and between-sample comparisons. A p-value was calculated using a two-tailed unpaired t-test. Duplicate samples do not have systematically higher TCRB repertoire overlap, indicating that TCRB repertoire overlap values are primarily influenced by technical and sampling error rather than spatial location within the tumor.
TCRB repertoire overlap within and between tumor and blood samples
To investigate the distinctness and homogeneity of the intratumoral immune response in each of the four patients, we transformed the pairwise TCRB overlap metric into a distance metric. This transformation of overlap scores to distances (see Methods) allows us to calculate the number of sequences that would need to be read, on average, before expecting to observe one TCRB rearrangement that is shared between two samples. These distances were used to cluster samples from each patient using the neighbor-joining algorithm, producing four dendrograms (Figure 5).
Figure 5. Clustering analysis of TCRB repertoire overlaps among patients.
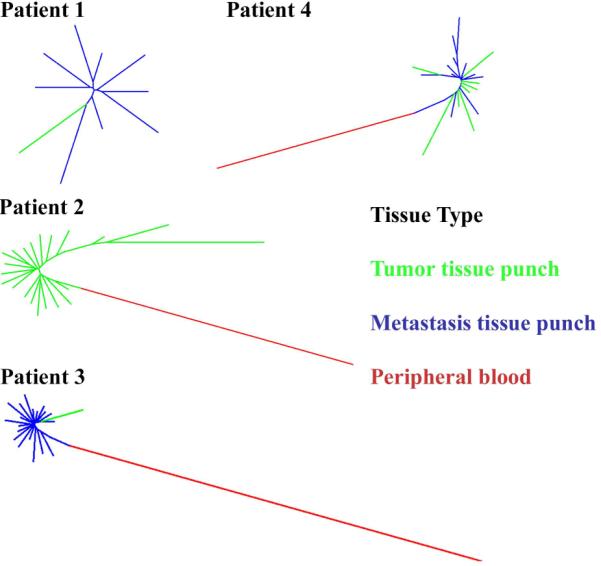
For each of four patients we calculated pairwise distances among all tissue samples using TCRB repertoire overlap to create a distance metric (see Methods). These distances were used to construct a neighbor-joining tree for each patient. Trees are color-coded by tissue source: primary tumor (green); metastatic tumor (blue); peripheral blood (red). The lack of substantial branching structure (i.e., star phylogeny) observed among tumor samples from all patients indicates spatial homogeneity among tumor samples, while the larger distance between tumor and blood samples indicates that tumor samples share considerably more TCRB sequences with each other than with peripheral blood.
The most obvious overall feature of the dendrograms is that peripheral blood is very distant from tumor samples. This result is not due to low sequencing coverage, given that the peripheral blood produced an average of 25 million sequencing reads and 89,000 unique TCRB rearrangements. This indicates that the intratumoral TCRB repertoire is quite distinct from that circulating in the blood and therefore represents a population of T cells spatially restricted to the tumor microenvironment rather than simply a subset of circulating T cells. Because our data show that TILs are associated with a distinct set of T cell clonal lineages, we further examined the tumor samples for signs of spatial heterogeneity by examining the morphology of the tumor sample clustering. Different clustering patterns are expected in the case of spatial heterogeneity (substantial branching structure based on physical proximity of the punches) and homogeneity (a star phylogeny reflecting random noise in the measurement of TCRB overlap) (examples shown in Figure S1). In all four patients, tumor samples cluster into a star phylogeny, which indicates no substantial spatial structure in the intratumoral TCRB repertoire. In the one patient for which multiple punches were available from primary and metastatic tumor sites (patient 4), primary and metastatic samples cluster together with no discernible pattern, indicating that the T cell response to the primary and metastatic tumor sites is essentially identical in this patient, possibly indicating recruitment of tumor-associated T cell clones to the metastatic site.
DISCUSSION
In this study we demonstrate that TCRB repertoire sequencing provides a targeted approach to measure the intratumoral immune response. To collect this data we sliced large ovarian tumors lengthwise and overlaid a grid to systematically sample punch biopsies and measure the TCRB repertoire at each site. Our assay for amplifying and sequencing the rearranged TCRB locus from the infiltrating T lymphocytes provided a unique sequence for each clone, and allowed us to analyze the exact cellular immune infiltrate in different biopsies, and compare to peripheral blood. We found that the T cell response within ovarian carcinoma tumors is primarily homogeneous across the spatial extent of these large tumors (Figures 3 and 5). Additionally, peripheral blood samples showed TCRB repertoires quite distinct from the tumor tissue. Furthermore, we investigated one large tumor and found that essentially all variance in intratumoral TCRB repertoire between tumor samples could be explained by the noise inherent in sampling a diverse repertoire rather than by spatial heterogeneity (Figure 4). Although we do not have the technology to simultaneously identify TCR sequences and functional markers for T cell subtypes at high throughput, our finding that the same clones (as determined by CDR3 sequence) are at nearly identical proportions of the T cell repertoire at positions 1.5cm away in the same tumor, strongly suggests that T cell phenotypes are also spatially homogeneous.
This finding of a distinct, spatially homogeneous T cell repertoire within ovarian tumors has multiple implications. Recent work has proven the genotype of tumor cells is highly heterogeneous for some tumor types [9, 20] and this variation can contribute to individual tumor cells having different responses to therapy [10–12, 20–23]. However, we find that the T cell repertoire is homogenous and that a single biopsy of ovarian tumor (or a metastasis) should therefore provide sufficient information to characterize the intratumoral T cell population within an entire tumor.
It has been postulated that biomarkers could be developed to capture TIL response for both cancer prognosis and prediction of therapeutic response. Simple counts of TILs have been shown to positively correlate with long term survival of late stage ovarian cancer patients [1, 6, 24–27]. We have previously shown that TCR sequencing can be applied to study TILs in colon cancer [28], and concurrently an expanded effort is underway to incorporate TIL data to improve the staging guidelines for colorectal cancer [29]. Furthermore, many groups are testing different types of TIL measurements as predictive biomarkers for response to immunotherapeutics [30, 31]. We find that the immune response to ovarian tumors is distinct from the circulating immune repertoire. While we find some overlap between tumor and blood, most tumor TCRs were observed only in tumor tissue. This suggests that the intratumoral microenvironment is characterized by a distinct but internally homogeneous T cell repertoire that could potentially be manipulated through the development of immunotherapeutics. Specifically, since most T cell clones observed in tumors are homogeneously distributed but confined to tumor tissue, it is reasonable to assume that any subset of intratumoral T cell clones specifically targeting tumor antigens are likewise restricted to tumor tissue but broadly distributed within the tumor.
In conclusion, recent work in tumor immunology has highlighted the need for simple, quantitative and reproducible measures of the host anti-tumor immune response to improve both prognosis (i.e. tumor staging that includes immunological considerations) and to predict patient response to immunotherapy (e.g. [5, 29, 32]). Sequencing and ddPCR-based methods are standardizable, requiring minimal human involvement. A major barrier to clinical assessment of the predictive power of these quantitative methods has been the suggestion that the intratumoral immune repertoire is inconsistent and so cannot be measured meaningfully with a single tissue sample. In this study we have demonstrated that quantitation of both intratumoral T cell infiltration and the clonal structure comprising the intratumoral T cell repertoire can be accomplished in a manner that is consistent across the spatial extent of five large ovarian carcinomas. The ability to quantitatively assess tumor infiltrating lymphocytes using a single tissue sample will be essential in the assessment of TCR sequencing as a potential prognostic and predictive biomarker in solid tumors.
Supplementary Material
Cluster analysis of illustrative example datasets. A) Neighbor-joining tree constructed from 25 samples, arranged in a 5 × 5 grid as per our tumor punches in this study, using physical distance as a distance metric. Substantial branching structure is observed, based on higher similarity between nearby samples. B) Neighbor-joining tree constructed from 25 samples, with the distance between each pair of samples calculated as 1 / (0.5 + 0.5 * rand()), which simulates a dataset in which all samples have substantial relatedness with an overlay of random noise. A star phylogeny is observed, with all samples nearly equidistant.
Acknowledgments
Sources of Funding Listwin Family Foundation (JHB & HSR); Pacific Ovarian Cancer Research Consortium SPORE (NIH P50 CA083636); Department of Defense Ovarian Cancer Idea Award (MT; OC093221); Canary Foundation (MT); Ellison Medical Foundation New Scholar Award (JHB & HSR)
Footnotes
Author Contributions Designed and conceived the experiments: CSC, CWD, MT, JHB, HSR; Contributed samples: JG, CWD, MT; Performed the research: AMS, MJR, CSC, JHB; Analyzed the data: ROE, DWW, HSR; Wrote the paper: ROE, AMS, JG, HSR.
Conflict of Interest Disclosure CSC and HSR have consultancy, patents & royalties and equity ownership with Adaptive Biotechnologies. ROE, AMS, MJR and DWW have employment and equity ownership with Adaptive Biotechnologies.
Supplemental Data: Full results of our TCRB repertoire overlap calculation, between each pair of samples analyzed in the study.
REFERENCES
- 1.Gooden MJ, de Bock GH, Leffers N, et al. The prognostic influence of tumour-infiltrating lymphocytes in cancer: a systematic review with meta-analysis. British journal of cancer. 2011 doi: 10.1038/bjc.2011.189. [DOI] [PMC free article] [PubMed] [Google Scholar]
- 2.de la Cruz-Merino L, Grande-Pulido E, Albero-Tamarit A, et al. Cancer and immune response: old and new evidence for future challenges. The oncologist. 2008;13:1246–1254. doi: 10.1634/theoncologist.2008-0166. [DOI] [PubMed] [Google Scholar]
- 3.Mlecnik B, Bindea G, Pages F, et al. Tumor immunosurveillance in human cancers. Cancer metastasis reviews. 2011;30:5–12. doi: 10.1007/s10555-011-9270-7. [DOI] [PMC free article] [PubMed] [Google Scholar]
- 4.Mansh M. Ipilimumab and Cancer Immunotherapy: A New Hope for Advanced Stage Melanoma. Yale Journal of Biology and Medicine. 2011;84:381–389. [PMC free article] [PubMed] [Google Scholar]
- 5.Ascierto PA, Capone M, Urba WJ, et al. The additional facet of immunoscore: immunoprofiling as a possible predictive tool for cancer treatment. J Transl Med. 2013;11:54. doi: 10.1186/1479-5876-11-54. [DOI] [PMC free article] [PubMed] [Google Scholar]
- 6.Hwang WT, Adams SF, Tahirovic E, et al. Gynecologic oncology. 2011. Prognostic significance of tumor-infiltrating T cells in ovarian cancer: A meta-analysis. [DOI] [PMC free article] [PubMed] [Google Scholar]
- 7.Oble DA, Loewe R, Yu P, et al. Focus on TILs: Prognostic significance of tumor infiltrating lymphocytes in human melanoma. Cancer Immunity. 2009;9:3. [PMC free article] [PubMed] [Google Scholar]
- 8.Yamada N, Oizumi S, Kikuchi E, et al. CD8+ tumor-infiltrating lymphocytes predict favorable prognosis in malignant pleural mesothelioma after resection. Cancer immunology, immunotherapy : CII. 2010;59:1543–1549. doi: 10.1007/s00262-010-0881-6. [DOI] [PMC free article] [PubMed] [Google Scholar]
- 9.Gerlinger M, Rowan AJ, Horswell S, et al. Intratumor heterogeneity and branched evolution revealed by multiregion sequencing. N Engl J Med. 2012;366:883–892. doi: 10.1056/NEJMoa1113205. [DOI] [PMC free article] [PubMed] [Google Scholar]
- 10.Lee AJ, Endesfelder D, Rowan AJ, et al. Chromosomal instability confers intrinsic multidrug resistance. Cancer Res. 2011;71:1858–1870. doi: 10.1158/0008-5472.CAN-10-3604. [DOI] [PMC free article] [PubMed] [Google Scholar]
- 11.Maheswaran S, Sequist LV, Nagrath S, et al. Detection of mutations in EGFR in circulating lung-cancer cells. N Engl J Med. 2008;359:366–377. doi: 10.1056/NEJMoa0800668. [DOI] [PMC free article] [PubMed] [Google Scholar]
- 12.Gerlinger M, Swanton C. How Darwinian models inform therapeutic failure initiated by clonal heterogeneity in cancer medicine. Br J Cancer. 2010;103:1139–1143. doi: 10.1038/sj.bjc.6605912. [DOI] [PMC free article] [PubMed] [Google Scholar]
- 13.Aktipis CA, Nesse RM. Evolutionary foundations for cancer biology. Evolutionary applications. 2013;6:144–159. doi: 10.1111/eva.12034. [DOI] [PMC free article] [PubMed] [Google Scholar]
- 14.Davis MM, Bjorkman PJ. T-cell antigen receptor genes and T-cell recognition. Nature. 1988;334 doi: 10.1038/334395a0. [DOI] [PubMed] [Google Scholar]
- 15.Robins HS, Campregher PV, Srivastava SK, et al. Comprehensive assessment of T-cell receptor beta-chain diversity in alphabeta T cells. Blood. 2009;114:4099–4107. doi: 10.1182/blood-2009-04-217604. [DOI] [PMC free article] [PubMed] [Google Scholar]
- 16.Yousfi Monod M, Giudicelli V, Chaume D, et al. IMGT/JunctionAnalysis: the first tool for the analysis of the immunoglobulin and T cell receptor complex V-J and V-D-J JUNCTIONs. Bioinformatics. 2004;20(Suppl 1):i379–385. doi: 10.1093/bioinformatics/bth945. [DOI] [PubMed] [Google Scholar]
- 17.Saitou N, Nei M. The neighbor-joining method: a new method for reconstructing phylogenetic trees. Mol Biol Evol. 1987;4:406–425. doi: 10.1093/oxfordjournals.molbev.a040454. [DOI] [PubMed] [Google Scholar]
- 18.Tamura K, Peterson D, Peterson N, et al. MEGA5: molecular evolutionary genetics analysis using maximum likelihood, evolutionary distance, and maximum parsimony methods. Mol Biol Evol. 2011;28:2731–2739. doi: 10.1093/molbev/msr121. [DOI] [PMC free article] [PubMed] [Google Scholar]
- 19.Huson DH, Scornavacca C. Dendroscope 3: an interactive tool for rooted phylogenetic trees and networks. Syst Biol. 2012;61:1061–1067. doi: 10.1093/sysbio/sys062. [DOI] [PubMed] [Google Scholar]
- 20.Fisher R, Pusztai L, Swanton C. Cancer heterogeneity: implications for targeted therapeutics. Br J Cancer. 2013;108:479–485. doi: 10.1038/bjc.2012.581. [DOI] [PMC free article] [PubMed] [Google Scholar]
- 21.Gorre ME, Mohammed M, Ellwood K, et al. Clinical resistance to STI-571 cancer therapy caused by BCR-ABL gene mutation or amplification. Science. 2001;293:876–880. doi: 10.1126/science.1062538. [DOI] [PubMed] [Google Scholar]
- 22.Inukai M, Toyooka S, Ito S, et al. Presence of epidermal growth factor receptor gene T790M mutation as a minor clone in non-small cell lung cancer. Cancer Res. 2006;66:7854–7858. doi: 10.1158/0008-5472.CAN-06-1951. [DOI] [PubMed] [Google Scholar]
- 23.Shah NP, Nicoll JM, Nagar B, et al. Multiple BCR-ABL kinase domain mutations confer polyclonal resistance to the tyrosine kinase inhibitor imatinib (STI571) in chronic phase and blast crisis chronic myeloid leukemia. Cancer Cell. 2002;2:117–125. doi: 10.1016/s1535-6108(02)00096-x. [DOI] [PubMed] [Google Scholar]
- 24.Clarke B, Tinker AV, Lee CH, et al. Intraepithelial T cells and prognosis in ovarian carcinoma: novel associations with stage, tumor type, and BRCA1 loss. Modern pathology : an official journal of the United States and Canadian Academy of Pathology, Inc. 2009;22:393–402. doi: 10.1038/modpathol.2008.191. [DOI] [PubMed] [Google Scholar]
- 25.Gavalas NG, Karadimou A, Dimopoulos MA, et al. Immune response in ovarian cancer: how is the immune system involved in prognosis and therapy: potential for treatment utilization. Clinical & developmental immunology. 2010;2010:791603. doi: 10.1155/2010/791603. [DOI] [PMC free article] [PubMed] [Google Scholar]
- 26.Sato E, Olson SH, Ahn J, et al. Intraepithelial CD8+ tumor-infiltrating lymphocytes and a high CD8+/regulatory T cell ratio are associated with favorable prognosis in ovarian cancer. Proceedings of the National Academy of Sciences of the United States of America. 2005;102:18538–18543. doi: 10.1073/pnas.0509182102. [DOI] [PMC free article] [PubMed] [Google Scholar]
- 27.Zhang L, Conejo-Garcia JR, Katsaros D, et al. Intratumoral T cells, recurrence, and survival in epithelial ovarian cancer. The New England Journal of Medicine. 2005;348:203–213. doi: 10.1056/NEJMoa020177. [DOI] [PubMed] [Google Scholar]
- 28.Sherwood AM, Emerson RO, Scherer D, et al. Cancer Immunol Immunother. 2013. Tumor-infiltrating lymphocytes in colorectal tumors display a diversity of T cell receptor sequences that differ from the T cells in adjacent mucosal tissue. [DOI] [PMC free article] [PubMed] [Google Scholar]
- 29.Galon J, Pages F, Marincola FM, et al. The immune score as a new possible approach for the classification of cancer. J Transl Med. 2012;10:1. doi: 10.1186/1479-5876-10-1. [DOI] [PMC free article] [PubMed] [Google Scholar]
- 30.Ascierto PA, Kalos M, Schaer DA, et al. Biomarkers for immunostimulatory monoclonal antibodies in combination strategies for melanoma and other tumor types. Clin Cancer Res. 2013;19:1009–1020. doi: 10.1158/1078-0432.CCR-12-2982. [DOI] [PubMed] [Google Scholar]
- 31.Liu C, Peng W, Xu C, et al. BRAF inhibition increases tumor infiltration by T cells and enhances the antitumor activity of adoptive immunotherapy in mice. Clin Cancer Res. 2013;19:393–403. doi: 10.1158/1078-0432.CCR-12-1626. [DOI] [PMC free article] [PubMed] [Google Scholar]
- 32.Galon J, Angell HK, Bedognetti D, et al. The continuum of cancer immunosurveillance: prognostic, predictive, and mechanistic signatures. Immunity. 2013;39:11–26. doi: 10.1016/j.immuni.2013.07.008. [DOI] [PubMed] [Google Scholar]
Associated Data
This section collects any data citations, data availability statements, or supplementary materials included in this article.
Supplementary Materials
Cluster analysis of illustrative example datasets. A) Neighbor-joining tree constructed from 25 samples, arranged in a 5 × 5 grid as per our tumor punches in this study, using physical distance as a distance metric. Substantial branching structure is observed, based on higher similarity between nearby samples. B) Neighbor-joining tree constructed from 25 samples, with the distance between each pair of samples calculated as 1 / (0.5 + 0.5 * rand()), which simulates a dataset in which all samples have substantial relatedness with an overlay of random noise. A star phylogeny is observed, with all samples nearly equidistant.