

Summary
Hsp90 belongs to a family of some of the most highly expressed heat shock proteins that function as molecular chaperones to protect the proteome not only from the heat shock, but from other misfolding events. As many client proteins of Hsp90 are involved in oncogenesis, this chaperone has been in focus of intense research efforts. Yet, we lack structural information for how Hsp90 interacts with co-chaperones and client proteins. Here, we develop a mass spectrometry based approach that allows quantitative measurements of in vitro and in vivo effects of small molecule inhibitors on Hsp90 conformation, and interaction with co-chaperones and client proteins. From this analysis we were able to derive structural models for how Hsp90 engages its interaction partners in vivo and how different drugs affect these structures. Additionally, the methodology described here offers a new approach to probe the effects of virtually any inhibitor treatment on the proteome level.
eTOC Blurb
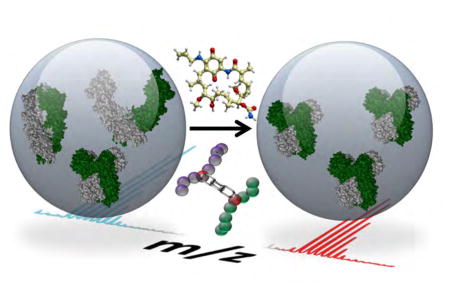
Hsp90 functions to maintain cellular homeostasis. Chavez et al. identified in vivo changes to Hsp90 conformations and interactions upon cellular treatment with Hsp90 inhibitors using quantitative cross-linking with mass spectrometry. Conformational changes were found to be drug and isoform specific.
Introduction
The cytosolic heat shock protein Hsp90 exists as two isoforms, the inducible isoform Hsp90-alpha (HS90A) and the constitutively expressed Hsp90-beta (HS90B). Hsp90 functions together with multiple co-chaperones to maintain the integrity of a wide variety of client proteins and is essential for cellular homeostasis and viability (Li and Buchner, 2013; Sreedhar et al., 2004; Taipale et al., 2010). Modulation of Hsp90 function exhibits therapeutic potential for cancer and other diseases including cystic fibrosis, viral infections and neurodegenerative diseases (Brandt and Blagg, 2009; Mayer et al., 2009; Taipale et al., 2010). Structurally, Hsp90 proteins consist of three ordered domains, the N-terminal domain (NTD), middle domain (MD) and C-terminal domain (CTD), connected by flexible linker regions. The flexible linkers facilitate interactions between domains necessary for conformational rearrangement during the chaperone cycle (Jahn et al., 2014). Hsp90 conformation is influenced by multiple factors, including ATP binding, as well as interactions with co-chaperones, client proteins, and small molecules (Krukenberg et al., 2011; Li et al., 2012; Mayer et al., 2009). The majority of Hsp90 inhibitors target the ATP binding pocket located in NTD, although a smaller subset of inhibitors targeting the CTD is also available (Khandelwal et al., 2016). Specific binding sites for most inhibitors are known, and what is also appreciated is the fact that inhibitor binding in one domain can cause allosteric conformational changes throughout the other domains (Donnelly and Blagg, 2008; Krukenberg et al., 2011). Nevertheless, details of how this happens and what specific structural changes occur in full length (FL) Hsp90 upon inhibitor treatment are still missing. Advancement in understanding of structure-function relationships in Hsp90 has been hampered by its conformational flexibility and difficulty in obtaining high-resolution structural information on FL protein, especially for human Hsp90 isoforms. Furthermore, most biophysical studies on Hsp90 to date have been carried out in vitro where conditions used may perturb the natural equilibrium of populated conformers. For Hsp90, the conformation, activity and affinity for NTD inhibitors is dependent on the presence of multiple interaction partners and a crowded molecular environment (Halpin et al., 2016). In fact, Hsp90 interactions within cells are cell type-dependent (Kamal et al., 2003). Thus, new techniques that can provide information on Hsp90 structural dynamics in vivo are needed to help answer more physiologically relevant questions about how Hsp90 engages its co-chaperones and clients, what conformations it samples in vivo, and how small molecule inhibitors impact both the Hsp90 interactome and its flexibility.
Chemical cross-linking with mass spectrometry (XL-MS) is an emerging structural biology technique that provides information on the molecular structure of proteins and protein complexes by using chemical probes that report on proximity of the two residues that react with the probes, typically lysines (Leitner et al., 2016). Information gained through XL-MS studies is often complimentary to more traditional structural biology methods such as X-ray crystallography, NMR, and cryo-electron microscopy. In addition to finding utility in resolving protein complex structures in purified protein systems, XL-MS has been successfully employed to study protein structures and interactions in extremely complex biological samples including cell lysates (Liu et al., 2015) and intact living cells (Chavez et al., 2013; Weisbrod et al., 2013a).
Quantitative XL-MS (qXL-MS) combines XL-MS with quantitative proteomics studies to provide information on changes in protein conformations and interactions due to various conditions or perturbations (Walzthoeni et al., 2015). Previously we developed a qXL-MS approach, combining Protein Interaction Reporter (PIR) technology (Tang and Bruce, 2010) with SILAC, to compare a multi-drug resistant cancer cell phenotype with the drug sensitive parental cell line (Chavez et al., 2015). Here, we extend these methods and apply qXL-MS to monitor large scale protein structural and interaction changes exhibited by Hsp90 in cells upon inhibitor treatment. We use three well-known Hsp90 inhibitors, 17-N-allylamino-17-demethoxygeldanamycin (17-AAG), XL-888 and Novobiocin at varying concentrations and demonstrate that the technique allows quantification of cross-linked peptide pairs either by MS1 based or targeted MS2 (parallel reaction monitoring, PRM) based methods. Our results provide structural insight into the in vivo conformational dynamics of Hsp90 upon inhibitor treatment, and help map dynamic interactions between Hsp90 domains, differential Hsp90 homo and hetero-dimer formation, and co-chaperone and client interactions. The results demonstrate that compact Hsp90 conformations, which have not been observed in human cells before, result specifically when cells are treated with NTD Hsp90 inhibitors. A compact Hsp90 state has been proposed to potentially represent a transition state (Mayer and Le Breton, 2015) and our observations offer direct insights into the mechanism of catalytic ATP-hydrolysis critical for function. In addition, our findings reveal that the CTD inhibitor, novobiocin, exhibits isoform specific effects, as novobiocin treatment leads to the loss of HS90B homodimer but not HS90A homodimer. Current critical challenges for effective Hsp90 cancer therapies involve developing small molecules that inhibit Hsp90 but do not lead to induction of HS90A, and other heat shock response elements. Therefore, this isoform-specific observation and the ability to quantify isoform specific Hsp90 conformational changes provide critical insight needed for future Hsp90 inhibitor development efforts (Garcia-Carbonero et al., 2013; Khandelwal et al., 2016; Sreedhar et al., 2004). Finally, our work lays out a generally applicable strategy for applying qXL-MS to study changes to protein structures and interactions as a result of small molecule inhibitor treatment in cells. PIR molecules are peptide-based and can be synthesized and obtained through many commercial sources. The PRM methods used here are general and can be applied in any mass spectrometry laboratory with modern mass spectrometry technologies, making this type of analysis feasible even in core labs.
Results and Discussion
Quantitative cross-linking approach to study Hsp90 inhibition in cells
Using a qXL-MS approach (Chavez et al., 2015) we developed a workflow to study conformational changes induced in Hsp90 due to inhibitor treatment in live cells (Fig. 1). In this approach, cells are cultured in isotopically light and heavy SILAC media followed by treatment with various concentrations of Hsp90 inhibitors or a vehicle control. After inhibitor treatment, cells are harvested and subjected to in vivo PIR cross-linking (Fig. 1B). Cells are then lysed and the cross-linked protein is extracted and enzymatically digested with trypsin, after which PIR cross-linked peptides are enriched using a combination of SCX and avidin affinity chromatography. Samples enriched for cross-linked peptides are analyzed by LC-MS utilizing a real-time adaptive method (ReACT)(Weisbrod et al., 2013a), which specifically targets PIR cross-linked peptides (Fig. 1C). Upon identification of the cross-linked peptides, signal from the light and heavy isotope partners is extracted and used for relative quantification.
Figure 1. Experimental flow chart.

(A) Cells are cultured in isotopically light/heavy SILAC media. Cells were treated with either varying concentrations of Hsp90 inhibitor, or a vehicle control. (B) 1. PIR cross-linker is applied to a 1:1 mixture of cells. 2. Cell lysis and cross-linked peptide enrichment (strong cation exchange and avidin affinity chromatography). (C) 1. LC-MS analysis by ReACT to identify cross-linked peptide pairs. 2. MS1 based quantification of the light/heavy cross-linked peptides carried out on the ReACT acquired data. 3. Selected cross-linked peptides analyzed by targeted PRM. (D) 1. The resulting data is compiled into a quantitative interaction network (Fig. 2) with edges as quantified cross-linked peptide pairs and nodes as relative protein levels from global SILAC measurements. 2. Quantitative measurements on cross-linked peptides of interest were tracked with inhibitor concentration. 3. Cross-links are analyzed in context of existing PDB structures or homology generated models. Appropriate models are selected to reveal inhibitor induced conformational changes. Cartoon representations of protein conformations that either decrease (green in heat map), increase (red in heat map) or do not change (black in heat map) with increasing inhibitor concentration are shown.
Alternatively, previously identified cross-linked peptides can be targeted with PRM analysis for quantitative measurements across many experimental conditions. The resulting dataset contains quantitative information on both intra-protein and inter-protein cross-linked peptides and can be displayed as a quantitative interaction network (Fig. 1D). Changes in levels of intra-protein cross-linked peptides indicate conformational changes of a protein, while changes in inter-protein cross-linked peptides can indicate conformational changes to a protein complex and/or protein interaction level changes. Cross-linked peptides whose levels correlate with the concentration of inhibitor used can be focused on to glean insight into inhibitor induced changes to protein structures and interactions.
17-AAG treatment shifts the equilibrium between Hsp90 conformers
Structurally, Hsp90 accommodates multiple conformations during the chaperone cycle, which includes protein loading, ATP binding and hydrolysis, co-chaperone binding, and client protein release(Jahn et al., 2014). In vitro based evidence suggests that Hsp90 exists as an ensemble of conformers in dynamic equilibrium, influenced by interactions with nucleotides and proteins (Mayer et al., 2009; Shiau et al., 2006; Southworth and Agard, 2008). ATP hydrolysis drives conformational rearrangement of Hsp90 necessary for its chaperone function and many Hsp90 inhibitors, including 17-AAG, competitively bind to the ATP pocket (Jego et al., 2013). We know from previous studies that binding of the NTD inhibitors, such as 17-AAG, leads to closing of the L2 loop region in the substrate binding pocket, and additional evidence suggests more widespread conformational changes throughout the molecule occur (Phillips et al., 2007), but we lack a more detailed picture of what happens in the context of the FL human Hsp90.
Our qXL-MS approach applied on HeLa cells, with and without 17-AAG treatment, led to the identification of 3323 cross-linked peptide pairs originating from 893 proteins, including 135 cross-links involving Hsp90 (Table S1). Of the 3323 total cross-linked peptides, 2582 were quantified between cells with and without 17-AAG treatment. The direct impact of cellular 17-AAG treatment (500 nM) on Hsp90 conformation was apparent from the qXL-MS data as illustrated in Fig. 2A–E. Our in vivo data support conclusions drawn from previous structural analysis showing that an analog of 17-AAG, geldanamycin, induces a NTD conformational shift of the L2 loop region leading to a change in the orientation of K112, which flips nearly 180° bringing it into proximity of K58 (Fig. 2A; PDBs: 1YET, 1YER)(Stebbins et al., 1997). Strikingly, this conformational change is observable by quantitative measurements of the cross-link between residues K58 and K112 of HS90A for both forward and reverse SILAC extracted ion chromatograms in Fig 2B.
Figure 2. Structural changes to Hsp90 upon 17-AAG treatment.

(A) Crystal structures of the NTD of HS90A with geldanamycin bound in the ATP binding pocket (PDB 1YET, blue ribbon) and in the apo form (PDB 1YER, grey ribbon)(Stebbins et al., 1997). Observed cross-linked residues K58–K112 (K53–K107 HS90B) span the ATP binding pocket and are indicated by colored space filled residues. (B) MS1 level extracted ion chromatograms from biological replicates (forward and reverse SILAC) for the isotopically light and heavy cross-linked peptide pair linking K58 to K112 in HS90A. Increased levels of this cross-linked peptide pair are observed in the 17-AAG treated cells (500 nM) vs. cells treated with vehicle (DMSO). (C) Full length Phyre2(Kelley et al., 2015) generated homology model of HS90B representing an open, extended conformation with minimal interaction between the NTD and MD. The model is colored according to domain structure (NTD cyan, MD red, and CTD grey). Cross-linked residues between the NTD and MD are labeled and connected by red dashed lines. (D) Model of HS90B generated by homology modeling using a compact conformation of E. coli HtpG(Shiau et al., 2006) as a template. Observed cross-links between the NTD and MD were utilized as distance constraints (35 A maximum) to guide molecular docking of the domains resulting in a comparable compact conformation model (Fig. S1D). (E) Plot comparing calculated Euclidean Ca-Ca distances for HS90B cross-links mapped onto the open (C) and compact (D) conformation models. Points on the plot represent cross-linked peptides and are colored according to their measured log2(17-AAG/DMSO) ratio. Large increases in abundance levels were observed for the links between K107 in the NTD and K347, K350, and K435 in the MD during cellular treatment with 17-AAG indicated by the red color of these points. The plot is divided into quadrants (numbered 1–4). Points in quadrant 1 are consistent with both the extended and compact models. Points in quadrant 2 are consistent with the compact model but not possible with the extended model. The Euclidean Ca-Ca distances for these three cross-links exceeds the maximum distance of the cross-linker (35 A) when mapped onto the extended model and are only possible in the compact conformation (see also Figs. S1 and S3).
In addition we see clear evidence of 17-AAG induced conformational changes that go beyond the NTD. In order to rationalize our cross-linking results in the context of FL Hsp90 structure, we generated a model for the open, extended conformation of HS90B using homology modeling with Phyre2 (Kelley et al., 2015) (Fig 2C). Agreement between observed cross-linked residues and model structures was examined using protein contact maps and XLMap (Schweppe et al., 2015a). Mapping of the identified Hsp90 intra-protein cross-linked sites (Table S1) onto the model in Fig. 2C revealed that most cross-linked sites are in excellent agreement with the model. However, the model in which NTD, MD, and CTD are arranged in a linear fashion could not explain linkages between the NTD HS90B K107 (equivalent position to HS90A K112 discussed above) with the MD at K347, K350 and at K435, indicated by the dotted red lines in Fig. 2C. Additionally, these three cross-links are not consistent with a model based on the yeast structure (PDB 2CG9) representing the closed conformation of Hsp90 (Fig. S1). Instead, we performed an additional round of modeling using our cross-link data in combination with the structure of a compact conformation of E. coli HtpG(Shiau et al., 2006). The structure presented in Fig. 2D is consistent with inter-domain links and agrees with the conformational rearrangement that result in a compact state with increased interaction between the NTD and MD. The levels of observed cross-linked peptides K107-K350, K107-K354 and K107-K435 strongly increased with 17-AAG treatment (Fig. 2E), indicating an increase in the relative abundance of Hsp90 conformers represented by Fig. 2D.
These results highlight that some cross-linked sites are more structurally informative than others, and that, depending on the number of populated conformations for a given protein, qXL-MS can be used to differentiate between conformers in an ensemble based on the location of cross-linked sites and variance in their levels. Our results are in line with the observation that 17-AAG mimics the binding of ADP (Roe et al., 1999), and contacts between NTD and MD that are required for ATP hydrolysis (Cunningham et al., 2008). The results also agree with the observation of a recent study which found that MD residues, including and surrounding K347 of HS90B, were labeled by an ATP acyl phosphate probe (Nordin et al., 2015). Nordin et al. concluded that the ATP acyl phosphate probe identified a novel, highly conserved conformational state of Hsp90, and although no model was provided, their data are in excellent agreement with our results of a compact conformation that is enriched upon 17-AAG binding. Similarly, Phillips et al. provide hydrogen-deuterium exchange MS evidence that treatment of isolated HS90B with the NTD inhibitors 17-DMAG and radicicol results in stabilization of a condensed conformation (Phillips et al., 2007). Interestingly, treatment with 500 nM 17-AAG on isolated HS90B in vitro did not produce the same level of increased interaction between the NTD and MD as observed in cells (Fig. 3). Cross-linking of HS90B in vitro resulted in the identification of 89 cross-linked peptide pairs containing 54 non-redundant site-to-site links (Table S2). A comparison of the site-to-site linkages in Hsp90 observed from in vivo and in vitro cross-linking can be seen in Fig. 3A. The relative positions of these cross-links on the domain structures of HS90B can be seen in Fig. 3B. Interestingly, the cross-links unique to the in vitro experiments exist primarily in the MD and CTD. Quantification of selected cross-linked peptides representing the HS90B homodimer (K435-K435), the NTD-MD interaction (K107–K354 and K107–K435), and the closing of the NTD ATP binding pocket (K53–K107) between in vivo and in vitro cross-linking conditions in shown in Fig. 3C. These results revealed a striking difference in conformational and interaction changes exhibited by HS90B in vivo that were not observed under in vitro conditions with 500 nM 17-AAG treatment. Neither the closing of the NTD ATP binding pocket (Fig. 2A) nor the compact conformation observed with increased NTD-MD interaction (Fig. 2D) were similarly observed in vitro. Taken together, these results highlight the importance of the cellular environment, where molecular crowding and protein-protein interactions play a critical role on the conformation and interactions of Hsp90 that is absent with purified Hsp90.(Ellis, 2001; Halpin et al., 2016; Kamal et al., 2003).
Figure 3. Differential effects of 17-AAG on Hsp90 beta in vivo vs. in vitro.

(A) Venn diagram of HS90B cross-linked peptide pairs from in vitro cross-linking vs. in vivo cross-linking experiments. See Tables S1 and S2 for a full list of cross-linked peptides identified from in vivo and in vitro experiments. (B) Domain level cross-link maps, generated with XiNET(Combe et al., 2015), for HS90B illustrating location of cross-links found exclusively from in vivo cross-linking, found both in vivo and in vitro, and those found only from in vitro cross-linking. (C) Bar chart comparing the effects of 500 nM 17-AAG treatment on cells, or isolated HS90B, on the levels of selected HS90B cross-linked peptide pairs. Cartoon representations of HS90B conformations (including dimerization, closing of the ATP binding pocket lid, and NTD-MD interaction) corresponding with selected cross-linked peptides are shown below the bar chart.
Quantitative network analysis reveals broad impact of 17-AAG treatment on the Hsp90 interactome
A quantitative interaction network containing 893 cross-linked proteins was constructed from the qXL-MS data illustrating the extensive impact of Hsp90 inhibition on protein structures and interactions in cells, and is publicly available within XLinkDB (http://xlinkdb.gs.washington.edu/xlinkdb/, network name = Chavez_ChemBiol2016), as well as in Table S1 and Fig. S2 (Schweppe et al., 2016; Zheng et al., 2013). The cross-linked proteins spanned a wide range of cellular abundance (Kulak et al., 2014) (Fig. S3A,B). A Hsp90 sub network, extracted from the full network (Fig. S2), shown in Figure 4 schematically represents the location of all identified cross-linked peptides (K residues) found in HS90A and HS90B, and their interaction partners. Here nodes represent cross-linked sites and edges represent cross-links connecting these sites. Nodes are colored according to the relative protein abundance measured by global SILAC analysis, while the edge color represents the quantitative measurements on the cross-linked peptides. The two isoforms of Hsp90 share 87% sequence identity, with HS90A containing 80 total lysine residues (29 cross-linked) and HS90B containing 76 lysine residues (38 cross-linked) (Fig. S4) Analysis of the cross-linked sites revealed “hot spots” for interactions including the sites in the MD (K443 of HS90A and K435 of HS90B) involved in multiple client protein interactions as well as interactions with STIP1 and HS71A.
Figure 4. Quantitative edgotype network of 17-AAG treatment in HeLa cells.

Hsp90 subnetwork including 17 proteins identified as directly cross-linked to Hsp90 displayed at the cross-linked peptide level. The full protein interaction network is available in Fig. S2. Nodes represent non-redundant cross-linked peptides and are grouped in circular clusters according to their protein of origin. Nodes are colored according to the measured relative protein abundance between cells treated with 500 nM 17-AAG for 18hrs vs. DMSO control by global SILAC analysis. Blue nodes represent proteins for which no signal was obtained by global SILAC analysis. Edges represent cross-links between two peptides and are colored according to their measured Log2(17-AAG/DMSO) values. All data on the cross-linked peptides used to construct this network are included in Table S1.
Comparing all Hsp90 cross-linked sites listed in Fig. 4 with known sites of posttranslational modifications (PTMs), like acetylation, ubiquitination, methylation and succinylation (Mollapour and Neckers, 2012), revealed high level of overlap ([25/29] HS90A and [32/38] HS90B) suggesting higher exposure and reactivity of these Lys residues, which also makes them more likely to be cross-linked (Fig. S4). XlinkDB was used to query the entire PDB for available structures. A total of 1245 out of 3323 cross-linked peptide pairs were mapped onto 333 PDB structures (Table S3) and showed excellent agreement with existing structural data, with a median Euclidean Ca-Ca distance of 16 A and over 95% measuring less than 35 A (Fig. S3C). Cross-linked peptides were quantified using SILAC as previously demonstrated (Chavez et al., 2015) and confidence intervals (α = 0.05) were calculated for cross-linked peptides with measured ratios across biological replicates (Table S1). Perturbations to the network at both the edge and node levels were observed due to 17-AAG treatment and are indicated by node and edge colors (Fig. 4). This included the strong induction of Hsp70 (HS71A) expression, a well-known effect of Hsp90 inhibition (Zou et al., 1998), visible at the node and edge levels. A total of 135 cross-linked peptide pairs we detected are directly involved in HS90A and HS90B and represent inter and intra protein cross-links (Fig. 4). Seventeen proteins were directly cross-linked to Hsp90, all of which are known Hsp90 interactors in the Picard database (Echeverria et al., 2011), including co-chaperones CDC37, STIP1, HS71A, CHRD1 and several client proteins (Fig. 4; Fig 5A, B). Hsp90 cross-linked sites involved in inter-protein interactions were observed in all three major domains of Hsp90 with several sites unique to either the alpha or beta isoform (Fig. 5A, B)..
Figure 5. Sites of Hsp90 interaction for co-chaperone and client proteins.

(A), HS90A domain structure indicating Lys sites of interaction observed for co-chaperone and client proteins. (B), HS90B domain structure indicating Lys sites of interaction observed for co-chaperone and client proteins. (C), Model of the HS90A-STIP1 complex generated through cross-linked site distance constraint guided molecular docking. HS90A is displayed as surface filled model, color coded by domain as in panel A. The binding interface of STIP1 on HS90A is indicated in green. Cross-linked lysine residues K209 and K443 of HS90A and K486 and K513 of STIP1 are red spaced filled residues connected by red dashed lines. The ribbon model for STIP1 is color coded by domain (STI1 2domain = dark blue, TPR2b domain = magenta, TPR2a domain = gold, TPR1 domain = blackand STI1 1 domain = light blue).
Inter-protein cross-links were used as distance constraints to aid molecular docking of Hsp90 and the 17 cross-linked interactors. XLMap (Schweppe et al., 2015a) was used to select representative models for 17 proteins in complex with Hsp90 (Fig. S5). A representative model for the HS90A-STIP1 complex is shown in Fig. 5C. Cross-linked sites between STIP1 and the NTD and MD of Hsp90 agree with proposed sites of interaction(Li et al., 2012). The cross-link between K443 in the MD of HS90A and K513 of STIP1 was observed with increased levels (average Log2(17-AAG/DMSO) = 1.7) across the concentration range of 100nM–1000nM 17-AAG, in agreement with the previous observation of increased Hsp90-STIP1 interaction with geldanamycin treatment(Gano and Simon, 2010). Furthermore, interaction with STIP1 has been shown to increase Hsp90 binding affinity for 17-AAG(Kamal et al., 2003).
Concentration-dependent analysis of edges was performed by tracking the relative abundance of the cross-linked peptides in Table S1 with 17-AAG treatment from 0 to 1000 nM. K-means clustering analysis was used as an unbiased method to identify trends in edge level changes with increasing drug concentration (Fig. 6A, Table S1). K-means clustering of the 17-AAG titration data was accomplished using the R-package kml (Genolini and Falissard, 2011). The R-package kml is a tool designed to work specifically on trajectories. It works by clustering correlated continuous variables, in this case Log2 ratios for cross-linked peptides across 17-AAG concentration, into distinct groups of categorical variables. 1505 edges were consistently quantified across multiple concentrations of 17-AAG and clustered into 6 different groups as shown Fig. 6A. Clusters for specific cross-links are indicated in Table S1. The colored lines in the chart of Fig. 6B represent mean trajectories, or trends, for clusters of cross-linked peptide pairs and correspond with clusters in the adjoining heat map (Fig. 6A), as indicated with color coded bars on the right side. The percentage of the 1505 edges which cluster into each group is indicated above the chart. From this it can be seen that the majority of edges do not change with 17-AAG concentration (clusters 1 & 2, total = 56 %). For example intermolecular cross-links between the TRiC chaperonin proteins TCPA and TCPQ and the Hsp90 B-B homodimer are insensitive to 17-AAG (Fig. S6C). otably, several cross-linked peptides grouped into clusters 4 and 6 display an increase in abundance with increasing 17-AAG concentration, including the intermolecular cross-links that are resultant from HS90A homodimer and HS90A-B heterodimer formation, as well as intramolecular cross-links within both heat shock protein HS105 and the Hsp90 co-chaperone STIP1 (Fig. S6B). Together these results indicate that 17-AAG treatment leads to increased HS90A homodimer and HS90A-B heterodimer formation, without affecting HS90B homodimer, consistent with previous reports (Csermely et al., 1998; Sreedhar et al., 2004). On the other hand, cluster 5 in Fig. 6B revealed treatment with 17-AAG also led to a decreased levels of a group of cross-linked peptide pairs. This cluster includes cross-links within the Hsp90 client protein EGFR (Fig. S6D). The intramolecular EGFR K728–K739 cross-link that displayed decreased levels with 17-AAG is proximal to an eight-amino acid segment shown to be critical for interaction with Hsp90 and for the destabilization of EGFR in cells treated with geldanamycin (Ahsan et al., 2013) (Fig. S6E). Our dataset contains rich information on what happens to the Hsp90 interactome and other parts of the proteome when cells are exposed to 17-AAG. Due to space limitations we are not able to comment on all of these specifically, and we invite the reader to examine our data closely, and encourage them to get in touch with us if they have any questions. Overall, we like to stress that these results constitute the first large-scale visualization of dynamic changes in protein structures and interactions in cells during drug treatment and offer new insight on molecular pharmacology from the inside of cells.
Figure 6. Quantification of cross-linked peptide pairs across 17-AAG concentration.

(A) Heat map and corresponding line graph indicating 6 clusters of cross-linked peptides resulting from K-means clustering of observed Log2(17-AAG/DMSO) SILAC ratios versus 17-AAG concentration. Clusters in the heat map are indicated with colored bars on the right side, corresponding to the colored trace in the plot. A plot with the traces for all cross-linked peptides submitted to K-means clustering analysis is included in Fig. S6A. (B) Chart displaying the 17-AAG concentration dependent response of several cross-linked peptides as measured by targeted PRM analysis. As observed with MS1 based SILAC quantification, cross-linked peptides from the HS90A homodimer, HS90A/B heterodimer, and NTD-MD interactions for HS90A and HS90B all displayed increased relative levels with increasing concentration of 17-AAG. In contrast the cross-link specific for the HS90B homodimer and MD-CTD interaction in HS90B displayed no change in levels in response to 17-AAG treatment. Error bars represent 3 × SD resulting from triplicate measurements of two biological preparations. (C) PRM transitions monitored for the HS90A/B heterodimer cross-link (K443 HS90A – K435 HS90B) at 500 nM 17-AAG. Colored bars represent the transitions for released peptide ions or long arm ions formed after MS2 cleavage of the labile PIR bonds. See Fig. S7 for further explanation of the fragment ions used for PRM transitions. (D) PRM transitions monitored for the HS90B homodimer cross-link (K435-K435) at 500 nM 17-AAG.
Targeted quantitative MS methods are currently shaping the proteomics field, allowing for consistent and reproducible measurements to be made across biological samples(Peterson et al., 2012; Picotti and Aebersold, 2012). To confirm the concentration dependence of the cross-links measured above, selected cross-links involving Hsp90 were subjected to targeted quantification using a high sensitivity, PRM method. PRM quantification was accomplished by extracting the chromatographic peak areas for the fragment ions resulting from the dissociation of one or two of the engineered labile bonds in the PIR cross-linker for both the light and heavy SILAC precursor ions (Fig. S7). PRM analysis confirmed the MS1 based quantitative results discussed above, indicating a strong 17-AAG concentration dependent increase in the HS90A homo-dimer, and NTD-MD interaction cross-linked sites (K107–K350 and K107–K435) in HS90B (Fig. 6B, C). Meanwhile the relative abundance of the HS90B homo-dimer remained unchanged (Fig. 6B, D). PRM quantification of cross-linked peptide pairs within Hsp90 highlights a new capability to interrogate protein conformational changes in cells. Furthermore, cross-linked peptide pairs identified in this study, as well as other recent studies using PIR technology(Chavez et al., 2015; Chavez et al., 2013; Navare et al., 2015; Schweppe et al., 2015b; Weisbrod et al., 2013a), now serve as a resource that can be readily targeted and quantified with high sensitivity and accuracy greatly facilitating future qXL-MS experiments.
Targeted quantification of cross-linked peptides reveals drug specific changes in Hsp90 structures
To demonstrate the capability of our method to provide quantification of drug specific changes in Hsp90 structure, we targeted selected cross-linked peptide pairs identified from the 17-AAG dataset in cells treated with two additional Hsp90 inhibitors, namely the NTD binding, ATP-competitive inhibitor XL888 (Bussenius et al., 2012) and the CTD binding inhibitor Novobiocin(Marcu et al., 2000; Matts et al., 2011). As illustrated in Fig. 7, targeted quantification of cross-linked peptides reveals drug specific changes to the Hsp90 structure. Novobiocin displays a distinct profile compared to the two NTD, ATP-competitive inhibitors, 17-AAG and XL888, yet we observe the closing of the ATP binding pocket by all three drugs, evidenced by increased levels of the K53–K107 cross-link. Although Novobiocin binds only to the second Hsp90 ATP binding pocket located in the CTD(Matts et al., 2011), it competitively inhibits binding of other small molecules to the NTD ATP binding pocket(Marcu et al., 2000), likely through induced conformational changes. The qXL-MS results presented here support this idea, indicating Novobiocin treatment results in a closing of the NTD ATP binding pocket precluding binding of ATP or ATP-competitive NTD inhibitors. These NTD inhibitors displayed similar profiles including increased levels of the HS90A homodimer, HS90A-B heterodimer, and increased interaction between the NTD and MD, while Novobiocin treatment lead to a decrease of the HS90B homodimer, along with slightly decreased HS90A-B heterodimer levels and decreased interactions between the NTD and MD (Fig. 7). Decreased interaction between the NTD and MD would be expected when Hsp90 is in the extended conformation in agreement with a previously proposed model of Novobiocin binding(Matts et al., 2011). CTD inhibitors have been shown to interfere with Hsp90 dimerization(Allan et al., 2006), and our data indicates Novobiocin selectively inhibits HS90B dimerization, in agreement with its weaker dimerization potential compared to HS90A(Csermely et al., 1998; Sreedhar et al., 2004). On the other hand, treatment with the NTD inhibitors, 17-AAG and XL888 lead to increased levels of HS90A homodimer and the HS90A-B heterodimer while having no effect on the HS90B homodimer, reflecting the induced heat shock response observed with Hsp90 inhibitors(Butler et al., 2015). Overall these results demonstrate the potential of quantitative cross-linking to sample drug specific conformational effects on Hsp90 in cells.
Figure 7. Targeted quantification of selected Hsp90 cross-linked peptides with multiple inhibitor treatment.

Bar plot indicating the differential quantitative values for selected cross-linked peptide pairs measured by targeted PRM analysis. Treatment of HeLa cells with the NTD binding Hsp90 inhibitors 17-AAG (yellow bars) and XL888 (diagonal striped yellow bars), result in similar responses while the CTD binding inhibitor Novobiocin (purple bars) displays a unique response. Cartoon representations of Hsp90 conformers are included above the corresponding bars. Red arrows indicate an increase in quantified cross-link levels supportive of a particular conformation with inhibitor treatment (NTD inhibitor and/or CTD inhibitor), while green arrows indicate a decrease in quantified cross-link levels associated with a particular conformation. Cross-linked peptides identifying forms of dimerized Hsp90 (HS90A K443-K443, HS90B K435-K435, and HS90A-HS90B K443-K435) displayed differential levels between inhibitor types. 17-AAG and XL888 lead to increased levels of HS90A homodimer, and the mixed A–B heterodimer while having no effect on the HS90B homodimer. Novobiocin did not change HS90A dimer levels but decreased the HS90B homodimer and mixed A–B heterodimer levels. Cross-linked peptides between the NTD and MD representing a compact form of Hsp90 (K107-and K350, K354 and K435) increased with 17-AAG and XL888 but decreased with Novobiocin treatment. The cross-linked peptide spanning the NTD ATP binding pocket (K53–K107) increased with all inhibitors.
Conclusion
In this study we have demonstrated the ability of qXL-MS to determine structural dynamics of Hsp90 and its interactions in vivo. We observed that 17-AAG induces conformational rearrangement of Hsp90 which includes closing of the ATP-binding pocket, increased interaction between the NTD and MD in a compact conformation, and increased homodimer formation in HS90A but not HS90B, as well as increased HS90A–HS90B heterodimer formation. Structural information on interactions between Hsp90 and co-chaperone and client proteins provided by qXL-MS aided construction of protein complex models. The interaction interfaces defined by these models could aid the development of new inhibitors that target specific Hsp90 complexes, either competitively or as interfacial inhibitors (Pommier and Marchand, 2012). Targeted quantification of cross-linked peptides with a PRM method was demonstrated, and excellent agreement with SILAC MS1 based quantification was observed. Targeted PRM analysis alleviates the requirement for specialized methods, such as ReACT, for analysis of cross-linked peptides Therefore, the cross-linked peptides identified in this study can serve as a resource for many labs and future studies to readily target specific cross-linked peptides as markers for protein interactions and conformations under a multitude of conditions. This potential was demonstrated here by targeting selected Hsp90 cross-linked peptides in cells treated with two additional Hsp90 inhibitors, namely XL-888 and Novobiocin. The NTD inhibitors 17-AAG and XL888, induced similar conformational changes in Hsp90 as 17-AAG, while the CTD inhibitor Novobiocin produced a unique conformational profile. The methods and the cross-links identified in this network could have a broad impact of the quest to identify and develop new Hsp90 inhibitors. Furthermore, the approach in this study should be generalizable to many additional pharmacological agents, thereby providing a new tool for researchers to visualize the impact of drugs on protein interactions and structures. Preliminary results indicate quantification of the alpha-beta tubulin interaction with taxol treatment is possible (Fig. S8), supporting the ability to extend the analytical approach demonstrated here to other protein drug targets.
Significance
Here we used qXL-MS to reveal for the first time in vivo dynamics of protein conformations and interactions resultant from drug treatment on cells. We focused on structural dynamics of a key cancer therapeutic target, Hsp90, its co-chaperones and client proteins resultant from treatment with Hsp90 inhibitors. Hsp90 exists in cells as an ensemble of structurally distinct conformers. Our results demonstrate in vivo chemical cross-linking can detect conformational shifts to this ensemble including closing of the NTD ATP binding pocket in Hsp90 with inhibitor treatment, in agreement with existing structural knowledge of Hsp90. New insight on the in vivo structural regulation of Hsp90 is revealed from the observed cross-linked sites between the NTD and MD, indicating a compact conformation of Hsp90 that strongly increases with NTD inhibitors 17-AAG and XL888. In contrast, the CTD inhibitor Novobiocin decreased the relative abundance of these cross-linked sites indicating a shift in the conformer equilibrium to a more extended form. Furthermore, isoform specific effects were visualized including increased levels in the HS90A homodimer and HS90A–HS90B heterodimer with NTD inhibitors and a decrease in HS90B homodimer with CTD inhibitor treatment. Our study demonstrates that relative levels of cross-linked peptides can correlate with varying inhibitor concentration treatment in cells and cross-linked peptides are amenable to targeted quantitative mass spectrometric analysis facilitating future studies. Cross-linked sites for Hsp90 co-chaperones STIP1, Hsp70, CHRD1 and CDC37 as well as thirteen client proteins enabled experimentally-driven complex model prediction. These models reveal new insight on how these proteins bind Hsp90 and the conformational dependence of these interactions. Taken together our results suggest the application of the methodology demonstrated here provides a new tool to visualize structural dynamics of protein structures and interactions in cells and can have a broad impact in many areas focused on protein function and inhibition.
Experimental Procedures
Cell culture
HeLa cells were seeded at a density of 5 × 10⁶ cells into 150 mm culture dishes with 20 mL of SILAC DMEM medium containing either isotopically light L-lysine and L-arginine or isotopically heavy 13C6 15N2-L-lysine and 13C6-L-arginine (Silantes) and supplemented with 10% dialyzed FBS (Valley Biomedical Inc.) and 1 % pen./strep. (Fisher Scientific). Cells were treated with various concentrations (100, 250, 500, 1000 nM) Tanespimycin (17-N-allylamino-17-demethoxygeldanamycin [17-AAG] Cayman Chemicals), 300 nM XL888 (Selleckchem), 400 μM Novobiocin (Sigma) or 0.1% v/v dimethyl sulfoxide (DMSO) for 18 h before harvesting with 5 mL of phosphate buffered saline (PBS) containing 5 mM EDTA. Cells were washed with PBS and pelleted by centrifugation at 300 g for 3 min and suspended in 170 mM Na2HPO4 pH 8.0 for chemical cross-linking.
Chemical cross-linking of SILAC cells
Isotopically light and heavy cells were mixed at equal numbers (2 × 10⁷ cells) in biological replicates (duplicates of each treatment condition, total = 10 biological samples), either light 17-AAG treated/heavy control or light control/ heavy 17-AAG treated, before adding the PIR cross-linker (Biotin Aspartate Proline – N-hydroxyphthalamide, BDP-NHP), synthesized by solid phase peptide synthesis as previously described(Weisbrod et al., 2013a), from a concentrated stock solution (333 mM) in DMSO to a final concentration of 10 mM. The reaction was carried out at room temperature for 1 h with constant mixing. The reaction time of 1 hr allows time for over 99 % of the cross-linker to react based on the measured half-life of 7.5 min. After 1 h the cells were pelleted by centrifugation at 300 g for 3 min the supernatant was removed and the cross-linking reaction was quenched by suspending the cell pellet in 0.1 M NH4HCO3 pH 8.0.
Chemical cross-linking purified HS90B in vitro
Recombinant HS90B (ENZO) was incubated with 500 nM 17AAG or equivalent volume DMSO on ice for 30 min. Cross-linking was performed with 1 mM BDP-NHP for 1 h at room temperature. The protein was reduced, alkylated and digested and prepped for LC-MS as described in the Supplemental Experimental Procedures.
Cell lysis and cross-linked peptide sample preparation
Cross-linked cells were lysed by suspending the cell pellet in ice cold 8 M urea solution in 0.1 M tris buffer pH 8.0. Sample was sonicated using a GE – 130 ultrasonic processor, followed by reduction and alkylation and tryptic digestion. Resulting peptides were fractionated by strong cation exchange chromatography (SCX) using an Agilent 1200 series HPLC system equipped with a 250 × 10.0 mm column packed with Luna 5 μm 100 A particles (Phenomenex). Cross-linked peptides from SCX fractions were further enriched using UltraLink monomeric avidin (Thermo). The enriched cross-linked peptide sample was concentrated by vacuum centrifugation and stored at −80°C until LC-MS analysis.
LC-MSn analysis of cross-linked peptide pairs
PIR cross-linked peptides were analyzed in technical triplicate by liquid chromatography mass spectrometry using a Waters NanoAcquity UPLC coupled to a Thermo Velos-FTICR mass spectrometer(Weisbrod et al., 2013b) and a real-time adaptive, targeted mass spectrometry method developed for PIR cross-linked peptides (ReACT) (Weisbrod et al., 2013a). Peptides were separated by reversed-phase chromatography. Eluting peptide ions with a charge state of four or greater were selected for high resolution MS2 analysis in the ICR cell where an “on-the-fly” check of the observed fragment ion masses against the PIR mass relationship (Mass Precursor = Mass Reporter Ion + Mass Peptide 1 + Mass Peptide 2) is performed. Masses that satisfied the PIR relationship within a tolerance of 20 ppm mass error triggered subsequent low resolution MS3 analyses of the released cross-linked peptide ions.
Parallel reaction monitoring quantification of cross-linked peptides
Samples containing PIR cross-linked peptides were analyzed using a targeted parallel reaction monitoring (PRM) method on an Easy-nLC (Thermo) coupled to a Q-Exactive Plus mass spectrometer (Thermo). Peptides were separated by reversed-phase chromatography before being analyzed by a Q-Exactive Plus mass spectrometer operated using a PRM method targeting selected cross-linked peptides with the following parameters: resolution = 17,500, AGC target = 2e5 ions, maximum ion time = 50 ms, isolation window = 3 m/z, NCE = 25.
Identification and of quantification of cross-linked peptides
ReACT generated MS3 spectra containing peptide fragmentation information were searched against a subset of the UniProt reference proteome database for Homo sapiens containing both forward and reverse protein sequences (7030 total sequences) using Comet(Eng et al., 2015) (v. 2015.01). The 3515 proteins included in the subset database were identified as putative PIR reactive proteins through a stage 1 database approach as previously described(Chavez et al., 2015). The global FDR was estimated to be ≤1.5% by taking the ratio of decoy cross-linked peptide pairs (either containing one or two reverse peptide sequence matches that passed filters) to the total number of cross-linked peptide pairs.
Relative quantitative analysis of cross-linked peptide pairs between 17-AAG treated and DMSO control conditions was performed using MassChroQ (Valot et al., 2011).
For statistical analysis, peak area output from MassChroQ was analyzed using R. Log2 ratios for 17-AAG/DMSO peak areas were calculated and the distribution of Log2 ratios was median centered. For cross-linked peptides with multiple ratios, the standard deviation and 95% confidence interval was calculated. K-means clustering of the 17-AAG titration data was accomplished using the R-package kml (Genolini and Falissard, 2011). Heat map images were generated with Java Treeview (Saldanha, 2004).
Molecular docking and complex model selection
For proteins cross-linked to Hsp90 without complete structural data in the PDB, Phyre2 was used in intensive modeling mode to generate FL structural models. Rigid body docking based on complimentary shape criteria was performed using PatchDock (Schneidman-Duhovny et al., 2005). Distance constraints based on observed cross-links were used (0–35 angstroms between the Ca atoms of the cross-linked lysines). For each complex the top 100 docking results were analyzed by an updated algorithm based on the R-package XLMap (Schweppe et al., 2015a) called XLComplex, provided for free online at http://brucelab.gs.washington.edu/software.html
Further descriptions of protocols can be found in the Supplemental Experimental Procedures.
Supplementary Material
Highlights.
Hsp90 conformational changes upon inhibitor treatment in cells revealed
Hsp90 isoform specific responses to inhibitor treatment visualized
Quantitative Hsp90 interactome network including 3323 cross-linked peptides
Structural information provided for Hsp90 co-chaperone and client protein complexes
Acknowledgments
We thank all of the members of the Bruce Laboratory and the UWPR for their advice and helpful discussions. We would also like to thank the Editor, Milka Kostic, for her helpful suggestions and feedback. This work was supported by the National Institutes of Health through grant numbers: 5R01RR023334, 1R01GM097112, 5R01GM086688, 7S10RR025107, 5U19AI107775 and 1R01HL110879 and supported in part by the UW Proteome Resource UWPR95794.
Footnotes
Author Contributions
Conceptualization, J.D.C. and J.E.B.; Methodology J.D.C and J.E.B.; Investigation, J.D.C., D.K.S., J.K.E, and J.E.B; Resources, J.D.C, D.K.S, J.K.E. and J.E.B.; Writing – Original Draft, J.D.C, D.K.S, and J.E.B.; Writing – Review & Editing, J.D.C and J.E.B.; Supervision, J.E.B.
Publisher's Disclaimer: This is a PDF file of an unedited manuscript that has been accepted for publication. As a service to our customers we are providing this early version of the manuscript. The manuscript will undergo copyediting, typesetting, and review of the resulting proof before it is published in its final citable form. Please note that during the production process errors may be discovered which could affect the content, and all legal disclaimers that apply to the journal pertain.
References
- Ahsan A, Ray D, Ramanand SG, Hegde A, Whitehead C, Rehemtulla A, Morishima Y, Pratt WB, Osawa Y, Lawrence TS, et al. Destabilization of the epidermal growth factor receptor (EGFR) by a peptide that inhibits EGFR binding to heat shock protein 90 and receptor dimerization. J Biol Chem. 2013;288:26879–26886. doi: 10.1074/jbc.M113.492280. [DOI] [PMC free article] [PubMed] [Google Scholar]
- Allan RK, Mok D, Ward BK, Ratajczak T. Modulation of chaperone function and cochaperone interaction by novobiocin in the C-terminal domain of Hsp90: evidence that coumarin antibiotics disrupt Hsp90 dimerization. J Biol Chem. 2006;281:7161–7171. doi: 10.1074/jbc.M512406200. [DOI] [PubMed] [Google Scholar]
- Brandt GE, Blagg BS. Alternate strategies of Hsp90 modulation for the treatment of cancer and other diseases. Curr Top Med Chem. 2009;9:1447–1461. doi: 10.2174/156802609789895683. [DOI] [PMC free article] [PubMed] [Google Scholar]
- Bussenius J, Blazey CM, Aay N, Anand NK, Arcalas A, Baik T, Bowles OJ, Buhr CA, Costanzo S, Curtis JK, et al. Discovery of XL888: a novel tropane-derived small molecule inhibitor of HSP90. Bioorg Med Chem Lett. 2012;22:5396–5404. doi: 10.1016/j.bmcl.2012.07.052. [DOI] [PubMed] [Google Scholar]
- Butler LM, Ferraldeschi R, Armstrong HK, Centenera MM, Workman P. Maximizing the Therapeutic Potential of HSP90 Inhibitors. Mol Cancer Res. 2015;13:1445–1451. doi: 10.1158/1541-7786.MCR-15-0234. [DOI] [PMC free article] [PubMed] [Google Scholar]
- Chavez JD, Schweppe DK, Eng JK, Zheng C, Taipale A, Zhang Y, Takara K, Bruce JE. Quantitative interactome analysis reveals a chemoresistant edgotype. Nature communications. 2015;6 doi: 10.1038/ncomms8928. [DOI] [PMC free article] [PubMed] [Google Scholar]
- Chavez JD, Weisbrod CR, Zheng C, Eng JK, Bruce JE. Protein interactions, post-translational modifications and topologies in human cells. Molecular & Cellular Proteomics. 2013;12:1451–1467. doi: 10.1074/mcp.M112.024497. [DOI] [PMC free article] [PubMed] [Google Scholar]
- Combe CW, Fischer L, Rappsilber J. xiNET: cross-link network maps with residue resolution. Mol Cell Proteomics. 2015;14:1137–1147. doi: 10.1074/mcp.O114.042259. [DOI] [PMC free article] [PubMed] [Google Scholar]
- Csermely P, Schnaider T, Soti C, Prohaszka Z, Nardai G. The 90-kDa molecular chaperone family: structure, function, and clinical applications. A comprehensive review. Pharmacol Ther. 1998;79:129–168. doi: 10.1016/s0163-7258(98)00013-8. [DOI] [PubMed] [Google Scholar]
- Cunningham CN, Krukenberg KA, Agard DA. Intra- and intermonomer interactions are required to synergistically facilitate ATP hydrolysis in Hsp90. J Biol Chem. 2008;283:21170–21178. doi: 10.1074/jbc.M800046200. [DOI] [PMC free article] [PubMed] [Google Scholar]
- Donnelly A, Blagg BS. Novobiocin and additional inhibitors of the Hsp90 C-terminal nucleotide-binding pocket. Curr Med Chem. 2008;15:2702–2717. doi: 10.2174/092986708786242895. [DOI] [PMC free article] [PubMed] [Google Scholar]
- Echeverria PC, Bernthaler A, Dupuis P, Mayer B, Picard D. An interaction network predicted from public data as a discovery tool: application to the Hsp90 molecular chaperone machine. PLoS One. 2011;6:e26044. doi: 10.1371/journal.pone.0026044. [DOI] [PMC free article] [PubMed] [Google Scholar]
- Ellis RJ. Macromolecular crowding: obvious but underappreciated. Trends Biochem Sci. 2001;26:597–604. doi: 10.1016/s0968-0004(01)01938-7. [DOI] [PubMed] [Google Scholar]
- Eng JK, Hoopmann MR, Jahan TA, Egertson JD, Noble WS, MacCoss MJ. A Deeper Look into Comet-Implementation and Features. J Am Soc Mass Spectrom. 2015;26:1865–1874. doi: 10.1007/s13361-015-1179-x. [DOI] [PMC free article] [PubMed] [Google Scholar]
- Gano JJ, Simon JA. A proteomic investigation of ligand-dependent HSP90 complexes reveals CHORDC1 as a novel ADP-dependent HSP90-interacting protein. Mol Cell Proteomics. 2010;9:255–270. doi: 10.1074/mcp.M900261-MCP200. [DOI] [PMC free article] [PubMed] [Google Scholar]
- Garcia-Carbonero R, Carnero A, Paz-Ares L. Inhibition of HSP90 molecular chaperones: moving into the clinic. Lancet Oncol. 2013;14:e358–369. doi: 10.1016/S1470-2045(13)70169-4. [DOI] [PubMed] [Google Scholar]
- Genolini C, Falissard B. KmL: a package to cluster longitudinal data. Comput Methods Programs Biomed. 2011;104:e112–121. doi: 10.1016/j.cmpb.2011.05.008. [DOI] [PubMed] [Google Scholar]
- Halpin JC, Huang B, Sun M, Street TO. Crowding Activates Heat Shock Protein 90. J Biol Chem. 2016;291:6447–6455. doi: 10.1074/jbc.M115.702928. [DOI] [PMC free article] [PubMed] [Google Scholar]
- Jahn M, Rehn A, Pelz B, Hellenkamp B, Richter K, Rief M, Buchner J, Hugel T. The charged linker of the molecular chaperone Hsp90 modulates domain contacts and biological function. Proc Natl Acad Sci U S A. 2014;111:17881–17886. doi: 10.1073/pnas.1414073111. [DOI] [PMC free article] [PubMed] [Google Scholar]
- Jego G, Hazoume A, Seigneuric R, Garrido C. Targeting heat shock proteins in cancer. Cancer Lett. 2013;332:275–285. doi: 10.1016/j.canlet.2010.10.014. [DOI] [PubMed] [Google Scholar]
- Kamal A, Thao L, Sensintaffar J, Zhang L, Boehm MF, Fritz LC, Burrows FJ. A high-affinity conformation of Hsp90 confers tumour selectivity on Hsp90 inhibitors. Nature. 2003;425:407–410. doi: 10.1038/nature01913. [DOI] [PubMed] [Google Scholar]
- Kelley LA, Mezulis S, Yates CM, Wass MN, Sternberg MJ. The Phyre2 web portal for protein modeling, prediction and analysis. Nat Protoc. 2015;10:845–858. doi: 10.1038/nprot.2015.053. [DOI] [PMC free article] [PubMed] [Google Scholar]
- Khandelwal A, Crowley VM, Blagg BS. Natural Product Inspired N-Terminal Hsp90 Inhibitors: From Bench to Bedside? Med Res Rev. 2016;36:92–118. doi: 10.1002/med.21351. [DOI] [PMC free article] [PubMed] [Google Scholar]
- Krukenberg KA, Street TO, Lavery LA, Agard DA. Conformational dynamics of the molecular chaperone Hsp90. Q Rev Biophys. 2011;44:229–255. doi: 10.1017/S0033583510000314. [DOI] [PMC free article] [PubMed] [Google Scholar]
- Kulak NA, Pichler G, Paron I, Nagaraj N, Mann M. Minimal, encapsulated proteomic-sample processing applied to copy-number estimation in eukaryotic cells. Nat Methods. 2014;11:319–324. doi: 10.1038/nmeth.2834. [DOI] [PubMed] [Google Scholar]
- Leitner A, Faini M, Stengel F, Aebersold R. Crosslinking and Mass Spectrometry: An Integrated Technology to Understand the Structure and Function of Molecular Machines. Trends Biochem Sci. 2016;41:20–32. doi: 10.1016/j.tibs.2015.10.008. [DOI] [PubMed] [Google Scholar]
- Li J, Buchner J. Structure, function and regulation of the hsp90 machinery. Biomed J. 2013;36:106–117. doi: 10.4103/2319-4170.113230. [DOI] [PubMed] [Google Scholar]
- Li J, Soroka J, Buchner J. The Hsp90 chaperone machinery: conformational dynamics and regulation by co-chaperones. Biochim Biophys Acta. 2012;1823:624–635. doi: 10.1016/j.bbamcr.2011.09.003. [DOI] [PubMed] [Google Scholar]
- Liu F, Rijkers DT, Post H, Heck AJ. Proteome-wide profiling of protein assemblies by cross-linking mass spectrometry. Nat Methods. 2015 doi: 10.1038/nmeth.3603. [DOI] [PubMed]
- Marcu MG, Schulte TW, Neckers L. Novobiocin and related coumarins and depletion of heat shock protein 90-dependent signaling proteins. J Natl Cancer Inst. 2000;92:242–248. doi: 10.1093/jnci/92.3.242. [DOI] [PubMed] [Google Scholar]
- Matts RL, Dixit A, Peterson LB, Sun L, Voruganti S, Kalyanaraman P, Hartson SD, Verkhivker GM, Blagg BS. Elucidation of the Hsp90 C-terminal inhibitor binding site. ACS Chem Biol. 2011;6:800–807. doi: 10.1021/cb200052x. [DOI] [PMC free article] [PubMed] [Google Scholar]
- Mayer MP, Le Breton L. Hsp90: breaking the symmetry. Mol Cell. 2015;58:8–20. doi: 10.1016/j.molcel.2015.02.022. [DOI] [PubMed] [Google Scholar]
- Mayer MP, Prodromou C, Frydman J. The Hsp90 mosaic: a picture emerges. Nat Struct Mol Biol. 2009;16:2–6. doi: 10.1038/nsmb0109-2. [DOI] [PMC free article] [PubMed] [Google Scholar]
- Mollapour M, Neckers L. Post-translational modifications of Hsp90 and their contributions to chaperone regulation. Biochim Biophys Acta. 2012;1823:648–655. doi: 10.1016/j.bbamcr.2011.07.018. [DOI] [PMC free article] [PubMed] [Google Scholar]
- Navare AT, Chavez JD, Zheng C, Weisbrod CR, Eng JK, Siehnel R, Singh PK, Manoil C, Bruce JE. Probing the Protein Interaction Network of Pseudomonas aeruginosa Cells by Chemical Cross-Linking Mass Spectrometry. Structure. 2015;23:762–773. doi: 10.1016/j.str.2015.01.022. [DOI] [PMC free article] [PubMed] [Google Scholar]
- Nordin BE, Liu Y, Aban A, Brown HE, Wu J, Hainley AK, Rosenblum JS, Nomanbhoy TK, Kozarich JW. ATP Acyl Phosphate Reactivity Reveals Native Conformations of Hsp90 Paralogs and Inhibitor Target Engagement. Biochemistry. 2015;54:3024–3036. doi: 10.1021/acs.biochem.5b00148. [DOI] [PubMed] [Google Scholar]
- Peterson AC, Russell JD, Bailey DJ, Westphall MS, Coon JJ. Parallel reaction monitoring for high resolution and high mass accuracy quantitative, targeted proteomics. Mol Cell Proteomics. 2012;11:1475–1488. doi: 10.1074/mcp.O112.020131. [DOI] [PMC free article] [PubMed] [Google Scholar]
- Phillips JJ, Yao ZP, Zhang W, McLaughlin S, Laue ED, Robinson CV, Jackson SE. Conformational dynamics of the molecular chaperone Hsp90 in complexes with a co-chaperone and anticancer drugs. J Mol Biol. 2007;372:1189–1203. doi: 10.1016/j.jmb.2007.04.059. [DOI] [PubMed] [Google Scholar]
- Picotti P, Aebersold R. Selected reaction monitoring-based proteomics: workflows, potential, pitfalls and future directions. Nat Methods. 2012;9:555–566. doi: 10.1038/nmeth.2015. [DOI] [PubMed] [Google Scholar]
- Pommier Y, Marchand C. Interfacial inhibitors: targeting macromolecular complexes. Nat Rev Drug Discov. 2012;11:25–36. doi: 10.1038/nrd3404. [DOI] [PMC free article] [PubMed] [Google Scholar]
- Roe SM, Prodromou C, O’Brien R, Ladbury JE, Piper PW, Pearl LH. Structural basis for inhibition of the Hsp90 molecular chaperone by the antitumor antibiotics radicicol and geldanamycin. J Med Chem. 1999;42:260–266. doi: 10.1021/jm980403y. [DOI] [PubMed] [Google Scholar]
- Saldanha AJ. Java Treeview--extensible visualization of microarray data. Bioinformatics. 2004;20:3246–3248. doi: 10.1093/bioinformatics/bth349. [DOI] [PubMed] [Google Scholar]
- Schneidman-Duhovny D, Inbar Y, Nussinov R, Wolfson HJ. PatchDock and SymmDock: servers for rigid and symmetric docking. Nucleic Acids Res. 2005;33:W363–367. doi: 10.1093/nar/gki481. [DOI] [PMC free article] [PubMed] [Google Scholar]
- Schweppe DK, Chavez JD, Bruce JE. XLmap: an R package to visualize and score protein structure models based on sites of protein cross-linking. Bioinformatics. 2015a doi: 10.1093/bioinformatics/btv519. [DOI] [PMC free article] [PubMed] [Google Scholar]
- Schweppe DK, Harding C, Chavez JD, Wu X, Ramage E, Singh PK, Manoil C, Bruce JE. Host-Microbe Protein Interactions during Bacterial Infection. Chem Biol. 2015b doi: 10.1016/j.chembiol.2015.09.015. [DOI] [PMC free article] [PubMed] [Google Scholar]
- Schweppe DK, Zheng C, Chavez JD, Navare AT, Wu X, Eng JK, Bruce JE. XLinkDB 2.0: Integrated, large-scale structural analysis of protein crosslinking data. Bioinformatics. 2016 doi: 10.1093/bioinformatics/btw232. [DOI] [PMC free article] [PubMed] [Google Scholar]
- Shiau AK, Harris SF, Southworth DR, Agard DA. Structural Analysis of E. coli hsp90 reveals dramatic nucleotide-dependent conformational rearrangements. Cell. 2006;127:329–340. doi: 10.1016/j.cell.2006.09.027. [DOI] [PubMed] [Google Scholar]
- Southworth DR, Agard DA. Species-dependent ensembles of conserved conformational states define the Hsp90 chaperone ATPase cycle. Mol Cell. 2008;32:631–640. doi: 10.1016/j.molcel.2008.10.024. [DOI] [PMC free article] [PubMed] [Google Scholar]
- Sreedhar AS, Kalmar E, Csermely P, Shen YF. Hsp90 isoforms: functions, expression and clinical importance. FEBS Lett. 2004;562:11–15. doi: 10.1016/s0014-5793(04)00229-7. [DOI] [PubMed] [Google Scholar]
- Stebbins CE, Russo AA, Schneider C, Rosen N, Hartl FU, Pavletich NP. Crystal structure of an Hsp90-geldanamycin complex: targeting of a protein chaperone by an antitumor agent. Cell. 1997;89:239–250. doi: 10.1016/s0092-8674(00)80203-2. [DOI] [PubMed] [Google Scholar]
- Taipale M, Jarosz DF, Lindquist S. HSP90 at the hub of protein homeostasis: emerging mechanistic insights. Nat Rev Mol Cell Biol. 2010;11:515–528. doi: 10.1038/nrm2918. [DOI] [PubMed] [Google Scholar]
- Tang X, Bruce JE. A new cross-linking strategy: protein interaction reporter (PIR) technology for protein-protein interaction studies. Mol Biosyst. 2010;6:939–947. doi: 10.1039/b920876c. [DOI] [PMC free article] [PubMed] [Google Scholar]
- Valot B, Langella O, Nano E, Zivy M. MassChroQ: a versatile tool for mass spectrometry quantification. Proteomics. 2011;11:3572–3577. doi: 10.1002/pmic.201100120. [DOI] [PubMed] [Google Scholar]
- Walzthoeni T, Joachimiak LA, Rosenberger G, Rost HL, Malmstrom L, Leitner A, Frydman J, Aebersold R. xTract: software for characterizing conformational changes of protein complexes by quantitative cross-linking mass spectrometry. Nat Methods. 2015;12:1185–1190. doi: 10.1038/nmeth.3631. [DOI] [PMC free article] [PubMed] [Google Scholar]
- Weisbrod CR, Chavez JD, Eng JK, Yang L, Zheng C, Bruce JE. In vivo protein interaction network identified with a novel real-time cross-linked peptide identification strategy. Journal of proteome research. 2013a;12:1569–1579. doi: 10.1021/pr3011638. [DOI] [PMC free article] [PubMed] [Google Scholar]
- Weisbrod CR, Hoopmann MR, Senko MW, Bruce JE. Performance evaluation of a dual linear ion trap-Fourier transform ion cyclotron resonance mass spectrometer for proteomics research. J Proteomics. 2013b;88:109–119. doi: 10.1016/j.jprot.2013.04.009. [DOI] [PMC free article] [PubMed] [Google Scholar]
- Zheng C, Weisbrod CR, Chavez JD, Eng JK, Sharma V, Wu X, Bruce JE. XLink-DB: database and software tools for storing and visualizing protein interaction topology data. J Proteome Res. 2013;12:1989–1995. doi: 10.1021/pr301162j. [DOI] [PMC free article] [PubMed] [Google Scholar]
- Zou J, Guo Y, Guettouche T, Smith DF, Voellmy R. Repression of heat shock transcription factor HSF1 activation by HSP90 (HSP90 complex) that forms a stress-sensitive complex with HSF1. Cell. 1998;94:471–480. doi: 10.1016/s0092-8674(00)81588-3. [DOI] [PubMed] [Google Scholar]
Associated Data
This section collects any data citations, data availability statements, or supplementary materials included in this article.