

Abstract
An integrated system with automated immunomagnetic separation and processing of fluidic samples was demonstrated for multiplexed optical detection of bacterial targets. Mixtures of target-specific magnetic bead sets were processed in the NRL MagTrap with the aid of rotating magnet arrays that entrapped and moved the beads within the channel during reagent processing. Processing was performed in buffer and human serum matrices with 10-fold dilutions in the range of 102 – 106 cells/mL of target bacteria. Reversal of magnets’ rotation post processing released the beads back into the flow and moved them into the Microflow Cytometer for optical interrogation. Identification of the beads and the detection of PE fluorescence were performed simultaneously for multiplexed detection. Multiplexing was performed with specifically targeted bead sets to detect E. coli 0157.H7, Salmonella Common Structural Antigen, Listeria sp. and Shigella sp. Dose-response curves were obtained, and limits of detection were calculated for each target in the buffer and clinical matrix. Additional tests demonstrated the potential for using the MagTrap to concentrate target from larger volumes of sample prior to the addition of assay reagents.
Keywords: microflow cytometry, multiplexed analysis, automated sample processing, bacterial detection, immunomagnetic
BACKGROUND
Driving the development of automated systems performing both sample processing and analysis is the public demand for point-of-use detection systems. The concerns for providing diagnostic capability in resource-limited settings and reducing health care costs for all have highlighted the need for rapid, portable, robust, multiplexed detection systems.1 Threats to food safety and environmental security have similarly fostered development of systems that can separate targets from complex sample matrices and automatically screen for targets of concern.2–9 While electrochemical biosensors have proven commercially successful for analysis of glucose and blood gases, miniaturized, multiplexed biosensor systems that can be used on-site to screen for larger targets, such as proteins and pathogens, are based primarily on optical evaluation of lateral flow assays, microarrays or microflow cytometry. 10–12
The integration of sample processing with bioanalytical devices began with the use of robotics to automate manual procedures. For example, robots were designed to add reagents to 96-well plates and move samples into analytical systems in order to facilitate high throughput assays. The components came in a variety of shapes and sizes, but the general strategy was to replicate the human manipulations in parallel processing operations. While there were a few early reports exemplifying sample processing and analysis in a single microfluidic chip,13–16 the complexity of these operations and issues related to substrate materials limited progress. The integration of sample processing and analysis is gaining momentum as the methods for performing separations, automated mixing operations, and analysis17,18 in microfluidic components become better defined and the community gains expertise with a wider variety of fabrication techniques.
Most of the devices in the literature describing integrated microfluidic systems for bioanalysis capture the target onto a solid support at some point in the process. Genetic analysis systems usually start with cell lysis and capture of oligonucleotides for subsequent amplification, followed by dimerization and signal generation. 19,20 Antibody recognition systems typically use the initial capture to separate the target from the sample matrix and then use additional tracer binding steps for signal generation. Magnetic beads have been used in both strategies to capture the targets and/or move them from one fluid to another. 21–24 Magnetic bead capture has been used to isolate biothreat agents in the environmental air sampler/flow cytometry systems deployed in the US for homeland security.25–27 In these system, the automated sample processing is accomplished using a conventional valve and pump configuration, and the flow cytometer is a benchtop device. The entire system is floor standing and about the size of a large speaker’s pulpit.
Magnetic beads have the advantages of being commercially available in multiple sizes, they are relatively easy to modify for attachment of recognition molecules, and they can be manipulated with inexpensive magnets without removal from the microfluidic channel. Magnetic beads have the disadvantages that they may settle to the bottom of a channel or clog an injection tube, they tend to aggregate—especially if drawn into a clump by a magnet, and they may quench a fluorescent signal if not carefully coated. In order to utilize the advantages of magnetic beads for sample processing while minimizing the disadvantages, we invented the spinning magnetic trap (MagTrap).28,29 The MagTrap utilizes spinning magnets to move beads upstream and side-to-side in a microfluidic channel during the introduction of sample and processing reagents. Reversing the direction of the spinning magnets concentrates the beads without causing aggregation and releases the beads directly into the analyzer. In initial studies, the relationship of the geometry of the magnetic field to the flow rate and movement of the beads was optimized for both capture and release. In a proof-of-principle demonstration,30 the outlet of the MagTrap was connected to the NRL microflow cytometer31,32 for detection of E. coli 0157:H7. The assay time was reduced significantly and the sensitivity was enhanced compared to manually processed samples.
The proof-of-principle demonstration detected a single target that had been captured on immunomagnetic beads prior to introduction into the MagTrap. In this study, we expand the use of the integrated MagTrap and microflow cytometer system to perform multiplexed assays for six targets simultaneously in clinical fluids as well as buffer. The magnetic bead sets are coded using two fluorophores distinct from the fluorophore bound by captured target, so all bead sets can be analyzed simultaneously. Captured target is identified on the basis of the 2-color fluorescent signal of the associated bead. We also demonstrate that we can eliminate the pre-incubation of the sample and beads prior to introduction into the MagTrap for a “sample in-answer out” operation.
EXPERIMENTAL
Integrated sample processing and analysis system
The MagTrap and microflow cytometer system was introduced previously with a proof-of-principle demonstration of E. coli captured onto fluorescent beads, exposed to tracer reagents in the MagTrap, and analyzed using the microflow cytometer. Briefly, the MagTrap consisted of a trapezoidal channel embossed into poly(methylmethacrylate) (PMMA; 500 μm top width, 355 μm bottom width, 125 μm height, 6 cm length), with the bottom surface nearest to an underlying wheel containing magnets. The magnetic wheel contained 12 rare earth magnets (NdFeB, 1.6 mm wide, 19 mm long, and 6 mm deep; K&J Magnetics, Inc., Jamison, PA, USA) arranged in pairs, with all magnets’ polarities in parallel orientations. This created maximum magnetic flux between the two magnets in a pair and minimum flux between the pairs.28 The wheel was attached to a motor that rotated the magnets such that magnetic particles were pulled upstream and across the channel during the sample processing operations. The direction was reversed to pull the beads with bound targets downstream toward the MagTrap outlet during the release phase. At the release phase, the beads move in the same direction as the flow, allowing them to escape the microchannel.
In the integrated device, the outlet of the MagTrap was connected to the inlet of the polydimethylsiloxane (PDMS) microflow cytometer (Figure 1). Additional inlets in the microflow cytometer introduced the sheath fluid on either side of the sample steam. The sample stream was further focused as grooves in the top and bottom of the channel transported the sheath fluid from the sides of the channel to the top and bottom. The sample stream was focused into a core stream approximately 40 μm in diameter as it passed through the interrogation region.31 Optical fibers, inserted into the microflow cytometer, delivered the excitation light and collected signals as discussed in more detail below. Two dead-end channels, located on the sides of the fluidic channel, intersected the optical fiber channels and entrapped bubbles that entered the device, preventing them from reaching the optical interrogation region (Figure 2). Bubbles in the interrogation region alter the flow and divert light, thus causing problems with data reproducibility. The conventional fabrication procedures are described in detail in the Electronic Supplemental Information (ESI).
Figure 1.

Integrated MagTrap and microflow cytometer system with sample input pump. Tubing to sheath flow inlets and fluid outlet has been removed for better visualization.
Figure 2.

Schematic drawing of the microflow cytometer design that includes two bubble trap channels. The design consists of two parts, top and bottom, that align to form a single microflow cytometer device. The bottom part includes fluidic and optical fiber channels, while both the top and bottom parts have chevron grooves for attainment of core-sheath flow. The fluidic inlets and outlet were marked on both parts for alignment purposes, although the holes were cored only in the top.
The integrated MagTrap and microflow cytometer system used here, depicted in Figure 1, had several improvements over the previously described version. First, the two diode lasers used for excitation were prepackaged together for easy alignment and reduced size. Second, the sample was pushed through the entire system with a pump less susceptible to pulsing than those used previously. Third, the microflow cytometer chip was redesigned to include bubble traps for more reliable, longer-term operation. Additional improvements included increasing the height between the outlet of the MagTrap channel and the inlet of the microflow cytometer, which reduced pressure difference between the two and allowed for easier bead flow. Also, the addition of blackout boxes to block stray light and programmable fine control over voltage gain of lasers and photomultiplier tubes (PMTs) improved data reproducibility.
Opto/Mechanical Set-Up
The optical setup of the microflow cytometer was modified to incorporate two lasers, 532 nm and 635 nm, in a single SpectraTec II multi-laser module (BlueSky Research, Milpitas, CA, USA) and coupled into a single-mode fiber. This setup provided more efficient and uniform excitation than with the previously reported configurations29, 31 and eliminated the need for alignment of the lasers. Specifically, the 532 nm laser was used to excite the phycoerythrin molecules and the 635 nm laser excited the two dyes located inside the magnetic beads, which assign their identity. Fluorescence was collected in the microflow cytometer using two multi-mode fibers situated at 45° to the microfluidic channel. One fiber was split using a 50/50 fiber splitter leading to two PMTs (Hamamatsu, Japan) equipped with 670 nm and 700 nm filters for bead identification, and the other was split using a 30/70 fiber splitter to two more PMTs through a 635 nm filter delivering the scatter signal and a 565 nm filter for the phycoerythrin signal, respectively. The dual laser module coupled the two laser beams into a single-mode fiber that had an APC connector and an 8° polish to prevent back reflections to the lasers. The power output from both lasers was controlled by voltage output through a D/A card, set through a user interface written in LabWindows (National Instruments Corporation, Austin, TX, USA). The experiments were conducted with an approximate power output of 3 mW from each laser. Using FC/APC connectors, an intermediate single-mode fiber delivered light to the single-mode fiber embedded in the microflow cytometer, preventing damage to the fiber that was permanently mounted in the laser module.
Pumping of the sample solutions through the system was accomplished using an Instech P625.10K peristaltic pump (Instech Laboratories, Plymouth Meeting, PA, USA), which had a 10:1 gear ratio capable of attaining a flow rate of 10 μL/min with minimal pulsation. Using a peristaltic pump with a high gear ratio for achieving core flow minimized vibration, pulsation, and fluctuation in the core size and position. The introduction of the sheath fluid on both sides of the core stream additionally minimized the lateral movement of the core in relation to the excitation light and collection fibers. Consistent alignment of the core in relation to the excitation light and collection fibers was of utmost importance for achieving the reproducible fluorescence intensities and discriminating multiple bead sets.
Multiplexed Detection of Bacteria
Automated assays simultaneously tested for four different bacteria and evaluated positive and negative controls. Thus, all tests measured phycoerythrin fluorescence on superparamagnetic beads (Luminex Corporation, Austin, TX, USA) with six different combinations of two fluorophores (fluorescence IDs). To minimize the impact of either the difference in avidity of the capture antibodies on the beads or any interference with target capture caused by shear forces on the binding of bacteria, the initial incubations of the capture beads with the samples were performed in a tube for 20 minutes prior to introduction into the MagTrap (100 μL containing cells and approximately 500 beads from each group). Bacteria used as targets included four Category B pathogens: E. coli O157:H7, Salmonella, Listeria, and Shigella (KPL, Inc, Gaithersburg, MD, USA). Bacteria were heat-inactivated and handled under Biosafety Level 2 conditions. The experiments were performed using each target in 10-fold dilutions between 102 and 106 cells/mL both in a phosphate buffered saline pH=7.2 with 0.1% Tween 20 and 1 mg/mL BSA (PBSTB; Sigma Aldrich, St. Louis, MO, USA) and in 10% human serum (10% HS; Jackson Immunoresearch, Inc., West Grove, PA, USA) in phosphate buffered saline with 0.1% Tween-20 (PBST).
Superparamagnetic beads were prepared for target detection by immobilizing of 0.50 mg/mL antibody or protein to each bead set via EDC/S-NHS chemistry as described in Taitt et al.33 The immobilized antibodies were rabbit anti-chicken IgY (Jackson Immunoresearch), goat anti-E. coli 0157.H7, goat anti-Listeria sp. (high sensitivity), goat anti-Salmonella Conserved Structural Antigen (CSA, KPL, Inc.) and rabbit anti-Shigella sp. (Meridian Life Sciences, Inc., Memphis, TN, USA.). (Detailed information on specificity included in the SI.) Negative control beads were incubated with 1 mg/mL bovine serum albumin (Sigma Aldrich, St. Louis, MO, USA) for 10 minutes on a shaker at room temperature, then in static conditions at 4°C overnight. Unless otherwise indicated, the beads were incubated with the target solution for 20 minutes at room temperature in the dark, after which, the samples were pumped into the MagTrap-microflow cytometer system at 10 μL/min. The rotation of the magnets pulled the beads in a direction opposite to the flow, retaining the beads in the channel, while at the same time moving and mixing them. Sample processing steps were then carried out in the MagTrap microchannel by sequential addition of reagents at 10 μL/min: tracer biotinylated antibody cocktail for 5 minutes, PBSTB for 10 seconds, and 7.5 μg/mL streptavidin phycoerythrin (SA-PE; Columbia BioSciences, Columbia, MD, USA) for 3 minutes. The tracer antibody cocktail contained 5 μg/mL biotinylated goat anti-E. coli 0157.H7 and 10 μg/mL each of biotinylated goat anti-Listeria sp., biotinylated goat anti-Salmonella CSA (KPL, Inc) and biotinylated rabbit anti-Shigella sp., as well as 750 ng/mL of biotinylated chicken IgY (Jackson Immunoresearch, Inc.). PBSTB was introduced as the direction of rotation of the magnets was reversed, and the beads were released into the microflow cytometer for analysis. Sheath fluid, consisting of 0.1% Tween 20 (Surfact-Amps 20; Thermo Scientific, Rockford, IL, USA) in deionized water was continually pumped through the microflow cytometer with an Instech P625.66 peristaltic pump (Instech Laboratories) at a flow rate of 700 μL/min.
Additionally, we tested the feasibility of putting samples directly into a MagTrap channel preloaded with capture beads as an alternative to collecting samples in tubes containing beads. In these experiments, the beads were pumped into the MagTrap microchannel, trapped by the rotating magnets, and then incubated with the target. Tests were done to look into the effectiveness of introducing the sample in small (100 μl) and larger (1 mL) volumes, at 10 μL/min. Subsequent processing was carried out as described above.
Data Analysis
The analysis program used to process the data was written in LabWindows. The program plots the beads according to their internal fluorescence IDs. The user then selects each bead cluster and commands the program to calculate the SA-PE fluorescence associated with that cluster, as well as counting the number of data points (i.e. beads) in each cluster. The output provides a mean, standard deviation (SD) and standard error of the mean (SEM), as well as trimming off 5% of the data points with the lowest and highest SA-PE fluorescence signal within each cluster. The trimming of the data is done in order to remove any possible outliers in the data or crossover from neighboring beads. Additional trimming of the data was achieved through gating of scatter values above the PMT saturation limit (10 V). Data points with high scatter values can be caused by beads passing through the optical interrogation region in groups of two or more. For each experiment, data for every bead set (including the controls) was normalized by subtracting the mean SA-PE signal intensity for the BSA beads (negative control) and then dividing the resulting values by the mean fluorescence from the positive (chicken) control. Then, the mean and SEM of the fluorescence from the normalized data of at least three experiments was calculated and graphed.
The limit of detection of each target was calculated by performing one-way analysis of variance (ANOVA) test with a 95% confidence interval and Dunnett’s multiple comparison post test, using the signal from the BSA-coated bead set in each experiment as the baseline fluorescence. Significance was expressed at the 5% level. The lowest concentration tested that has p<0.01 was considered the limit of detection.
RESULTS AND DISCUSSION
System Performance During Continuous Operation
Using the MagTrap in conjunction with the microflow cytometer means that flow through the microflow cytometer continues during the sample processing steps; during this extended use, more bubbles entered the interrogation region. The bubbles usually originated where the optical fibers were inserted into the microflow cytometer and secured into place with epoxy. Over time, the epoxy bond to the PDMS, which holds the optical fibers in place, can weaken to permit air to enter the optical fiber channels. The new design of the microflow cytometer included two dead-end channels that cross the optical fiber channels, each having a single outlet to the open air at the top of the microflow cytometer chip. As the bubbles traveled along the path of least resistance, they passed into the dead-end “bubble trap” channels instead of entering the interrogation region of the microflow cytometer.
Multiplexed Detection of Bacteria
Multiplexed detection of E. coli 0157.H7, Salmonella, Shigella, and Listeria was performed using an integrated MagTrap and Microflow Cytometer system. Experiments in PBSTB buffer were performed using 102, 104 and 106 cells/mL concentrations, while those in 10% human serum were carried out in 102, 103, 104, 105, and 106 cells/mL for each target. Each assay utilized all the bead sets, while only one test antigen at a time, at a particular concentration was spiked into the buffer or serum samples. The assays included positive (chicken IgY) and negative (BSA) controls, and the presence of the entire bead array in every assay provided three additional negative controls in each experiment. While only one target was tested in each run, the presence of the chicken IgY target showed that the system can simultaneously detect multiple antigens. This approach also controlled for any cross reactivity between the antibodies or artifacts due to nonspecific binding. The same reagents were used in assays for all targets.
The stock solutions of cells used in serum experiments were suspended and stored in 100% human serum, at the highest cell concentration available, and then diluted 10x once in PBST, and with 10% HS for the subsequent 10x dilutions to achieve the desired concentrations in 10% HS. Figure 4 shows four graphs with dose-response curves for each of the targets in buffer and 10% HS. Observations of the absolute values for the positive control (anti-chicken IgY) over the course of the experiments showed that normalization corrected for any variation in the SA-PE fluorescence due to pipetting inconsistencies or photobleaching by room lights. The negative control (BSA) values did not vary, suggesting that stray room light was not problematic nor was there a major issue with nonspecific adsorption. Therefore, the fluorescence intensities of each target were normalized in each assay by subtracting the mean intensity of the BSA-coated beads and dividing by the mean value of the beads with captured anti-chicken IgY. Additionally, there were no notable differences in the positive and negative control signals between the buffer and serum samples.
Figure 4.
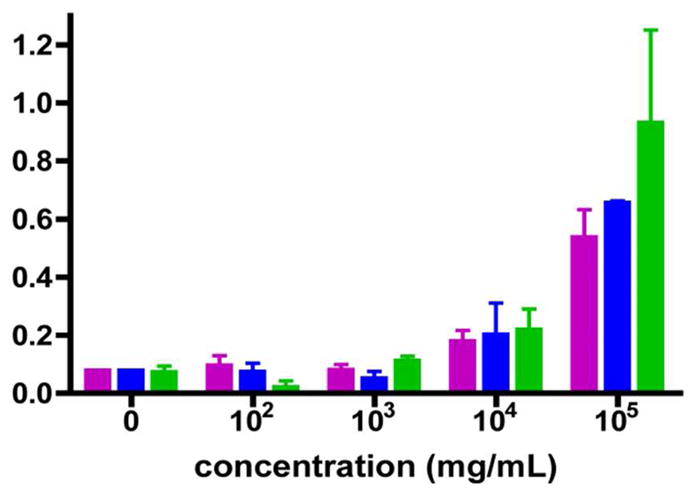
E. coli 0157l.H7 dose-response with three different incubation methods.
 E. coli intube incubation in 100 μL,
 E.coli in flow in 100 μL, and
 E. coli in flow in 1 mL. Error bars represent the standard deviations.
Dose-response curves show a similar response in both buffer and 10% HS (Figure 3), with the largest observed difference occurring during detection of Listeria. It appears that the intensity in the HS samples is higher than those in buffer. Another interesting observation was a small but consistent increase in SA-PE fluorescence on the beads coated with anti-Listeria antibody when bacteria other than Listeria were present in the sample. The antibody used on the Listeria capture beads has a broad specificity against all Listeria strains.34 While no SA-PE fluorescence was evident on these beads in the absence of bacteria, the bead set exhibited detectable fluorescence in the presence of any of the other bacteria. However, the intensity of this signal was never as high as the fluorescence obtained with 100 Listeria cells/mL, and the weak signals produced by the cross-species reactions did not increase with cell concentration. The actual responses to all bacteria species at any concentration were less than 0.2; the detailed data is displayed in the ESI. Though statistics indicate a limit of detection of 102 cells/mL Listeria, a more specific antibody would be preferable to ensure confidence that a positive response was specific for Listeria.
Figure 3.

Dose response curves for A) E. coli 0157.H7, B) Listeria sp., C) Salmonella CSA and D) Shigella sp. in buffer (PBSTB) and 10% human serum (HS).
 PBSTB,
 10% HS. Standard error bars from at least three experiments are shown.
Statistical analysis was performed using Prism (Graph Pad Software, Inc, La Jolla, CA, USA) and the limits of detection are reported in Table 1. Hypothesis testing was done using ANOVA and Dunnett’s post test and the results provided p<0.01 for all reported limit of detection concentrations. Listeria had the lowest limit of detection, while Shigella had the highest. Additionally, Salmonella was the only target with different limits of detection in PBSTB and 10% HS. While we report that the limits of detection actually measured for Salmonella in PBSTB is 106 cells/mL, or two orders of magnitude higher than that in 10% HS, it should be noted that no assays were performed using 105 cells/mL Salmonella in PBSTB. Therefore, the actual limit of detection might be lower, and looking at the dose-response curve in Figure 3, it can be deduced that 105 cells/mL are likely to be detectable. Salmonella was tested at 107 cells/mL as well as 106 cells/mL, simply because the signals were so much less intense than those produced by the other bacteria. The detection limits shown here are either equal to or slightly better than those obtained using the Microflow Cytometer with samples processed manually. Specifically, in the previous study for the detection of E. coli, Salmonella and Listeria, the detection limits were 105 cells/ml for Salmonella and Listeria and 104 cells/ml for E. coli.32 The range of detection limits measured suggests that the antibodies are the primary factor that limits the sensitivity and that the devices is very capable of detecting concentrations as low as 100 cells/mL if the binding affinities and specificities are sufficiently high.
Table 1.
Limits of detection of bacteria (cells/mL) in PBSTB and 10% serum (p<0.01).
| E. coli 0157.H7 | Listeria sp. | Salmonella CSA | Shigella sp. | |
|---|---|---|---|---|
| PBSTB | 104 | 102 (*) | 106 | 106 |
| 10% Serum | 104 | 102 (*) | 105 | 106 |
Values represent the lowest concentration actually detected. (*) See text for concerns about specificity of this particular anti-Listeria antibody.
Experiments were also performed that tested the ability of our system to simultaneously detect multiple pathogens in a single sample. In addition to testing the ability to measure all four targets simultaneously, samples with one target missing were tested to make sure false positives were not created by the highly abnormal mixture of targets. The samples tested were as follows: 1) all four pathogens, 2) all pathogens except E. coli, 3) all pathogens except Listeria, 4) all pathogens except Salmonella and 4) all pathogens except Shigella. In these experiments, all pathogens had concentrations of 1×10⁶ cells/ml. Results are shown in Table 2. The values for experiments with all four pathogens are averages with calculated standard error. The “+”(positive) and “−” (negative) designations for experiments that had three pathogens in each run represent the ability to obtain a signal that is above three times the standard error of the BSA negative control for each bead set. Overall, these results confirmed that the system is capable of multiplexed detection. The samples with four targets gave positive results for all four bead sets in all cases; intensities varied with the antibody affinities and were similar to those obtained in the dose-response studies. The sample without Listeria generated the only false positive; as seen in earlier studies, the beads coated with the anti-Listeria antibody tended to have a higher background signal. One of the seven assays containing the Salmonella yielded a false negative response, but Salmonella in general provided a weaker signal less distinguishable from the baseline.
Table 2.
Multiplexed detection of E. coli, Shigella, Listeria, and Salmonella in samples containing all four pathogens and all combinations of three pathogens.
| Sample composition | Bead Cluster (mean ± standard error)
|
|||||
|---|---|---|---|---|---|---|
| E. Coli 0157.H7 | Shigella sp. | Listeria sp. | Salmonella CSA | Chicken | BSA | |
| All four pathogens | 1.06 ± .08 | 0.08 ± 0.03 | 0.39 ± 0.08 | 0.03 ± 0.02 | 1 | 0 |
|
| ||||||
| Listeria, Shigella, Salmonella | − | + | + | − | + | − |
| Listeria, E. coli, Salmonella | + | − | + | + | + | − |
| E. coli, Shigella, Salmonella | + | + | + | + | + | − |
| Listeria, E. coli, Shigella | + | + | + | − | + | − |
Three standard errors above the mean of the BSA negative control were used to assign positive (+) or negative (−) signals.
On-Chip Target Capture and Pre-Concentration
Further studies were conducted (1) to test the feasibility of putting samples directly into a MagTrap channel preloaded with capture beads as an alternative to collecting samples in tubes containing beads and (2) to determine if the MagTrap could be used to pre-concentrate the target out of the sample. In the experiments described above, the incubation of magnetic beads and the bacterial targets for the initial capture step was done in a microcentrifuge tube, without shear and protected from light. In order to fully test the capability of the MagTrap microfluidic sample processing device, the target incubation was performed in the microchannel at a range of concentrations and compared to those with the external, static incubation.
In these experiments, the sample was pumped into the bead-filled MagTrap channel at 10 μL/min for initial target capture, followed by the sequential addition of the tracer antibody cocktail (5 min) and SA-PE (3 min) under the same conditions specified previously. Upon completion of the assay processing, the beads were released by reversing the rotation of the magnets directly into the microflow cytometer for analysis. Pre-concentration of targets with the MagTrap was evaluated at low target concentrations and compared to the results obtained with static bead incubation. E. coli in 10% HS at concentrations of 102, 103 and 104 cells/mL were incubated with the bead sets in the MagTrap channel. Either 100 μL or 1 mL was added at 10 μL/minute flow rate. The results are shown in Figure 4.
The signals generated using each of the three target incubation methods were similar for each concentration, except for the high concentration (105 cells/mL). While the 100 μL samples of 105 cells/mL E. coli have standard errors within the same ranges, the 1 mL sample of equal concentration produced a higher fluorescence intensity. The increased signal in larger volume can be attributed to the increased number of E. coli cells exposed to the capture beads. Because the 1 mL sample was introduced to the capture beads in flow (in the MagTrap) at 10 μL/min, the time to process the entire sample was 100 minutes. In contrast, the 100 μL sample was exposed to the capture beads for only 10 minutes. The fact that the signal did not increase 10-fold with continued supplement of cells over an additional 90 minutes suggests that the surface is saturated after exposure to a few hundred μL of 105 cells/mL. Most importantly, (1) the samples can be processed in a fully automated fashion with the addition of sample directly into a MagTrap preloaded with capture beads, (2) processing time is further reduced for small samples, and (3) the device is compatible with samples of varying volumes. The data suggest that this method can also be used to pre-concentrate target from complex sample matrices, but the extent to which that process is valuable will depend on the affinity of the antibody and the concentration of the target.
CONCLUSIONS
The spinning magnetic trap and microflow cytometer were integrated for automated sample processing and multiplexed detection of pathogens. Screening for E. coli, Salmonella, Shigella, and Listeria was performed simultaneously in buffer and serum samples in assays that included positive and negative controls. Automated assays could be performed in less than 20 minutes, compared to 90 minutes for manually processed samples. Furthermore, the system has the potential to be used for target pre-concentration as well as for separation of target from the sample matrix and exposure of captured target to a sequence of assay reagents.
Supplementary Material
Acknowledgments
This work was supported by NIH grant U01 A1075489 and ONR/NRL 6.2 work unit 6336. JV is a National Research Council postdoctoral fellow. The views presented are those of the authors and do not represent the opinion or policy of the National Institutes of Health, Department of Health and Human Service, the US Navy, or the Department of Defense.
ABBREVIATIONS
- SA-PE
streptavidin phycoerythrin
- BSA
bovine serum albumin
- HS
human serum
- PMMA
poly(methyl methacrylate)
- PBSTB
phosphate buffered saline with 0.1% Tween-20 and 1 mg/mL bovine serum albumin
- PMT
photomultiplier tube
Footnotes
Author Contributions
The manuscript was written through contributions of all authors. All authors have given approval to the final version of the manuscript.
Supporting Information. Available electronically are:
1. Fabrication of MagTrap
2. Fabrication of Microflow Cytometer
3. Binding of different bacterial species to beads coated with anti-Listeria antibody
This material is available free of charge via the Internet at http://pubs.acs.org.
References
- 1.Yager P, Edwards T, Fu E, Helton K, Nelson K, Tam MR, Weigl BH. Microfluidic diagnostic technologies for global public health. Nature. 2006;442(7101):412–418. doi: 10.1038/nature05064. [DOI] [PubMed] [Google Scholar]
- 2.Cermack M. Monitoring and telemedicine support in remote environments and in human space flight. Brit J Anaesth. 2006;97(1):107–114. doi: 10.1093/bja/ael132. [DOI] [PubMed] [Google Scholar]
- 3.Rao TP, Prasad K, Kala R, Gladis JM. Biomimetic sensors for toxic pesticides and inorganics based on Optoelectronic/Electrochemical transducers - An overview. Crit Rev Anal Chem. 2007;37(3):191–210. [Google Scholar]
- 4.Hodnik V, Anderluh G. Toxin Detection by Surface Plasmon Resonance. Sensors-Basel. 2009;9(3):1339–1354. doi: 10.3390/s9031339. [DOI] [PMC free article] [PubMed] [Google Scholar]
- 5.Dutse SW, Yusof NA. Microfluidics-Based Lab-on-Chip Systems in DNA-Based Biosensing: An Overview. Sensors-Basel. 2011;11(6):5754–5768. doi: 10.3390/s110605754. [DOI] [PMC free article] [PubMed] [Google Scholar]
- 6.Dupuy AM, Lehmann S, Cristol JP. Protein biochip systems for the clinical laboratory. Clin Chem Lab Med. 2005;43(12):1291–1302. doi: 10.1515/CCLM.2005.223. [DOI] [PubMed] [Google Scholar]
- 7.Madou M, Zoval J, Jia GY, Kido H, Kim J, Kim N. Lab on a CD. Annu Rev Biomed Eng. 2006;8:601–628. doi: 10.1146/annurev.bioeng.8.061505.095758. [DOI] [PubMed] [Google Scholar]
- 8.Lee LJ, Yang ST, Lai SY, Bai YL, Huang WC, Juang YJ. Microfluidic enzyme-linked immunosorbent assay technology. Adv Clin Chem. 2006;42:255–295. [PubMed] [Google Scholar]
- 9.Liana DD, Raguse B, Gooding JJ, Chow E. Recent advances in paper-based sensors. Sensors (Basel) 2012;12(9):11505–26. doi: 10.3390/s120911505. [DOI] [PMC free article] [PubMed] [Google Scholar]
- 10.Bange A, Halsall HB, Heineman WR. Microfluidic immunosensor systems. Biosens Bioelectron. 2005;20(12):2488–503. doi: 10.1016/j.bios.2004.10.016. [DOI] [PubMed] [Google Scholar]
- 11.Kim JS, Ligler FS. Microflow Cytometer. Microflow Cytometer. 2010:1–379. [Google Scholar]
- 12.Zourob ME, Sauna, Turner, Anthony PF. Principles of Bacterial Detection: Biosensors, Recognition Receptors and Microsystems. Springer; New York: 2008. [Google Scholar]
- 13.Woolley AT, Hadley D, Landre P, de Mello AJ, Mathies RA, Northrup MA. Functional Integration of PCR Amplification and Capillary Electrophoresis in a Microfabricated DNA Analysis Device. Anal Chem. 1996;68(23):4081–4086. doi: 10.1021/ac960718q. [DOI] [PubMed] [Google Scholar]
- 14.Liu CN, Toriello NM, Mathies RA. Multichannel PCR-CE microdevice for genetic analysis. Anal Chem. 2006;78(15):5474–9. doi: 10.1021/ac060335k. [DOI] [PubMed] [Google Scholar]
- 15.Prakash AR, Rosa C, Fox J, Kaler KIS. Identification of respiratory pathogen Bordetella Pertussis using integrated microfluidic chip technology. Microfluidics and Nanofluidics. 2008;4(5):451–456. [Google Scholar]
- 16.Yager P, Edwards T, Fu E, Helton K, Nelson K, Tam MR, Weigl BH. Microfluidic diagnostic technologies for global public health. Nature. 2006;442(7101):412–8. doi: 10.1038/nature05064. [DOI] [PubMed] [Google Scholar]
- 17.Laschi S, Miranda-Castro R, González-Fernández E, Palchetti I, Reymond F, Rossier JS, Marrazza G. A new gravity-driven microfluidic-based electrochemical assay coupled to magnetic beads for nucleic acid detection. Electrophoresis. 2010;31(22):3727–3736. doi: 10.1002/elps.201000288. [DOI] [PubMed] [Google Scholar]
- 18.Grodzinski P, Liu R, Yang J, Ward MD. Microfluidic system integration in sample preparation chip-sets - a summary. P Ann Int Ieee Embs. 2004;26:2615–2618. doi: 10.1109/IEMBS.2004.1403751. [DOI] [PubMed] [Google Scholar]
- 19.Chin CD, Linder V, Sia SK. Lab-on-a-chip devices for global health: past studies and future opportunities. Lab Chip. 2007;7(1):41–57. doi: 10.1039/b611455e. [DOI] [PubMed] [Google Scholar]
- 20.Devadhasan JP, Kim S, An J. Fish-on-a-chip: a sensitive detection microfluidic system for Alzheimer’s disease. J Biomed Sci. 2011;18:33. doi: 10.1186/1423-0127-18-33. [DOI] [PMC free article] [PubMed] [Google Scholar]
- 21.Zaytseva NV, Goral VN, Montagna RA, Baeumner AJ. Development of a microfluidic biosensor module for pathogen detection. Lab Chip. 2005;5(8):805–11. doi: 10.1039/b503856a. [DOI] [PubMed] [Google Scholar]
- 22.Kwon Y, Hara CA, Knize MG, Hwang MH, Venkateswaran KS, Wheeler EK, Bell PM, Renzi RF, Fruetel JA, Bailey CG. Magnetic bead based immunoassay for autonomous detection of toxins. Anal Chem. 2008;80(22):8416–23. doi: 10.1021/ac8010044. [DOI] [PubMed] [Google Scholar]
- 23.Dharmasiri U, Witek MA, Adams AA, Soper SA. Microsystems for the capture of low-abundance cells. Ann Rev Anal Chem. 2010;3:409–31. doi: 10.1146/annurev.anchem.111808.073610. [DOI] [PubMed] [Google Scholar]
- 24.Beyor N, Yi L, Seo TS, Mathies RA. Integrated capture, concentration, polymerase chain reaction, and capillary electrophoretic analysis of pathogens on a chip. Anal Chem. 2009;81(9):3523–8. doi: 10.1021/ac900060r. [DOI] [PMC free article] [PubMed] [Google Scholar]
- 25.Committee on Effectiveness of National Biosurveillance Systems: BioWatch and the Public Health System, N. R. C. BioWatch and Public Health Surveillance:Evaluating Systems for the Early Detection of Biological Threats. The National Academies Press; Washington, DC: 2011. [PubMed] [Google Scholar]
- 26.Regan JF, Makarewicz AJ, Hindson BJ, Metz TR, Gutierrez DM, Corzett TH, Hadley DR, Mahnke RC, Henderer BD, Breneman JWt, Weisgraber TH, Dzenitis JM. Environmental monitoring for biological threat agents using the autonomous pathogen detection system with multiplexed polymerase chain reaction. Anal Chem. 2008;80(19):7422–9. doi: 10.1021/ac801125x. [DOI] [PubMed] [Google Scholar]
- 27.Ozanich RM, Jr, Bruckner-Lea CJ, Warner MG, Miller K, Antolick KC, Marks JD, Lou J, Grate JW. Rapid multiplexed flow cytometric assay for botulinum neurotoxin detection using an automated fluidic microbead-trapping flow cell for enhanced sensitivity. Anal Chem. 2009;81(14):5783–93. doi: 10.1021/ac9006914. [DOI] [PubMed] [Google Scholar]
- 28.Verbarg J, Kamgar-Parsi K, Shields AR, Howell PB, Jr, Ligler FS. Spinning magnetic trap for automated microfluidic assay systems. Lab Chip. 2012;12(10):1793–9. doi: 10.1039/c2lc21189k. [DOI] [PMC free article] [PubMed] [Google Scholar]
- 29.Howell PBJ, Eitel R, Golden JP, Ligler FS. US 2011/0188339 A1. Rotationally Actuated Magnetic Bead Trap and Mixer. 2011
- 30.Golden JP, Verbarg J, Howell PB, Jr, Shriver-Lake LC, Ligler FS. Automated processing integrated with a microflow cytometer for pathogen detection in clinical matrices. Biosens Bioelectron. 2012 doi: 10.1016/j.bios.2012.08.015. [DOI] [PMC free article] [PubMed] [Google Scholar]
- 31.Golden JP, Kim JS, Erickson JS, Hilliard LR, Howell PB, Anderson GP, Nasir M, Ligler FS. Multi-wavelength microflow cytometer using groove-generated sheath flow. Lab Chip. 2009;9(13):1942–50. doi: 10.1039/b822442k. [DOI] [PMC free article] [PubMed] [Google Scholar]
- 32.Kim JS, Anderson GP, Erickson JS, Golden JP, Nasir M, Ligler FS. Multiplexed Detection of Bacteria and Toxins Using a Microflow Cytometer. Anal Chem. 2009;81(13):5426–5432. doi: 10.1021/ac9005827. [DOI] [PMC free article] [PubMed] [Google Scholar]
- 33.Taitt CR, Shriver-Lake LC, Anderson GP, Ligler FS. Surface Modification and Biomolecule Immobilization on Polymer Spheres for Biosensing Applications. In: Hurst SJJ, editor. Biomedical Nanotechnology. Vol. 726. Humana Press; 2011. pp. 77–94. [DOI] [PubMed] [Google Scholar]
- 34.KPL Inc. Affinity Purified BacTrace(R) Antibody to Listeria Species, High Sensitivity: Produced in Goat. [Google Scholar]
Associated Data
This section collects any data citations, data availability statements, or supplementary materials included in this article.