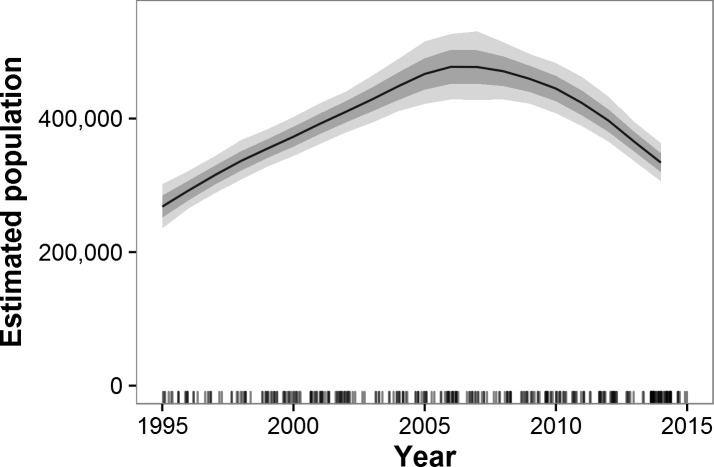
Figure 2. Estimated trends in elephant populations for GEC study areas with historical data available, 1995–2014.
Results are based on 1,000 Monte Carlo replicates. Dark shaded area indicates ±1 SD; light shaded area indicates 95% confidence interval. Tick marks on x-axis indicate dates of data points used in model; dates are perturbed slightly to prevent overlap.

