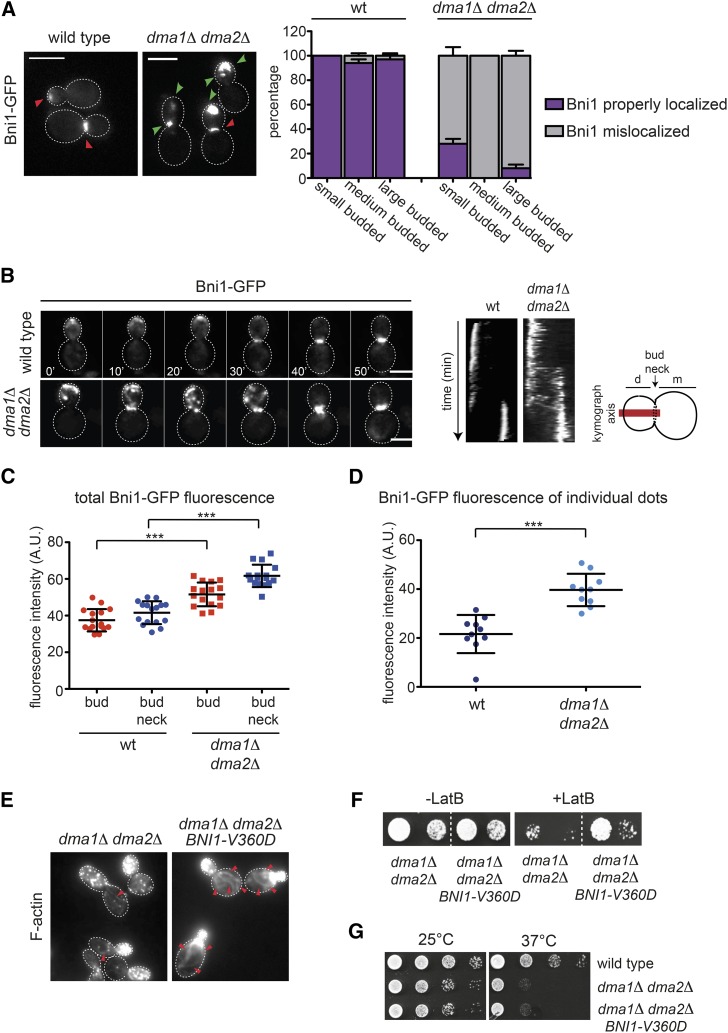
Figure 3.
Bni1 localization is impaired in dma1Δ dma2Δ mutant cells. (A) Logarithmically growing cultures of wild-type and dma1Δ dma2Δ expressing Bni1-GFP were imaged at 25°. Z-stacks max-projections (11 planes at 0.3-μm spacing) are shown. Red arrowheads indicate normal localization of Bni1, while green arrowheads indicate aberrant localization. Bar, 5 μm. The percentage of budded cells with properly localized or mislocalized Bni1 was scored in different categories of cells in relation to bud size (n ≥ 200; errors bars: SD). (B) Wild-type and dma1Δ dma2Δ expressing Bni1-GFP were filmed at room temperature (21°) with 1 min time lapse (n ≥ 45). Z-stacks (31 planes at 0.2-μm spacing) were deconvolved with Huygens and max-projected. Kymographs were created by drawing a 5-pixel-thick line across the daughter–mother axis, as indicated by the cartoon. Bar, 5 μm. (C) Fluorescence intensities of Bni1-GFP signals inside the bud or at the bud neck were measured with ImageJ in medium and large budded cells, respectively, within an oval region of 420 pixels in size after background subtraction (n = 16). A horizontal line in each dot plot indicates the mean ± SD. (D) Fluorescence intensities of Bni1-GFP signals were measured in individual dots within a region of 11 × 12 pixels after background subtraction (n = 10). A horizontal line in each dot plot indicates the mean ± SD. (E) dma1Δ dma2Δ cells lacking or carrying a centromeric plasmid to express the hyperactive BNI1-V360D allele were fixed and stained by Alexa-546 phalloidin to analyze F-actin structures. Arrowheads indicate visible actin cables. Bar, 5 μm. (F) Serial dilutions of strains with the indicated genotypes were spotted on YEPD plates either lacking or containing 5 μM LatB and incubated at 25°. (G) Serial dilutions of cells with the indicated genotypes were spotted on selective (SD −Trp) plates and incubated at 25° and 37°.

