Abstract
Rats subjected to bilateral common carotid arteries (CCAs) occlusion or 2-vessel occlusion (2VO) have been used as animal models of subcortical ischemic vascular dementia (SIVD). However, these models possess an inherent limitation in that cerebral blood flow (CBF) drops sharply and substantially after ligation of CCAs without vascular risk factors and causative small vessel changes. We previously reported a novel rat model of 2-vessel gradual occlusion (2VGO) in which ameroid constrictors (ACs) were placed bilaterally in the CCAs of Wistar-Kyoto rats. To simulate SIVD pathology more closely, we applied ACs in spontaneously hypertensive rats (SHRs), which naturally develop small vessel pathology, and compared their phenotypes with SHR-2VO and sham-operated rats. The mortality rate of the SHR-2VGO was 0% while that of the SHR-2VO was 56.5%. The CBF of the SHR-2VO dropped to 50% of the baseline level at 3 h, whereas the SHR-2VGO showed a gradual CBF reduction reaching only 68% of the baseline level at seven days. The SHR-2VGO showed slowly evolving white matter abnormalities and subsequent spatial working memory impairments of a similar magnitude to the remaining SHR-2VO at 28 days. We suggest the SHR-2VGO robustly replicates selective aspects of the pathophysiology of SIVD with low mortality rate.
Keywords: Vascular dementia, chronic cerebral hypoperfusion, ameroid constrictor, white matter change, spontaneously hypertensive rat
Introduction
Vascular dementia (VaD) is the second most common cause of dementing illnesses after Alzheimer’s disease (AD). Approximately half of the cases of VaD are explained by subcortical ischemic vascular dementia (SIVD),1 which is characterized by lacunar infarctions in the basal ganglia and ischemic white matter changes. Loss of vasomotor reactivity in the small vessels due to vascular risk factors such as hypertension2 and resultant chronic cerebral hypoperfusion with blood-brain barrier (BBB) disruption and glial activation may underlie the white matter changes.3,4
To mimic the expected pathological changes and explore the underlying mechanisms, bilateral common carotid artery (CCA) or 2-vessel occlusion (2VO) model in rats has been frequently used5 and may become important once genetically-modified rats are widely available. The 2VO model exhibits characteristic features of SIVD, such as white matter damage,6,7 and cognitive impairment.5,8,9 Nevertheless, this model possesses an inherent limitation in that cerebral blood flow (CBF) drops sharply after occlusion and substantially after the ligation of the CCAs and remains low (30–45% of the baseline level) for two to three days. This phenomenon therefore creates hypoxic-ischemic conditions too severe to replicate ‘chronic’ cerebral hypoperfusion in the brain.10 Following this acute phase, CBF gradually recovers, but still remains relatively low (50–90%) for eight weeks to three months post-operation (chronic phase).11,12 Although the sustained oligemia in the chronic phase is believed to better replicate chronic cerebral hypoperfusion associated with SIVD, the contribution of the preceding acute phase to the neuropathological and behavioral consequences is an ongoing concern.8 In our previous study, we established a novel Wistar Kyoto rat 2-vessel gradual occlusion (WKY-2VGO) model that eliminated the abrupt acute phase and CBF gradually decreased to the level in the chronic phase, using the ameroid constrictor (AC) device, which predictably induces gradual narrowing of the CCAs. The chronic cerebral hypoperfusion although temporally segregated reproduced selective white matter damage and subsequent working memory impairment.13
The existing brain hypoperfusion models lack concomitant vascular disease risk factors and causative small vessel changes that may lead to alterations in blood flow and cerebral autoregulation. This scenario may be resolved when hypoperfusion could be induced in spontaneously hypertensive rats (SHR). However, SHRs subjected to the bilateral CCA occlusion (SHR-2VO) have shown greater CBF reduction accompanied by more extensive cerebral infarcts and demyelinating changes and higher mortality rate (72%; 78 of 108) than the normotensive counterpart WKY rats (16%; 7 of 43).14,15 Besides the high mortality, severe CBF reduction with marked infarctions may not adequately represent SIVD. In the current study, we tested ACs in SHRs and established the SHR-2VGO model which may more precisely mimic SIVD because of the underlying small vessel pathology.
Materials and methods
All procedures were performed in accordance with the guidelines for animal experimentation from the ethical committee of Kyoto University and were reported in accordance with the ARRIVE guidelines.
Animals
We used 12–14-weeks-old male SHRs (weighing 286 to 346 g; Japan SLC), which were given access to food and water ad libitum.
Ameroid constrictor
The AC (Research Instruments NW, OR, USA) consists of a stainless steel casing surrounding a hygroscopic casein material that has an internal lumen. The casein component gradually absorbs water and consequently swells, leading to predictable narrowing and occlusion of the arterial lumen that it encases. The inner diameter was 0.5 mm, the outer diameter 3.25 mm and the length 1.28 mm.
Study design
The SHRs were divided into three groups: 2VGO, 2VO and sham groups. The CBF in the frontal cortices which were measured by laser speckle flowmetry (LSF; Omega Zone; Omegawave, Tokyo, Japan), blood pressure and pulse rates were monitored before operation and at 3 h, and 1, 3, 7, 14 and 28 days post-operation. Immediately after each CBF measurement, rats were euthanized for histological evaluation of demyelinating changes and glial activation at 1 and 3, 7, 14 and 28 days post-operation. Four to 10 animals in each group were used for each examination. Spatial working memory was assessed in 10–14 animals in each group by the Y-maze test at 28 days post-operation.
Surgical procedure
The bilateral CCAs were exposed through a midline cervical incision during anesthesia that was induced with 1.5% isoflurane and maintained with 1% isoflurane using room air as carrier gas. In the SHR-2VGO group, SHRs were subjected to surgical placement of ACs on the CCAs bilaterally, whereas in the SHR-2VO group, the bilateral CCAs were ligated with silk sutures. All procedures were performed using a feedback-controlled heating pad with body temperature maintained at 37℃ and were accomplished within 20 min. All further analyses were conducted in a blinded fashion to the surgery type.
CBF, blood pressure and pulse rate measurement
CBF in the frontal cortices was recorded by laser speckle blood flow imager (Omega Zone; Omegawave) through a midline scalp incision under anesthesia with isoflurane (1.5%). The region of interest was consistently set as a circle with 3 mm diameter at 2 mm posterior and 3 mm lateral to bregma. CBF was expressed as a percentage of the baseline level. The blood pressure and pulse rate were measured with the cuff on the base of the tail during measurement of CBF (BP-98E; Softron, Tokyo, Japan). The mean CBF, blood pressure and pulse rate of 10 measurements in each record were determined. All procedures were performed using a feedback-controlled heating pad with body temperature maintained at 37℃.
Histological evaluation of demyelinating changes and glial activation
Rats were euthanized with sodium pentobarbital and perfused transcardially with 0.01 mol/l phosphate-buffered saline and the brains were then fixed with 4% paraformaldehyde in 0.1 mol/l phosphate buffer (PB, pH 7.4). The brains and optic nerves were further immersion fixed for 12 h in 4% paraformaldehyde in 0.1 mol/l PB (pH 7.4). Coronal brain blocks were embedded in paraffin for hematoxylin-eosin (H&E), Klüver-Barrera (KB) staining, and immunohistochemistry and rest of the brain was stored in 15% sucrose in 0.1 MPB (pH7.4) for immunofluorescence and fluoromyelin staining. Paraffin wax-embedded coronal sections of the brain (6 µm thick) were cut on a microtome and frozen coronal blocks (20 µm thick) were cut on a cryostat. The number of rats with infarcted lesions in the forebrain and pyknotic pyramidal neurons in the hippocampal CA1 and CA3 regions were measured in H&E stained sections. These brains were also analyzed with immunohistochemical staining for glial fibrillary acidic protein (GFAP). They were also evaluated after KB staining for myelin loss. The severity of the white matter lesions in the medial and lateral parts of the corpus callosum was graded as normal (Grade 0), disarrangement of the nerve fibers (Grade 1), the formation of marked vacuoles (Grade 2), and the disappearance of myelinated fibers (Grade 3), according to the established criteria.6 Fluoromyelin staining was also used to assess myelin integrity. Free-floating sections were mounted onto slides and were incubated with FluoroMyelin Green fluorescent myelin stain (1:300, Molecular probes) for 20 min at room temperature. Semi-quantification of the intensity of fluoromyelin staining was conducted on 10× magnification images and viewed using a Nikon upright microscope. Intensity of fluoromyelin staining were analyzed by quantifying mean intensity of the entire field of view for three brain sections of each animal, using Image J analysis software with no thresholds set. Paraffin sections were also immunostained for ionized calcium binding adaptor molecule 1 (Iba1; a marker of microglia; Wako, Osaka, Japan) and GFAP (astrocyte; DAKO, Glostrup, Denmark). For immunohistochemical staining, they were incubated overnight with a rabbit anti-Iba1 antibody and a rabbit anti-GFAP antibody. Subsequently, the sections were exposed to appropriate biotinylated secondary antibodies (1:200; Vector Laboratories) and were visualized with 0.01% diaminobenzidine tetrahydrochloride and 0.005% H2O2 in 50 mmol/l Tris-HCl (pH 7.6). Two to three regions of interest (ROI) (0.6 × 1.0 mm2) were randomly selected in the medial and lateral parts of the corpus callosum. We counted the number of Iba1-immunopositive microglia, and GFAP-immunopositive astrocytes in each ROI and averaged the results to yield the mean density of each cell type (mean ± SE/0.6 mm2). Immunofluorescence staining was performed by incubating the free-floating sections overnight with anti-tumor necrosis factor-α (TNF-α, 1:100, Thermo Scientific; inflammatory marker) and anti-Fibrinogen (1:100; Dako; BBB leakage marker) antibodies. After washing with PBS, they were incubated with the appropriate secondary antibodies (1:200; Invitrogen) for 1 h at room temperature. Intensity of each staining was measured using Image J software as mentioned above.
Four to 10 animals in each group were assessed for each type of staining at each time point.
Y-maze test for spatial working memory assessment
Spatial working memory was assessed by the Y-maze test, as described previously.16 The Y-maze test was conducted during the dark period (7:00 to 11:00 PM) 28 days post-operation. This task is based on spontaneous alternation behavior and is used to measure spatial working memory. The maze consists of three arms (425 mm long, 225 mm high, and 145 mm wide, labeled A, B, or C) diverging at a 120° angle from the central point. The experiments were performed in a dimly illuminated room, and the floor of the maze was cleaned with super hypochlorous water-soaked paper after each rat was tested to avoid olfactory cues. Each rat was placed at the end of the start arm and allowed to move freely through the maze during an 8-min session without reinforcers, such as food, water, or electric foot shock. The sequence of arm entries was manually recorded; a rat was considered to have entered an arm when all four paws were positioned in the arm runway. An actual alternation was defined as entries into all the three arms on consecutive occasions (e.g. the sequence, ABCBCBCA is counted as two alternations, with the first consecutive ABC and the last consecutive BCA out of six consecutive occasions; 33% alternations). The maximum alternation was subsequently calculated by measuring the total number of arm entries minus 2 and the percentage of alternation was calculated as (actual alternation/maximum alternation) × 100. The total number of arms entered during the sessions (reflecting locomotor activity) was also recorded. Rats that entered arms less than eight times during the test were eliminated because the data obtained from those rats were not considered to reflect precise alternation. None of the 34 rats used in this study exhibited total arm entries of less than eight times.
Statistical analysis
All values are expressed as mean ± SEM. One-way analysis of variance was used to evaluate significant differences among groups (except where otherwise stated) followed by a post hoc Tukey test or Tukey–Kramer test. Differences with P < 0.05 were considered significant in all statistical analyses.
Results
Mortality rates and body weight changes of rats
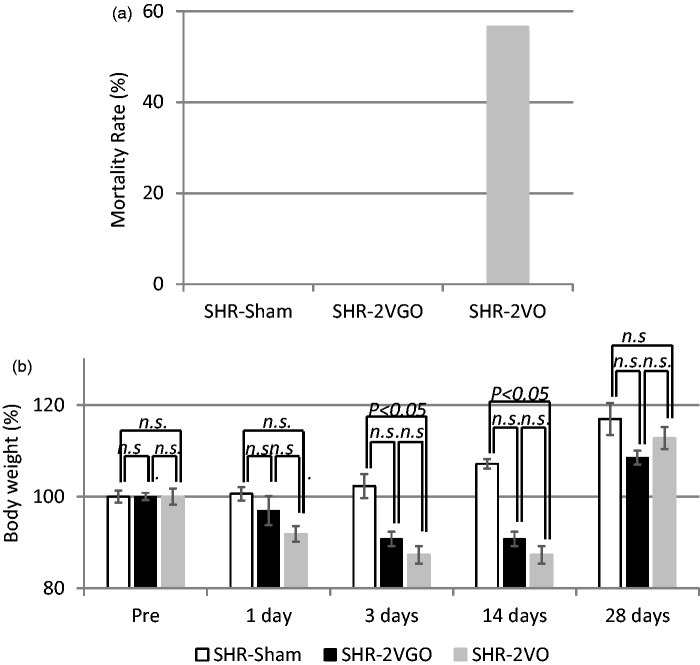
The mortality rate in the SHR-2VGO group was 0.0% (0/12). This was significantly lower than that of the SHR-2VO group, which was 56.5% (13/23) in accordance with previous reports (Figure 1a).14 Rats tended to die especially within a few days post-operation. In the sham group, all of 21 rats survived until euthanasia.
Figure 1.
a) The mortality rate in each group. The value is expressed as a percentage. (b) The temporal profile of body weight in each group. The value is expressed as a percentage (±SEM) of the baseline level (100%). Four to 10 animals in each group were used at each point.
Body weight decreased in both the 2VGO and 2VO groups but to a lesser extent in the 2VGO group. A significant decrease in body weight was found in the SHR-2VO group compared to the sham group at three days post-operation (Sham group, 102.3 ± 2.6% vs. 2VO group, 87.2 ± 1.8%; P < 0.05) and 14 days post-operation (Sham group, 107.1 ± 1.0% vs. 2VO group, 87.2 ± 1.8%; P < 0.05). Both groups of rats started to regain body weight at 14 days and the body weight was not significantly different between the three groups at 28 days (Figure 1b).
Temporal profiles of CBF recorded by LSF
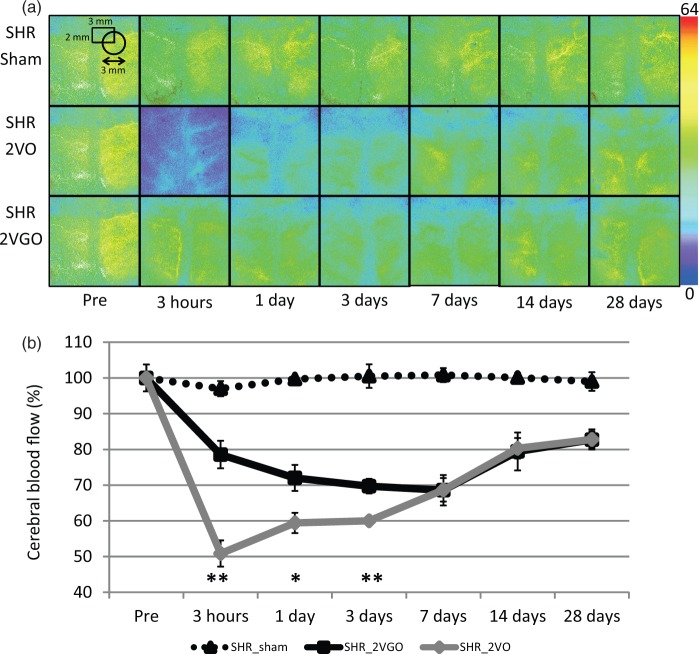
In the 2VO group, CBF dropped rapidly to 50.8 ± 3.6% of the baseline level at 3 h post-operation but started to recover at three days and reached to 82.7 ± 2.8% at 28 days. In contrast, in the 2VGO group, the acute phase observed in the 2VO group was absent. CBF started to decrease at 3 h (78.2 ± 3.8%), and reached a maximum reduction at seven days (68.3 ± 4.2%), before gradually recovering at 28 days (82.4 ± 2.3%). In the sham group, there was no apparent change of CBF. Two-way repeated-measures analysis of variance showed a significant interaction between group and time (F(12, 53) = 4.72, P < 0.001) and significant differences between the 2VGO and 2VO groups at 3 h, and one and three days (Figure 2(a) and (b)).
Figure 2.
(a) Representative CBF images of laser speckle flowmetry in each group at indicated time intervals. The value in each image indicates relative CBF that is expressed as a percentage (±SEM) of the baseline level (100%). Four to six animals in each group were used at each point. (b) The temporal profile of CBF in each group. *P < 0.05, **P < 0.01, 2VGO vs. 2VO.
The systolic blood pressure (SBP) of the surviving rats ranged from 179.0 ± 7.2 to 214.0 ± 4.7 mmHg and did not differ significantly among the three groups at any postoperative intervals until 28 days. In the sham control group, SBP were 186 ± 7.26 mmHg at pre-operation, 198.5 ± 11.9 mmHg at 3 h, 182.28 ± 16.6 at one day, 183.0 ± 5.3 at three days, 214.0 ± 4.7 at seven days, 203.0 ± 6.6 at 14 days and 183.1 ± 3.7 at 28 days. In the 2VGO group, SBP were 196.5 ± 18.5 mmHg at 3 h, 206.2 ± 12.4 at one day, 191.2 ± 11.5 at three days, 180.6 ± 2.4 at seven days, 196.2 ± 9.7 at 14 days and 206.2 ± 5.8 at 28 days. In the 2VO group, SBP were 200.5 ± 22.5 mmHg at 3 h, 205.3 ± 33.7 at one day, 168.3 ± 4.0 at three days, 179.0 ± 7.2 at seven days, 182.4 ± 3.1 at 14 days and 207.7 ± 4.4 at 28 days.
Y-maze test for spatial working memory assessment
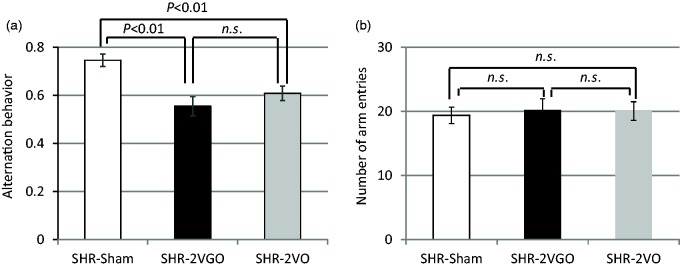
In the 2VGO and 2VO groups, the percentage of alternation behaviors (used as a reflection of spatial working memory) was significantly decreased (Figure 3a), whereas the number of arm entries did not differ significantly among the three groups at 28 days (Figure 3b).
Figure 3.
(a, b) Histograms showing spatial working memory impairment (a) and the locomotor activity (b) measured by Y-maze test at 28 days post-operation in the sham (n = 10), 2VGO (n = 10) and 2VO (n = 14) groups.
Histological analysis of gray matter damage
Brain infarcted areas or cortical gliosis were not apparent and there were no pyknotic neurons in the hippocampal CA1 region at 28 days in any surviving rats.
Histological analysis of white matter damage
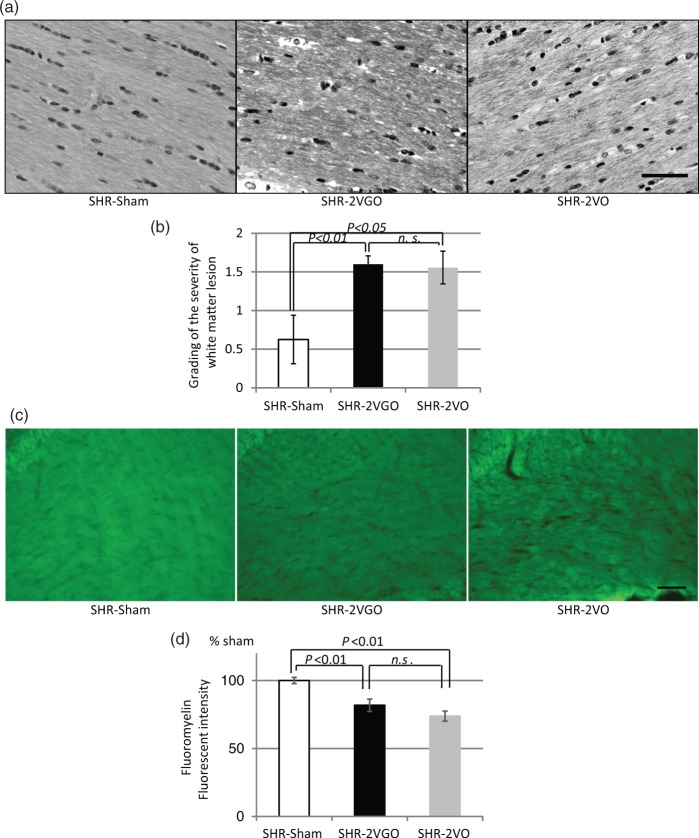
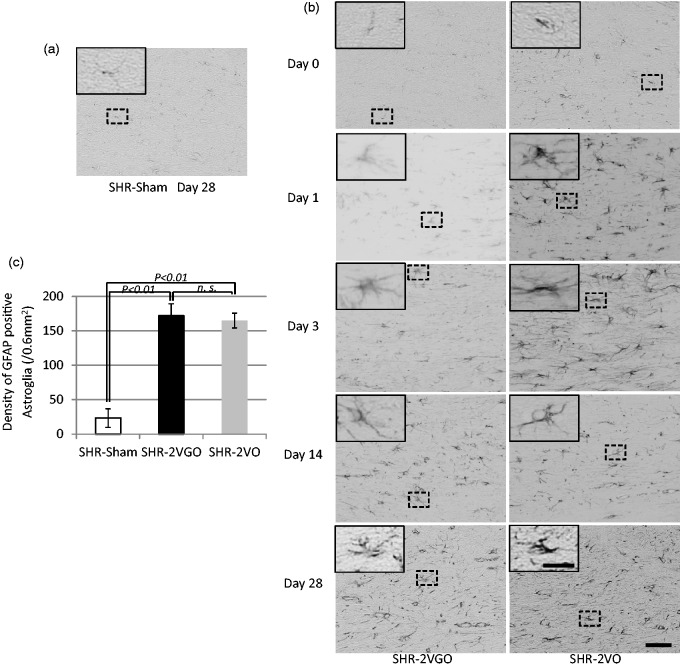
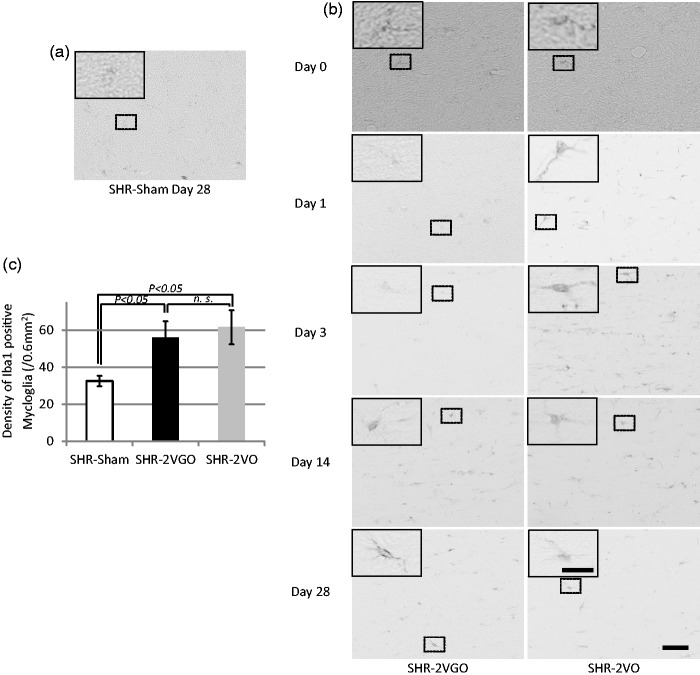
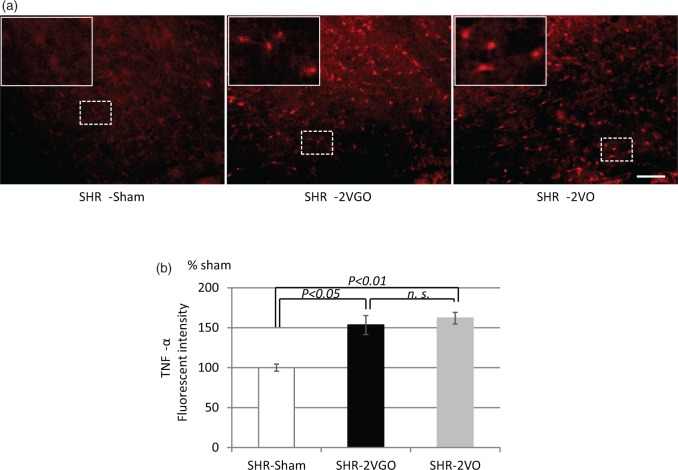
Semi-quantitative analysis with the KB grading score and fluoromyelin intensity in the corpus callosum indicated that the white matter damage was significantly greater in both the 2VGO and 2VO groups compared with the sham group at 28 days post-operation (Figure 4(a) to (d)). Although no statistical analysis was performed due to the survival bias at the early time points, observations were made from GFAP and Iba-1 immunostained sections in the 2VGO compared to 2VO groups and data analyzed at 28 days post-operation. The number of reactive GFAP-immunopositive astrocytes appeared to gradually increase in the 2VGO group, whereas there was a more rapid increase at one and three days in the 2VO group (Figure 5(a) and (b)). The density of GFAP-immunopositive astrocytes was significantly greater in both the 2VGO and 2VO groups compared to the sham group at 28 days (Figure 5(b) and (c)). The number of Iba1-immunopositive microglia appeared unchanged at 1 or 3 days in the 2VGO group while there was a rapid increase in the 2VO group (Figure 6(a) and (b)). The density of Iba1-immunopositive microglia in both the 2VGO and 2VO groups remained significantly greater than the sham group at 28 days (Figure 6(b) and (c)). TNF-α expression was also significantly increased in both the 2VGO and 2VO groups than the sham control group at 28 days (Figure 7(a) and (b)). However, immunofluorescence staining for fibrinogen did not show overt BBB disruption in any group at 28 days post-operation (data not shown). There were no significant differences between the 2VGO and the remaining 2VO rats in these histological analysis of white matter damage at 28 days post-operation.
Figure 4.
(a, b) Representative images of Klüver-Barrera staining in the corpus callosum (upper panels) with histogram showing the grading of the white matter lesions at 28 days post-operation in the sham (n = 4), 2VGO (n = 10) and 2VO (n = 9) groups. Scale bar, 50 µm. (c, d) Representative images of fluoromyelin staining in the corpus callosum (upper panels) with histogram showing the fluorescent intensity at 28 days post-operation in the sham (n = 4), 2VGO (n = 4) and 2VO (n = 4) groups. Scale bar, 100 µm. The value is expressed as a percentage (±SEM) of the fluorescent intensity of sham-operated rats (100%).
Figure 5.
(a, b, c) Representative images of immunostaining for glial fibrillary acidic protein (GFAP) in the corpus callosum at indicated time intervals with histogram showing the density of GFAP immunopositive astroglia at 28 days post-operation in the sham (n = 4), 2VGO (n = 6) and 2VO (n = 6) groups. The inset showing a magnified image of the indicated area. Scale bar, 50 µm; insets, 20 µm.
Figure 6.
(a, b, c) Representative images of immunostaining for ionized calcium binding adaptor molecule 1 (Iba1) in the corpus callosum at indicated time intervals with histogram showing the density of Iba1 immunopositive mycloglia at 28 days post-operation in the sham (n = 4), 2VGO (n = 5) and 2VO (n = 4) groups. The inset showing a magnified image of the indicated area. Scale bar, 50 µm; insets, 20 µm.
Figure 7.
(a, b) Representative images of immunefluorescent staining for TNF-α in the corpus callosum (upper panels) with histogram showing the fluorescent intensity at 28 days post-operation in the sham (n = 4), 2VGO (n = 4) and 2VO (n = 4) groups. Scale bar, 100 µm. The value is expressed as a percentage (±SEM) of the fluorescent intensity of sham-operated rats (100%).
Discussion
Our findings suggest that the gradual narrowing of the bilateral CCAs using the AC device in SHR-2VGO model could help circumvent the acute phase of CBF reduction and resultant acute inflammatory responses observed in the SHR-2VO model. We noted demyelinating changes with slowly evolving inflammatory and glial responses in the white matter in the 2VGO model. White matter changes were substantial in both the SHR-2VGO and SHR-2VO groups, both of which might show more extensive histological abnormalities in the white matter compared to WKY-2VGO group.13 The differences in mortality rate and body weight loss between the SHR-2VGO and SHR-2VO groups may reflect milder CBF reduction in the SHR-2VGO group compared to SHR-2VO. The Y-maze tests showed significant spatial working memory impairment, which may be attributed to white matter damage because neuropathological changes were not clearly apparent in the cortex or hippocampus of both the SHR-2VGO and SHR-2VO groups at 28 days post-surgery.
By applying ACs to SHRs using the same procedure adopted in WKY-2VGO, we successfully segregated the chronic cerebral hypoperfusion from the acute ischemia. SHRs do not reveal apparent morphological changes in the small vessels17 but show remarkable endothelial dysfunction leading to reduction of phosphorylated endothelial nitric oxide synthase expression.18 The latter change may explain why SHRs exhibit impairment of leptomeningeal collateral growth after unilateral common carotid artery occlusion,19 suggesting that sustained hypertension adversely affects the capacity of the cerebrovasculature to adaptively respond to chronic cerebral hypoperfusion. Although there is a limitation in that we did not directly compare SHR with WKY in this current study, the pathological changes in small vessels of SHRs might underlie more extensive white matter changes in SHR-2VGO than in WKY-2VGO (Grade of KB staining; SHR-2VGO, 1.60 ± 0.10 vs. WKY-2VGO, 1.18 ± 0.18 at 28 days),13 higher mortality rate (SHR-2VO, 56.5% vs. WKY-2VO, 13.7%)13 and more CBF reduction recorded by LSF in SHR-2VO than WKY-2VO (SHR-2VO, 60.2 ± 0.80% of the baseline level vs. WKY-2VO, 74.2 ± 0.84% at 3 days)13 with the caveat that the genetic background of SHRs is not necessarily identical to that of WKY rats.20
A previous study reported that SHR-2VO exhibited more severe ischemic and demyelinating changes with significantly lower CBF and higher mortality rate (72%; 78 of 108) than their normotensive WKY-2VO counterparts (16%; 7 of 43).14,15 In our study, however, the degree of white matter damage was comparable between the SHR-2VGO and SHR-2VO. One of the plausible explanations is that the substantial difference in the mortality rate between the two groups generated a survival bias: SHR-2VO with a higher degree of damage may have escaped histological analyses. Alternatively, it might be plausible that hypertension-induced vascular changes have a relatively minor contribution to development of human cerebral white matter hyperintensities as demonstrated in a recent cohort study of 881 community-dwelling old subjects and 257 patients with recent nondisabling stroke.21
The current new model (SHR-2VGO) appears to include at least some important elements of the entire process of Binswanger disease, a pathological condition of SIVD,22 leading from the initial process of hypertension to subsequent brain damage, whereas the existing models, such as WKY-2VO or WKY-2VGO, simulate only the downstream part of the pathophysiological cascade of small vessel disease.3 However, the current new model has some limitations. First, the underlying small vessel pathology seems not to be severe enough to induce BBB disruption at 28 days post-operation. The use of SHR stroke-prone (SHRSP) may solve this limitation. For example, unilateral carotid artery occlusion with high blood pressure in SHRSPs results in myelin damage and BBB breakdown.23 The use of ACs to SHRSPs, however, may result in a high mortality rate. Second, gradual carotid artery occlusion but not the small vessel pathology per se induces white matter pathology in SHR-2VGO. However, cardiovascular risk factors such as hypertension seems to act very early in life on the arterial system, damaging both large and small arteries through a large/small artery cross talk.24,25 Therefore, the current new model may be useful to explore the emerging concept of the large/small artery cross-talk although it does not replicate all the features of small vessel disease. There is likely no single rodent model which can recapitulate all the features of SIVD as in humans because they have different brain anatomy and longer perforating arteries compared to rodents. However, the SHR-2VGO model reconstruct the pathological cascade of SIVD more precisely than the existing models.
In conclusion, we have established a novel rat model, which may more closely simulate the cascade of Binswanger disease. The SHR-2VGO model may therefore be adapted to explore possible treatments for SIVD.
Supplementary Material
Acknowledgment
We are indebted to Ms Asamoto, Ms Shodai and Ms Kawata for their excellent technical assistance.
Funding
The author(s) disclosed receipt of the following financial support for the research, authorship, and/or publication of this article: We gratefully acknowledge grant support from the Ministry of Health, Labour, and Welfare (Dr. Ihara, no. 0605-1).
Declaration of conflicting interests
The author(s) declared no potential conflicts of interest with respect to the research, authorship, and/or publication of this article.
Authors’ contributions
AK, SS, TM, NO, TA, YH, YY and MI contributed to conception, acquisition and interpretation of data. MU, RNK, HF, KH, RT and MI contributed to drafting the manuscript together with the corresponding author. Finally, MI and KH supervised a whole part of the present study.
References
- 1.Yoshitake T, Kiyohara Y, Kato I, et al. Incidence and risk factors of vascular dementia and Alzheimer's disease in a defined elderly Japanese population: the Hisayama Study. Neurology 1995; 45: 1161–1168. [DOI] [PubMed] [Google Scholar]
- 2.Hannesdottir K, Nitkunan A, Charlton RA, et al. Cognitive impairment and white matter damage in hypertension: a pilot study. Acta Neurol Scand 2009; 119: 261–268. [DOI] [PubMed] [Google Scholar]
- 3.Pantoni L. Cerebral small vessel disease: From pathogenesis and clinical characteristics to therapeutic challenges. Lancet Neurol 2010; 9: 689–701. [DOI] [PubMed] [Google Scholar]
- 4.Marshall RS, Lazar RM. Pumps, aqueducts, and drought management: vascular physiology in vascular cognitive impairment. Stroke 2011; 42: 221–226. [DOI] [PMC free article] [PubMed] [Google Scholar]
- 5.Jiwa NS, Garrard P, Hainsworth AH. Experimental models of vascular dementia and vascular cognitive impairment: A systematic review. J Neurochem 2010; 115: 814–828. [DOI] [PubMed] [Google Scholar]
- 6.Wakita H, Tomimoto H, Akiguchi I, et al. Glial activation and white matter changes in the rat brain induced by chronic cerebral hypoperfusion: An immunohistochemical study. Acta Neuropathol 1994; 87: 484–492. [DOI] [PubMed] [Google Scholar]
- 7.Wakita H, Tomimoto H, Akiguchi I, et al. Axonal damage and demyelination in the white matter after chronic cerebral hypoperfusion in the rat. Brain Res 2002; 924: 63–70. [DOI] [PubMed] [Google Scholar]
- 8.Farkas E, Luiten PG, Bari F. Permanent, bilateral common carotid artery occlusion in the rat: a model for chronic cerebral hypoperfusion-related neurodegenerative diseases. Brain Res Rev 2007; 54: 162–180. [DOI] [PubMed] [Google Scholar]
- 9.Hainsworth AH, Markus HS. Do in vivo experimental models reflect human cerebral small vessel disease? A systematic review. J Cereb Blood Flow Metab 2008; 28: 1877–1891. [DOI] [PubMed] [Google Scholar]
- 10.Marosi M, Rakos G, Robotka H, et al. Hippocampal (CA1) activities in Wistar rats from different vendors. Fundamental differences in acute ischemia. J Neurosci Meth 2006; 156: 231–235. [DOI] [PubMed] [Google Scholar]
- 11.Otori T, Katsumata T, Muramatsu H, et al. Long-term measurement of cerebral blood flow and metabolism in a rat chronic hypoperfusion model. Clin Exp Pharmacol Physiol 2003; 30: 266–272. [DOI] [PubMed] [Google Scholar]
- 12.Tomimoto H, Ihara M, Wakita H, et al. Chronic cerebral hypoperfusion induces white matter lesions and loss of oligodendroglia with DNA fragmentation in the rat. Acta Neuropathol 2003; 106: 527–534. [DOI] [PubMed] [Google Scholar]
- 13.Kitamura A, Fujita Y, Oishi N, et al. Selective white matter abnormalities in a novel rat model of vascular dementia. Neurobiol Aging 2012; 33: 1012 e25–35. [DOI] [PubMed] [Google Scholar]
- 14.Fujishima M, Ogata J, Sugi T, et al. Mortality and cerebral metabolism after bilateral carotid artery ligation in normotensive and spontaneously hypertensive rats. J Neurol Neurosurg Psychiatr 1976; 39: 212–217. [DOI] [PMC free article] [PubMed] [Google Scholar]
- 15.Ogata J, Fujishima M, Morotomi Y, et al. Cerebral infarction following bilateral carotid artery ligation in normotensive and spontaneously hypertensive rats: a pathological study. Stroke 1976; 7: 54–60. [DOI] [PubMed] [Google Scholar]
- 16.Makinodan M, Yamauchi T, Tatsumi K, et al. Demyelination in the juvenile period, but not in adulthood, leads to long-lasting cognitive impairment and deficient social interaction in mice. Prog Neuropsychopharm Biol Psychiatr 2009; 33: 978–985. [DOI] [PubMed] [Google Scholar]
- 17.Lin JX, Tomimoto H, Akiguchi I, et al. White matter lesions and alteration of vascular cell composition in the brain of spontaneously hypertensive rats. Neuroreport 2001; 12: 1835–1839. [DOI] [PubMed] [Google Scholar]
- 18.Oyama N, Yagita Y, Sasaki T, et al. An angiotensin II type 1 receptor blocker can preserve endothelial function and attenuate brain ischemic damage in spontaneously hypertensive rats. J Neurosci Res 2010; 88: 2889–2898. [DOI] [PubMed] [Google Scholar]
- 19.Omura-Matsuoka E, Yagita Y, Sasaki T, et al. Hypertension impairs leptomeningeal collateral growth after common carotid artery occlusion: restoration by antihypertensive treatment. J Neurosci Res 2011; 89: 108–116. [DOI] [PubMed] [Google Scholar]
- 20.St Lezin E, Simonet L, Pravenec M, et al. Hypertensive strains and normotensive ‘control' strains. How closely are they related? Hypertension 1992; 19: 419–424. [DOI] [PubMed] [Google Scholar]
- 21.Wardlaw JM, Allerhand M, Doubal FN, et al. Vascular risk factors, large-artery atheroma, and brain white matter hyperintensities. Neurology 2014; 82: 1331–1338. [DOI] [PMC free article] [PubMed] [Google Scholar]
- 22.Roman GC, Tatemichi TK, Erkinjuntti T, et al. Vascular dementia: Diagnostic criteria for research studies. Report of the NINDS-AIREN International Workshop. Neurology 1993; 43: 250–260. [DOI] [PubMed] [Google Scholar]
- 23.Jalal FY, Yang Y, Thompson J, et al. Myelin loss associated with neuroinflammation in hypertensive rats. Stroke 2012; 43: 1115–1122. [DOI] [PMC free article] [PubMed] [Google Scholar]
- 24.Laurent S, Briet M, Boutouyrie P. Large and small artery cross-talk and recent morbidity-mortality trials in hypertension. Hypertension 2009; 54: 388–392. [DOI] [PubMed] [Google Scholar]
- 25.Scuteri A, Nilsson PM, Tzourio C, et al. Microvascular brain damage with aging and hypertension: pathophysiological consideration and clinical implications. J Hypertens 2011; 29: 1469–1477. [DOI] [PubMed] [Google Scholar]
Associated Data
This section collects any data citations, data availability statements, or supplementary materials included in this article.


