Abstract
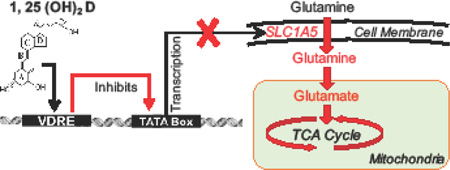
Breast cancer is the second most common cancer among women in the US. The active form of vitamin D, 1,25-dihydroxyvitamin D (1,25(OH)2D), is proposed to inhibit cellular processes and to prevent breast cancer. The current studies investigated the effect of 1,25(OH)2D on glutamine metabolism during cancer progression employing Harvey-ras oncogene transformed MCF10A human breast epithelial cells (MCF10A-ras). Treatment with 1,25(OH)2D significantly reduced intracellular glutamine and glutamate levels measured by nuclear magnetic resonance (NMR) by 23 ± 2% each. Further, 1,25(OH)2D treatment reduced glutamine and glutamate flux, determined by [U-13C5] glutamine tracer kinetics, into the TCA cycle by 31 ± 0.2% and 17 ± 0.4%, respectively. The relative levels of mRNA and protein abundance of the major glutamine transporter, solute linked carrier family 1 member A5 (SLC1A5), was significantly decreased by 1,25(OH)2D treatment in both MCF10A-ras cells and MCF10A which overexpress ErbB2 (HER-2/neu). Consistent with these results, glutamine uptake was reduced by 1,25(OH)2D treatment and the impact was eliminated with the SLC1A5 inhibitor L-γ-Glutamyl-p-nitroanilide (GPNA). A consensus sequence to the vitamin D responsive element (VDRE) was identified in silico in the SLC1A5 gene promoter, and site-directed mutagenesis analyses with reporter gene studies demonstrate a functional negative VDRE in the promoter of the SLC1A5 gene. siRNA-SLC1A5 transfection in MCF10A-ras cells significantly reduced SLC1A5 mRNA expression as well as decreased viable cell number similar to 1,25(OH)2D treatment. SLC1A5 knockdown also induced an increase in apoptotic cells in MCF10A-ras cells. These results suggest 1,25(OH)2D alters glutamine metabolism in MCF10A-ras cells by inhibiting glutamine uptake and utilization, in part through down-regulation of SLC1A5 transcript abundance. Thus, 1,25(OH)2D down-regulation of the glutamine transporter, SLC1A5, may facilitate vitamin D prevention of breast cancer.
Keywords: 1,25-dihydroxyvitamin D; Harvey-ras oncogene; breast cancer; prevention; glutamine metabolism; energy metabolism
Graphical abstract
1. Introduction
Breast cancer is the most commonly diagnosed cancer and the second leading cause of cancer death among U.S. females. More than 230,000 women will be diagnosed with breast cancer in the U.S. this year, and over 40,000 will die from the disease (1). Genetics, environment, as well as dietary factors such as vitamin D are thought to play significant roles in breast cancer risk (2). For example, epidemiological evidence suggests that increased sun exposure as well as increased dietary vitamin D intake, are correlated with decreased breast cancer incidence (3–5). Further, low levels of circulating 25(OH)D, an indicator of vitamin D status, are associated with high breast cancer risk (6) and results from the Women’s Health Initiative shows that women who consumed calcium and vitamin D supplements have lower incidence of breast carcinoma in situ (7). However, the underlying mechanism by which vitamin D contributes to breast cancer prevention is still not clear.
Cancer cells have been characterized with "the Warburg effect", a critical shift of glucose flux from mitochondrial oxidative phosphorylation towards aerobic glycolysis despite the availability of adequate oxygen (8). This phenomenon suggests that glucose is in part redirected into providing intermediates needed for growth rather than towards energy in the form of adenosine-triphosphate (ATP) (9). Glucose and glutamine are the two most catabolized molecules for the supply of carbon, nitrogen, free energy, and reducing equivalents that are necessary to support cell growth (10). Because glucose is not efficiently used for ATP production during cancer progression (Warburg effect), glutamine, the most abundant free amino acid in the human body, may be an alternative energy source (11). In addition to the importance of glutamine in glutathione synthesis, and in protein and nucleotide synthesis, glutamine can also enter the tricarboxylic acid (TCA) cycle and contribute to the synthesis of reducing equivalents for ATP production (12).
Certain cancer cells exhibit reduced cell survival rates in the absence of exogenous glutamine (13–15). In 1955, Dr. Harry Eagle first highlighted that L-glutamine is essential for the survival and growth of a mouse fibroblast cell line (strain L) and a human carcinoma cell line (strain HeLa) in vitro (16). In fact, a wide variety of human cancer cells have shown sensitivity to glutamine starvation (17,18). Glutamine is transported into cells through the neutral amino acid transporter family system, which includes sodium-dependent systems A, ASC, N and sodium-independent system L (19). One of the major high affinity transporters, solute carrier family 1 member 5 (SLC1A5), is over-expressed in many types of cancer cells, and SLC1A5 mediated glutamine transport is required for cell growth (20,21). Intracellular glutamine can be converted to glutamate by glutaminase (GLS), and further metabolized into α-ketoglutarate by either deamination or transamination. The carbon backbones from glutamine therefore enter the TCA cycle to provide energy for cell growth (22). Understanding the regulation of glutamine metabolism during cancer progression may contribute to the development of future cancer therapeutic targets.
Mammary cancer development is a multistage process, which includes cellular mutagenesis for genes that regulate cell proliferation. The acquisition of multiple mutations in proto-oncogenes and tumor suppressor genes can result in uncontrolled cell proliferation and metastasis of the cells. The role of mutated ras genes in inducing malignant transformation is well documented (23–25). Mutations of the ras gene are found in a variety of tumor types and the activated ras gene can result in continuous stimulation of cellular proliferation and development of mammary cancer (26). In this study, MCF10A and Harvey-ras transfected MCF10A (MCF10A-ras) breast epithelial cells were used as a model of cells in early progression to cancer. Previous work from our laboratory shows greater glucose influx, increased glycolysis and lactate production in MCF10A-ras breast epithelial cells, similar to the Warburg effect (27). Importantly, 1,25(OH)2D inhibits the altered glucose metabolism in the MCF10A-ras cells, as well as further inhibits flux of glucose into the TCA cycle (28). Therefore, it is important to also determine if 1,25(OH)2D alters glutamine metabolism in cancer progression.
The purpose of the current study was to investigate the role of 1,25(OH)2D in regulating glutamine metabolism in mammary epithelial cells during cancer progression. Our hypothesis is that 1,25(OH)2D inhibits glutamine uptake and utilization in the cells, a process that is essential for cell growth and proliferation during mammary cancer progression. The results of these studies provide insights into the role of vitamin D in regulating cancer energy metabolism and mammary cancer prevention.
2. Materials and Methods
2.1. Chemicals and reagents
Dulbecco’s modified Eagle medium (DMEM), Nutrient Mixture F-12 (DMEM/F12) media, horse serum, trypsin and penicillin/streptomycin, Annexin V (Alexa Fluor 488 conjugate) were obtained from Life Technologies (Rockville, MD). Cholera toxin was purchased from Calbiochem (Darmstadt, Germany) and 1,25(OH)2D was purchased from Biomol (Plymouth Meeting, PA). Protease inhibitor cocktail, trypan blue, insulin, epidermal growth factor, hydrocortisone, and L-γ-glutamyl-p-nitroanilide, propidium iodide were purchased from Sigma-Aldrich (St. Louis, MO). U13C5-L-glutamine was purchased from Cambridge Isotope labs (Woburn, MA). L-[3H] glutamine was obtained from PerkinElmer (Shelton, CT), and Ultima Gold™ Cocktail from PerkinElmer (Waltham, MA). Luciferase reporter plasmid with SLC1A5 promoter pEZX-PG02-SLC1A5 and promoterless pEZX-PG02-Negative control plasmid was purchased from GeneCopoeia (Rokville, MD). FlexiTube GeneSolution GS6510 for SLC1A5 (siRNA-SLC1A5) or AllStars Negative Control siRNA (siRNA-cont) was purchased from QIAGEN (Germantown, MD).
2.2. Cell culture
MCF10A, MCF10A-ras, MCF10A-ErbB2, and MCF10CA1a human breast epithelial cells were gifts from Dr. Michael Kinch, Purdue University. MCF10A, MCF10A-ras, and MCF10A-ErbB2 cells were cultured in DMEM/F12 (1:1) or DMEM media supplemented with 5% horse serum, 10 mg/L insulin, 20 ug/L epidermal growth factor, 50 ug/L cholera toxin, 50 mg/L hydrocortisone, 100 units /ml penicillin, and 0.1 mg/mL streptomycin in a cell incubator at 37°C with 5% CO2. MCF10CA1a cells used in MTT assays and flow cytometry analyses were maintained in DMEM media supplemented with 5% horse serum and 100 units /ml penicillin. Cell culture media supplemented with fresh 1,25(OH)2D or vehicle at a concentration of 10 nM is changed every 24 hours during treatment period. The 10 nM 1,25(OH)2D treatment was delivered to cells in 100% ethanol at a final ethanol concentration <1%.
2.3. MTT cell viability assay
Cells were pretreated with either vehicle or 10 nM 1,25(OH)2D for 3 days while cultured in supplemented DMEM media (as described above) containing 5 mM glucose and 4 mM glutamine. Cell media was then replaced with supplemented DMEM media containing only glucose or glutamine for another 24 h before being analyzed for viable cell numbers. Relative numbers of viable cell levels were determined by the (3-[4,5-dimethylthiazol-2-yl]-2,5 diphenyl tetrazolium bromide) MTT assay according to the manufacturer’s recommendations.
2.4. Flow Cytometry
MCF10A-ras cells were cultured in same condition as for the MTT assay. From each sample, 1 × 10⁶ cells were harvested with phosphate buffered saline in a single cell suspension. For cell cycle analysis, cells were fixed with ice cold ethanol, pretreated with 0.2 mg/ml Rnase A, and stained with 10 ug/ml propidium iodide. For cell apoptosis analysis, cells were resuspended calcium rich Annexin V binding buffer and stained with 5 ul Annexin V and 10 ug/ml propidium iodide. Flow cytometry analysis was performed with a Beckman Coulter FC500 flow cytometry equipped with a 488 nm laser. The results were analyzed using FlowJo (Tree Star, Inc. Ashland, OR). Results were expressed as percentage of total cells arrested in each phase in the cell cycle or apoptotic stages
2.5. Metabolomics
Cells were washed with ice cold calcium and magnesium free phosphate buffered saline (CMF-PBS) and harvested into doubly distilled water. Cell lysates were obtained by freezing the cells in −80 °C freezer for 5 min, and thawing in 37 °C water bath for 1 min. Cell debris was pelleted by centrifugation at 12,000 RPM for 2 min at 4 °C. The supernatant was collected for metabolite profiling analysis using NMR spectroscopy and mass spectrometry (MS) as previously described (27,28). Metabolite levels were normalized to protein content.
2.6. Glutamine tracer kinetics
Two hours prior to cell harvest, media was changed to fresh media containing 1.25 mM of unlabeled and 1.25 mM 13C labeled L-glutamine. Both media and cell lysates were collected for analysis. [U-13C5] glutamine flux was determined by 13C-mass isotopomer distribution analysis of media metabolites using gas chromatography-mass spectrometry (GC-MS) (27,28). Flux calculations were based on tracer ratios in the form: mol 13C-isotopomer (M+n) per 100 mol 12C analyte (M+0), where n equals the number of 13C-labelled carbons in the analyte.
2.7. Glutamine uptake measurement
To study the effect of 1,25(OH)2D on SLC1A5 mediated glutamine uptake, cells were pretreated with 1,25(OH)2D for 4 days (13), and cell culture media was replaced with media containing L-[3H] glutamine with and without the SLC1A5 inhibitor, L-γ-glutamyl-p-nitroanilide at the last 5 min of treatment. Glutamine uptake was terminated by adding ice cold CMF-PBS and lysing cells with 0.2%SDS /0.2N NaOH solution. The cell lysate was neutralized with 2N HCL and cell associated radioactivity determined. Results were normalized to cell number at the end of the four-day treatment period using the MTT assay.
2.8. ATP assay
Cells were plated in 96-well plates, and the cellular ATP concentration was determined employing a luminescent ATP detection assay kit (Abcam, Cambridge, MA). Results were normalized to cell number measured at the same time as the ATP concentration using the MTT assay in paired plates.
2.9. RNA isolation and analysis
RNA was isolated with TriReagent (Molecular Research Center, Cincinnati, OH) following the manufacturer’s instructions. Reverse transcription of total RNA was performed using MMLV reverse transcriptase (Promega, Madison, WI). Real-time quantitative PCR was performed using the Brilliant III SYBR Green QPCR Master Mix (Agilent, Santa Clara, CA). The mRNA abundances of enzymes involved in glutamine metabolism were determined from the threshold cycle (Ct) value. The mRNA expression was normalized to 18S expression and results were expressed as arbitrary units. Primers used are: SLC1A5 forward, 5’-TGAACATCCTGGGCTT GGTAGTGT-3’ and reverse, 5’—AGCAGGCAGCACAGAATGTACTTG-3’; 18S forward, 5’-TT AGAGTGTTCAAAGCAGGCCCGA-3’and reverse, 5’-TCTTGGCAAATGCTTTCGCTCTGG-3’.
2.10. Western blotting
Cells were washed with cold CMF-PBS twice, and harvested with lysis buffer containing 1% Triton. Cell lysates were obtained by performing freeze and thaw cycles three times. Cells were centrifuged at 14,000 RPM for 15 min at 4 °C, and the supernatant was collected for Western blotting. Protein concentration was determined using the Bicinchoninic Acid Protein assay (Pierce, Rockford, IL, USA). Proteins were resolved by SDS-PAGE on 10% Tris-HCl gels (Bio-Rad Laboratories, Hercules, CA), transferred onto nitrocellulose membrane (Bio-Rad Laboratories, Hercules, CA) and probed with a specific antibody against SLC1A5 (EMD Millipore, Billerica, MA) or an actin antibody (Santa Cruz Biotechnology Inc., Santa Cruz, CA).
2.11. Mutagenesis of the VDRE sequence in SLC1A5 promoter constructs
Mutations in the putative VDRE sequence were introduced into the pEZX-PG02-SLC1A5 promoter plasmid using the GeneArt site-directed mutagenesis system (Invitrogen, Carlsbad, CA). Primers used were: FW: 5’-CTAGGTGTGGCCTCAATTCTAATGACTTCCTCTGCC-3’ and RV: 5’-GGCAGAGGAAGTCATTAGAATTGAGGCCACACCTAG-3’
2.12. Transient transfection and luciferase assay
MCF10A-ras cells were plated in 24-well plates at a density of 1.4 × 10⁵ cells per well. At 90% confluence, the cells were transfected using 2 µl lipofectamine (Invitrogen, Carlsbad, CA) with 500 ng of the promoterless pEZX-PG02-Negative control plasmid or the pEZX-PG02-SLC1A5 promoter plasmid, and 10 ng of the pGL3-Basic-Firefly luciferase plasmid as a transfection efficiency control. 12 h after transfection, cells were treated with vehicle or 10 nM 1,25(OH)2D containing media for 72 h. Luciferase activity was determined using the Dual-Luciferase Reporter Assay System (Promega, Madison, WI), which was normalized to the firefly luciferase activity.
2.13. siRNA transfection
MCF10A-ras cells were plated and allowed to attach overnight. At 70% confluence, the cells were transfected with either siRNA-SLC1A5 or siRNA-cont using Lipofectamine RNAiMAX and Opti-MEM Reduced Serum Medium (Invitrogen, Carlsbad, CA) according to the manufacture’s protocol. After transfection, cells were treated with media containing vehicle or 10 nM 1,25(OH)2D for 72 h for analysis.
2.14. Statistical analysis
Values are presented as mean ± SEM. Results are expressed compared to the vehicle within the same cell line, by the Student’s t-tests (LSD), or by analysis of variance (ANOVA), with P < 0.05 considered statistically significant.
3. Results
3.1. 1,25(OH)2D reduces the effect of glutamine deprivation on inducing further cell death in MCF10A-ras cells
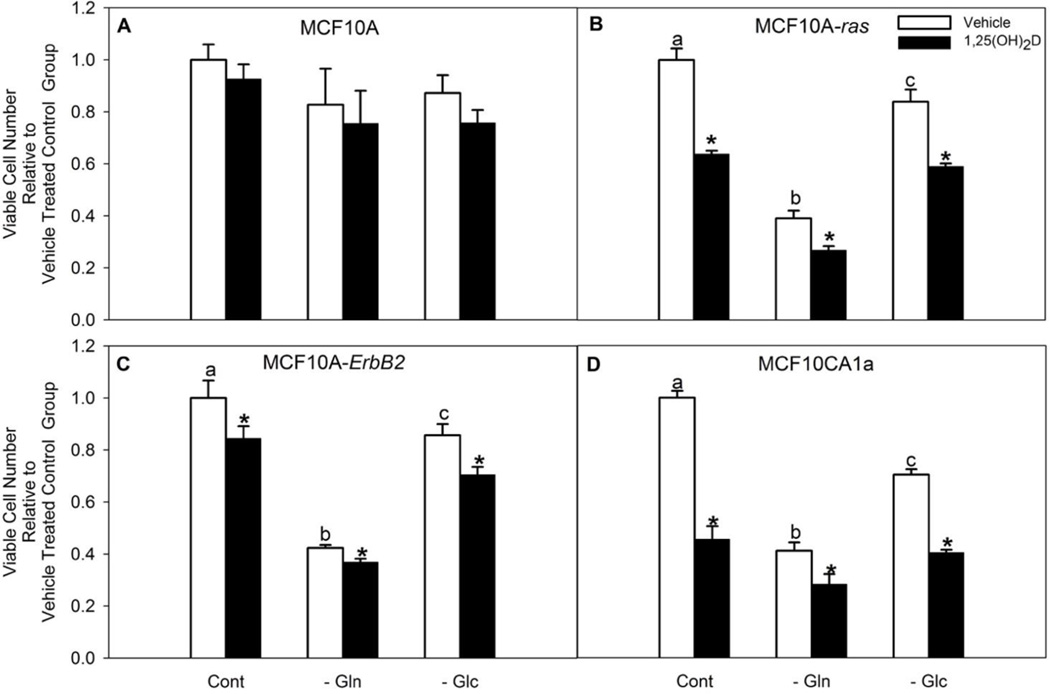
To determine the importance of glutamine in MCF10A-ras cells, viable cell number was tested when cells were cultured for 24 h with or without glutamine in the cell culture media. Results showed a significant decrease in the number of viable cells in the glutamine-deprived group when compared with the glutamine-supplemented group in MCF10A-ras (Figure 1 B). Glutamine dependency was also observed in HER2/neu/ErbB2 transformed MCF10A cells and metastatic MCF10CA1a cell lines (Figure 1 C, D), though not in the untransformed MCF10A cells (Figure 1 A). We also observed significantly lower dependency on glucose for optimal growth compared with glutamine in these cell lines. These results suggest the importance of glutamine in maintaining optimal MCF10A-ras cell growth.
Figure 1. Glutamine deprivation as well as 1,25(OH)2D significantly reduced MCF10A-ras cell number.
Cells were cultured with media containing 4 mM glutamine and 5 mM glucose for three days with either vehicle or 1,25(OH)2D treatment, followed by replacing media with no glutamine or glucose for another 24 h along with either vehicle or 1,25(OH)2D treatment. Viable cell number was assessed by MTT assay in (A) MCF10A, (B) MCF10A-ras, (C) MCF10A-ErbB2 and (D) MCF10CA1a cells. Values are presented as mean ± SEM and n = 5 from two independent experiments. In each cell line, relative amount of vehicle treated cells in glutamine deprived (−Gln) or glucose deprived (−Glc) groups were compared to the number of vehicle treated cells kept in 4 mM glutamine and 5 mM glucose (Cont) groups. In each figure, vehicle treated groups with different letters are significantly different (p< 0.05) tested by ANOVA. An asterisk (*) indicates a significant difference (p<0.05) between each vehicle and 1,25(OH)2D treatment groups by the Student’s t-test.
The effect of 1,25(OH)2D on viable cell number was also assessed. Results showed that 1,25(OH)2D does not affect the number of viable cells in MCF10A cells under either glutamine supplemented or deprived condition (Figure 1 A). However, 1,25(OH)2D significantly decreased viable cell number of MCF10A-ras, MCF10A-ErB2, and MCF10CA1a cells in all three media conditions (Figure 1 B–D), which suggests the effect of 1,25(OH)2D in regulating viable cell number is specific to transformed cells.
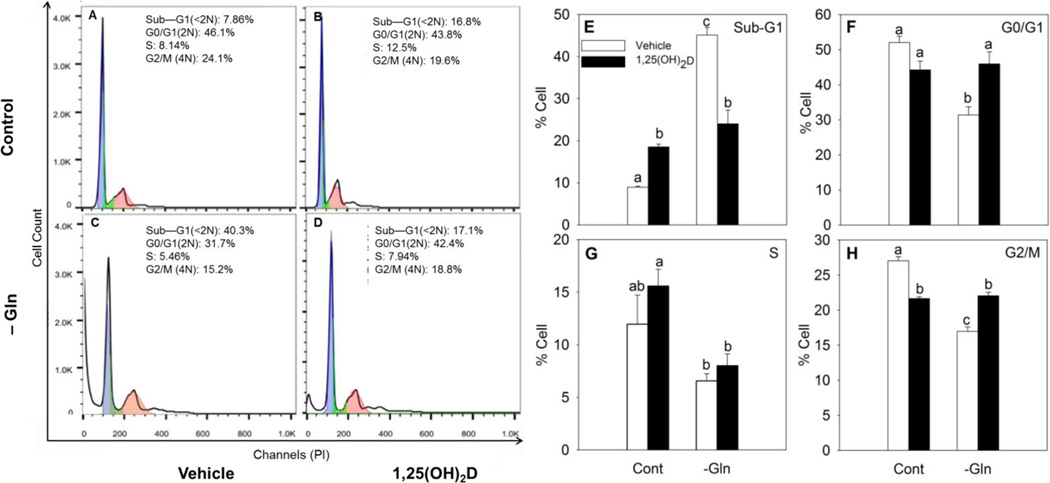
To determine if the effect of 1,25(OH)2D and glutamine deprivation on viable cell number affects a specific phase of the cell cycle arrest or apoptosis, we used flow cytometry to assess the cell cycle profile in MCF10A-ras cells. In vehicle treated cells, glutamine deprivation significantly increased the percentage of cells in the sub-G1 phase by 5.4 fold, which suggested induced cell death as shown by flow cytometry (Figure 2 A, C, E). Treatment with 1,25(OH)2D alone also significantly induced cell death, indicated by a 2.2 fold increase of cells in sub-G1 phase compared to vehicle control, in glutamine supplemented group (Figure 2 A, B, E). However, in the 1,25(OH)2D pre-treated groups, glutamine deprivation did not affect the percentage of cells in the sub-G1 phase compared with its control group. In fact, in glutamine deprived groups, 1,25(OH)2D pre-treated group shows significantly decreased cell death compared to the vehicle treated group (Figure 2 A–E). Glutamine deprivation significantly decreased the number of cells arrested in the G0/G1 and G2/M phases in vehicle groups, whereas it had no effect on 1,25(OH)2D pre-treated groups (Figure 2 F, H). Overall, these results suggested that pretreatment of 1,25(OH)2D reduced the effect of glutamine deprivation on inducing further cell death in MCF10A-ras cells.
Figure 2. 1,25(OH)2D reversed the effect of glutamine deprivation on inducing cell death in MCF10A-ras cells.
MCF10A-ras cells were cultured with media containing 4 mM glutamine and 5 mM glucose for three days with either vehicle or 1,25(OH)2D treatment, and media replaced with media containing no glutamine in addition to either vehicle or 1,25(OH)2D treatment for another 24 h. The percent of cells in each cell cycle phase was analyzed by flow cytometry following propidium iodide staining. (A–D) Representative cell cycle analysis results for cells in each treatment group. (E–H) Percentages of cells in each cell cycle phase. Values are presented as mean ± SEM and n = 4 from two independent experiments. In each figure, groups with different letters are significantly different (p< 0.05) tested by ANOVA.
3.2. 1,25(OH)2D alters glutamine metabolism
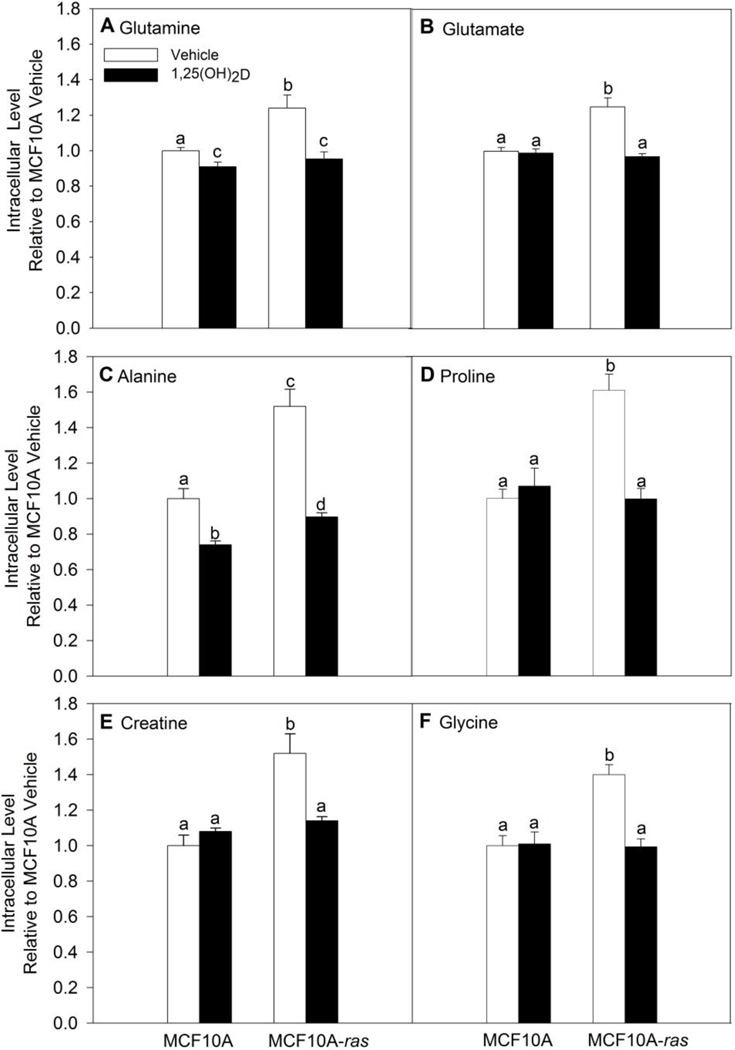
Because of the reduced dependence of cells on glutamine, we examined the impact of 1,25(OH)2D on glutamine metabolism first by assessing the intracellular levels of glutamine and its metabolite glutamate in MCF10A and MCF10A-ras cells. Results from metabolomics analysis showed that MCF10A-ras contain significantly higher intracellular glutamine and glutamate levels relative to MCF10A cells (Figure 3 A, B). 1,25(OH)2D treatment for 4 days reduced intracellular glutamine and glutamate levels in the MCF10A-ras cells significantly (Figure 3 A, B). In MCF10A cells, 1,25(OH)2D treatment reduced only intracellular glutamine levels, but not glutamate levels (Figure 3 A, B). In addition, the intracellular levels of other glutamine related metabolites, proline, alanine, creatine, and glycine, were all higher in MCF10A-ras cells relative to MCF10A, and decreased significantly by 1,25(OH)2D in MCF10A-ras cells (Figure 3 C–F). In MCF10A cells, 1,25(OH)2D only decreased intracellular alanine levels, but not the other metabolites (Figure 3 C–F). As all four metabolites can be directly or indirectly converted from glutamine in the cell, these results further support the inhibitory role of 1,25(OH)2D on intracellular glutamine metabolism in MCF10A-ras. Cumulatively, these results suggest that 1,25(OH)2D reduces the accumulation of glutamine and glutamate in MCF10-ras cells and thus alters glutamine metabolism in this cell model.
Figure 3. 1,25(OH)2D decreased intracellular levels of glutamine and its related metabolites in MCF10A-ras cells.
MCF10A and MCF10A-ras cells were treated with vehicle or 1,25(OH)2D (10nM) for four days before metabolite profiling analysis using NMR spectroscopy and MS. Metabolite levels of intracellular (A) glutamine, (B) glutamate, (C) alanine, (D) proline, (E) creatine, and (F) glycine are normalized to protein content. Values are presented as mean ± SEM (n=4) relative to MCF10A vehicle groups. Groups with different letters are significantly different (p < 0.05) tested by ANOVA.
3.3. 1,25(OH)2D inhibits glutamine flux into the TCA cycle
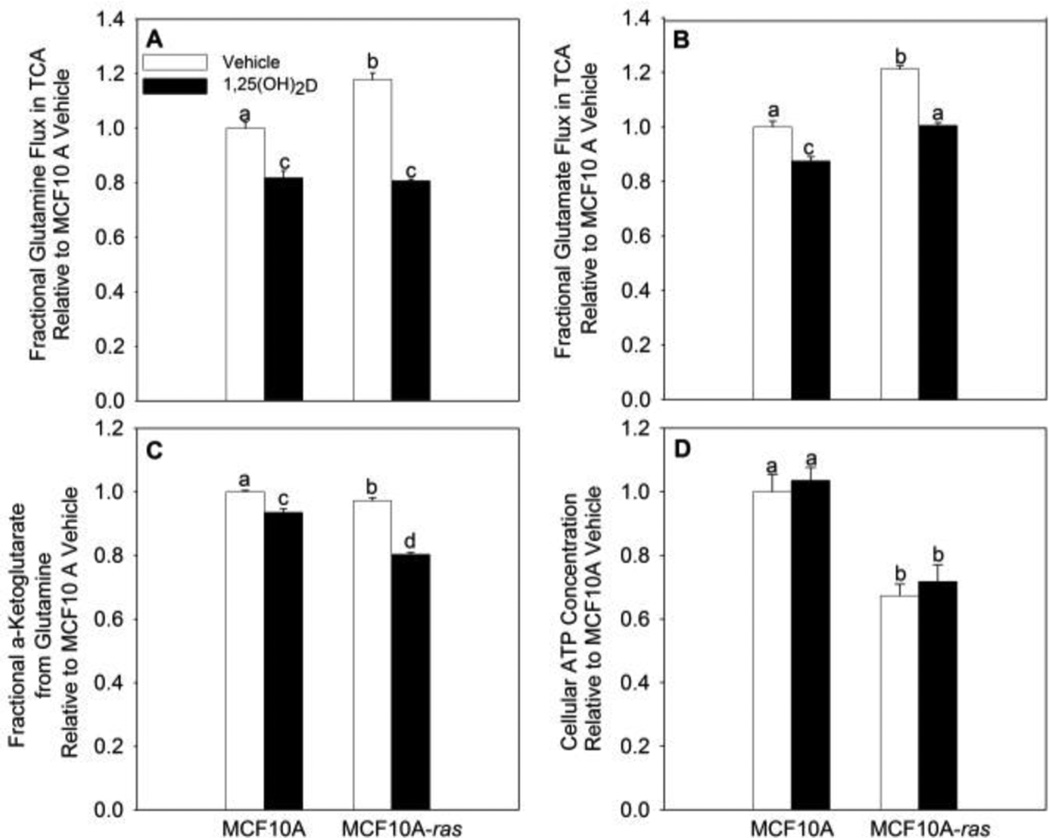
MCF10A-ras cells exhibited the Warburg effect, showing a critical shift of glucose flux away from mitochondrial oxidative phosphorylation, and towards aerobic glycolysis (27). Glycolysis provides less energy (ATP) than mitochondrial oxidative phosphorylation. This leads to the question whether 1,25(OH)2D alters ATP levels, particularly as no impaired mitochondrial function is observed in most cancer cells exhibiting the Warburg effect (9). As shown above, 1,25(OH)2D treatment significantly decreases intracellular glutamine concentration in MCF10A-ras cells. Therefore, it is of interest to know if 1,25(OH)2D plays a role in regulating the intracellular utilization of glutamine into the TCA cycle. The fraction of glutamine metabolized through the TCA cycle in MCF10A and MCF10A-ras was assessed using stable isotope tracer kinetics (U13C5-L-glutamine). Results show significantly higher glutamine and glutamate flux into the TCA cycle in MCF10A-ras cells relative to MCF10A (Figure 4A, B). Treatment with 1,25(OH)2D decreased fractional glutamine flux into the TCA cycle by 31 ± 0.2% and decreased fractional glutamate flux by 17 ± 0.4% in MCF10A-ras (Figure 4A, B). Intracellular glutamate is converted to α-ketoglutarate either by glutamate dehydrogenase or transaminases to be used in the TCA cycle. Fractional glutamine flux into α-ketoglutarate is decreased by 17 ± 0.6% with 1,25(OH)2D treatment in MCF10A-ras (Figure 4C). The inhibitory effect of 1,25(OH)2D treatment on inhibiting fractional glutamine and glutamate flux into the TCA cycle, as well as fractional glutamine flux into α-ketoglutarate is less potent in MCF10A cells (Figure 4 A–C). These results are consistent with the hypothesis that 1,25(OH)2D inhibits the glutamine use in the TCA cycle in MCF10A-ras. Interestingly, 1,25(OH)2D treatment had no effect on cellular ATP concentration in either cell line, despite inhibition of both glucose and glutamine flux into the TCA cycle (Figure 4 D).
Figure 4. 1,25(OH)2D decreased glutamine flux into the TCA cycle in MCF10A-ras.
MCF10A and MCF10A-ras cells were treated with vehicle or 1,25(OH)2D (10nM) for four days. Two hours prior to cell harvest, media was changed to fresh media containing both 1.25 mM unlabeled and 1.25 mM 13C labeled L-glutamine. Fractional (A) glutamine and (B) glutamate flux into the TCA cycle and (C) fractional glutamine flux into α-ketoglutarate were shown. (D) Cellular ATP concentration was also measured after 4-day vehicle or 1,25(OH)2D treatment with a luminescent ATP detection assay kit. Values are presented as mean ± SEM (n=4) relative to MCF10A vehicle groups. Groups with different letters are significantly different (p < 0.05) tested by ANOVA.
3.4. 1,25(OH)2D inhibits the glutamine uptake partially through down-regulating glutamine transporter, SLC1A5
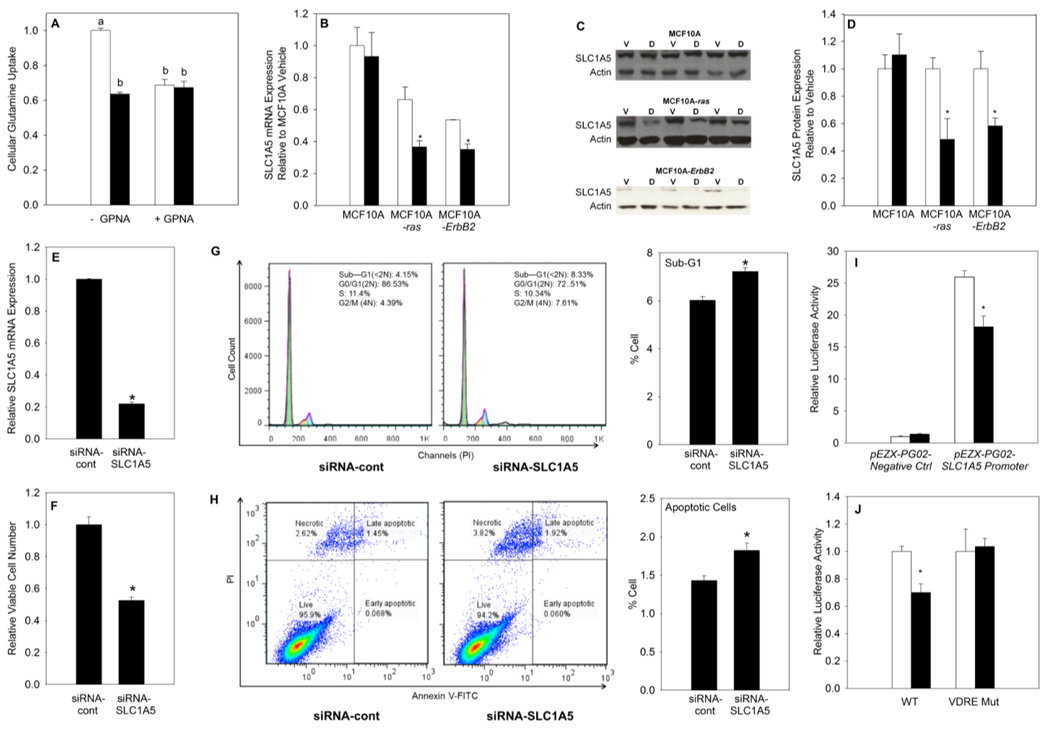
In order to determine the mechanism by which 1,25(OH)2D reduces glutamine accumulation, the impact on glutamine uptake was examined in MCF10A-ras cells. We measured the effect of 1,25(OH)2D on regulating glutamine uptake using L-[3H] glutamine. Results showed that glutamine uptake into MCF10A-ras cells was decreased significantly with 1,25(OH)2D treatment (Figure 5 A). These results suggest that 1,25(OH)2D may regulate glutamine metabolism through inhibiting glutamine uptake. In addition, a specific competitive SLC1A5 inhibitor, L-γ-glutamyl-p-nitroanilide (GPNA) (29), diminished the effect of 1,25(OH)2D on inhibiting glutamine uptake, which supports the role of SLC1A5 as a target for 1,25(OH)2D in regulating glutamine metabolism (Figure 5 A).
Figure 5. 1,25(OH)2D inhibits glutamine uptake through down-regulation of the glutamine transporter SLC1A5 in MCF10A-ras cells.
Cells were treated with vehicle or 1,25(OH)2D (10 nM) for 4 days. (A) Glutamine uptake was determined by analyzing cell lysate radioactivity 5 min following replacing the media with media containing L-[3H] glutamine, or L-γ-glutamyl-p-nitroanilide (GPNA). Results were normalized to cell number obtained from MTT assay. (B) SLC1A5 mRNA expression is shown relative to vehicle in each cell line. (C) Representative blots of SLC1A5 protein expression with vehicle (V) or 1,25(OH)2D (D) treatment by Western blot analysis. Actin was used as a loading control. (D) Quantification of SLC1A5 protein expression relative to vehicle in each cell line. Effect of siRNA-cont and siRNA-SLC1A5 transfection in MCF10A–ras cells on (E) SLC1A5 mRNA expression and (F) viable cell number. (G) Representative cell cycle analysis results and quantification of percentage of cells in sub-G1 phase in SLC1A5 knockdown MCF10A-ras cells. (H) Representative cell apoptosis analysis results and quantification of percentage of apoptotic (includes both early and late apoptotic) cells in SLC1A5 knockdown MCF10A-ras cells. (I) Relative luciferase activity measured after 72 h pEZX-PG02-Negative Ctrl or pEZX-PG02-SLC1A5 promoter plasmid transfection in MCF10A-ras cells. (J) Relative luciferase activity measured after 72 h wild-type (WT) or VDRE mutant (VDRE Mut) pEZX-PG02-SLC1A5 promoter plasmid transfection in MCF10A-ras cells. Values are presented as mean ± SEM and n= at least 3 from two independent experiments. Groups with different letters are significantly different (p< 0.05) tested by ANOVA. An asterisk (*) indicates a significant difference (p < 0.05) from vehicle treatments by the Student’s t-tests.
To determine if the expression of the SCL1A5 is altered by 1,25(OH)2D and because the SLC1A5 activity is primarily regulated at a transcriptional level (14,15), the impact of 1,25(OH)2D on the mRNA and protein expression of SLC1A5 was assessed in MCF10A, MCF10A-ras and MCF10A-ErbB2 cells. Results show that 1,25(OH)2D treatment significantly decreased mRNA and protein expression of SLC1A5 in both transformed cell lines, but had no effect in MCF10A cells. These results suggest that the effect of 1,25(OH)2D on SLC1A5 inhibition is specific to transformed cell lines. (Figure 5 B–D).
To further understand the role of SLC1A5 in regulating cell viability, we employed siRNA to knockdown SLC1A5 expression. siRNA-SLC1A5 transfected MCF10A-ras cells have significantly decreased SLC1A5 mRNA expression as well as reduced viable cell number (Figure 5 E, F). Further, SLC1A5 knockdown significantly induced an increase in percent of apoptotic cells in MCF10A-ras cells from both cell cycle analysis (as illustrated by cells in sub-G1 phase) and cell apoptosis analysis (Figure 5 G, H). These results demonstrate that, that similar to the effect of 1,25(OH)2D and glutamine deprivation, SLC1A5 knockdown also inhibited viable cell number and induced apoptosis, which suggests the importance of SLC1A5 in maintaining cell survival.
3.5. 1,25(OH)2D regulation of human SLC1A5 gene promoter
Results from the current studies suggest that 1,25(OH)2D may inhibit SLC1A5 expression through direct transcriptional regulation, consequently it is important to determine the source of regulation of human SLC1A5 gene promoter activity by 1,25(OH)2D. To examine whether 1,25(OH)2D regulates the transcriptional activity of the human SLC1A5 promoter in MCF10A-ras cells, a sequence 1118 bp upstream of the transcription start site (TSS) and 157 bp downstream of TSS was designed and constructed into the pEZX-PG02-Luciferase reporter gene plasmid by GeneCopoeia. The cells were treated with vehicle or 10 nM 1,25(OH)2D for 72 hours after transfection. Results showed that the promoter was functional in inducing luciferase activity by 26 fold compared to the promoterless pEZX-PG02-Negative control plasmid, and 1,25(OH)2D reduced the transcriptional activity of the pEZX-PG02-SLC1A5 promoter plasmid by 30% compared to vehicle (Figure 5 I). These suggest the presence of (a) negative regulatory element(s) by 1,25(OH)2D in this region and that 1,25(OH)2D may directly inhibit SLC1A5 expression at the transcriptional level.
Analysis of the −1118/+157 region of the SLC1A5 promoter revealed a potential VDRE sequence (−766/ −752: AGGTGA ATG ACTTCC) by homology with the consensus VDRE sequences (30), supporting that 1,25(OH)2D may inhibit SLC1A5 gene expression at transcriptional level via vitamin D receptor (VDR). A mutational analysis was carried out to determine whether the suppression of the SLC1A5 promoter activity by 1,25(OH)2D was mediated through the potential negative VDRE. Site-directed mutagenesis was used to create mutants with base changes in the putative VDRE in the pEZX-PG02-SLC1A5 promoter construct. Wild-type (WT) SLC1A5 promoter and the mutant constructs were transfected into the MCF10A-ras cells, and 1,25(OH)2D responsiveness was assessed by measuring luciferase reporter activity. 1,25(OH)2D significantly inhibited the activity of the wild-type promoter construct, but not the mutated promoter constructs (Figure 5 J). These results suggest that the putative VDRE in the SLC1A5 promoter is responsive to 1,25(OH)2D suppressor activity. Collectively, these results suggest that 1,25(OH)2D regulates glutamine metabolism and uptake in MCF10A-ras cells in part through down-regulating SLC1A5 expression transcriptionally.
4. Discussion
Glutamine metabolism is essential for tumorigenesis in many types of cancer. Cancer cells alter their glutamine metabolic pathways as part of metabolic reprograming to support rapid cell proliferation (31,32). Despite the essential role of glutamine in cancer, the importance and regulation of glutamine metabolism in mammary cancer is not thoroughly understood. Many cancer cells are dependent on glutamine for growth and proliferation, and glutamine starvation in vitro leads to rapid loss of cell viability in these cells (20,33–35). Most tumor cells consume glutamine at a much higher rate compare to normal cells such that an increased rate of glutamine metabolism is, therefore, suggested to be a feature of many cancer cells (16,36). Consistent with other studies, our results demonstrated that glutamine deprivation significantly decreased cell viability of MCF10A-ras, but not MCF10A. Importantly, the current studies show for the first time that 1,25(OH)2D significantly decreased intracellular levels of glutamine and glutamine, as well as other glutamine related metabolites, supporting the role of 1,25(OH)2D on inhibiting glutamine metabolism in MCF10A-ras cells.
As many cancer cells display higher glutamine consumption relative to normal cells, and show sensitivity to glutamine deprivation, inhibition of glutamine uptake is proposed to be a possible therapeutic opportunity (22,36). SLC1A5, a major glutamine transporter, is expressed in several human tissues, including placenta, lung, skeletal muscle, kidney, pancreas, as well as carcinoma cells and over-expressed in many glutamine dependent cancer cells (19,20). Further, the SLC1A5 expression level is related to the aggressiveness of the tumor in non-small cell lung cancer, tongue cancer, colorectal cancer, pancreatic ductal carcinoma and prostate adenocarcinomas (21,34,37–39). In a recently published paper by Shimizu et al., SLC1A5 expression was expressed in 66% of patients with non-small cell lung cancer. Its expression was closely correlated with disease stage and metastasis (38). The authors suggested SLC1A5 as a molecular marker for predicting poor prognosis after surgery in non-small cell lung adenocarcinoma patients. In surgically resected tongue cancer, the expression of SLC1A5 was also shown to be significantly associated with disease staging, lymph-node metastasis, lymphatic permeation, and cell proliferation (39). Tissue microarrays of cancer or adjacent normal tissue pairs from 90 colorectal cancer patients revealed that higher SLC1A5 expression levels were strongly associated with higher tumor stages (21). Similarly, in 97 pancreatic ductal carcinoma samples, higher SLC1A5 expression was associated with poorer prognosis (37). SLC1A5 was reported to be expressed at higher levels in prostate cancer patient samples in comparison to normal prostate samples by Wang et al., suggesting SLC1A5 as a putative therapeutic target in prostate cancer (34). The inhibition of SLC1A5 expression with antisense RNA specific to SLC1A5 reduced viable cell number in liver cancer cells, prostate cancer cells, non-small cell lung cancer cells, melanoma, myeloid leukemia, as well as colon cancer cells (13,20,21,34–36). It is suggested that decreased cell viability due to SLC1A5 suppression was mainly through the activation of cellular apoptosis pathway, evidenced by the increased caspase-3 activity and poly-(ADPribose) polymerase (PPAR) cleavage (20). Despite the importance of SLC1A5 in regulating glutamine metabolism in cancer cells, the involvement of SLC1A5 in regulating glutamine uptake in mammary cancer has not been studied.
Results of the current study demonstrate that SLC1A5 is important in regulating glutamine uptake and maintaining cell viability in Harvey-ras transformed human breast epithelial cells. In order to explore a mechanism by which 1,25(OH)2D inhibits glutamine metabolism, we investigated the effect of 1,25(OH)2D on SLC1A5 expression and glutamine uptake. Consistent with these previous results showing the importance of the SLC1A5 transporter in glutamine metabolism in tumors, the results show that 1,25(OH)2D is able to regulate the expression of SLC1A5 transcriptionally, which is an essential step in altering glutamine metabolism in MCF10A-ras cells. A putative VDRE responsive to 1,25(OH)2D suppressor activity was also identified in the SLC1A5 promoter region.
5. Conclusion
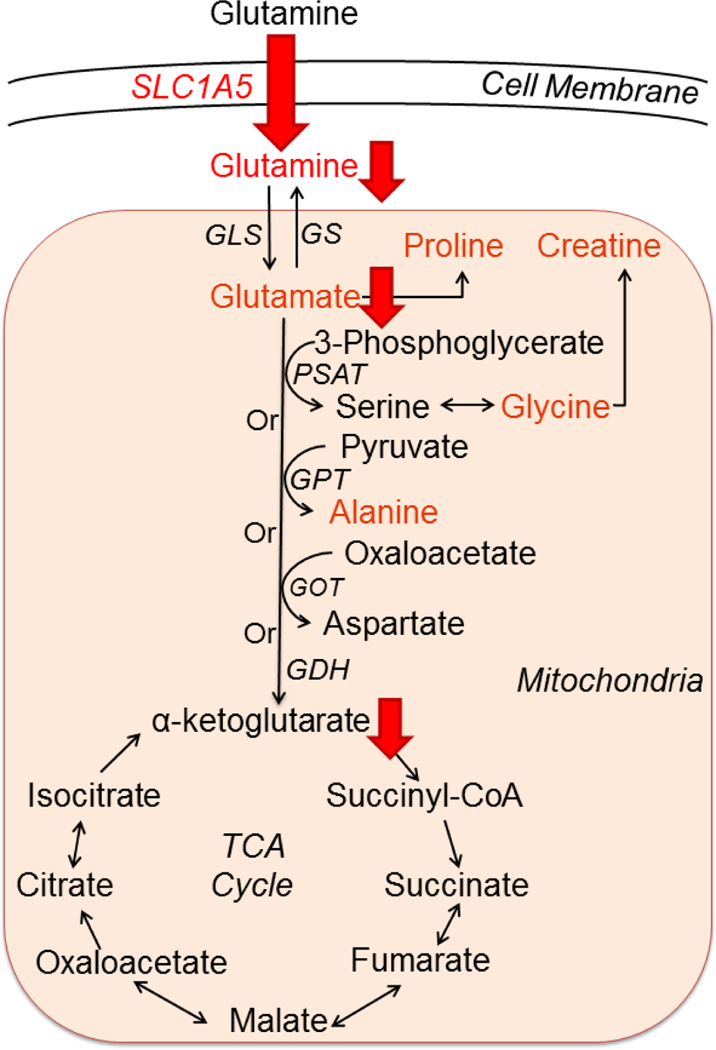
Collectively, these results suggest 1,25(OH)2D alters glutamine metabolism in MCF10A-ras cells by inhibiting glutamine uptake and utilization, in part through transcriptional down-regulation of the expression of SLC1A5 (Figure 6). To our knowledge, this is the first study to demonstrate the effect of 1,25(OH)2D on SLC1A5 expression and glutamine metabolism. Therefore, regulation of glutamine metabolism may contribute to the impact of vitamin D on breast cancer prevention.
Figure 6. Summary of the inhibitory effects of 1,25(OH)2D on glutamine metabolism in MCF10A-ras.
Intracellular glutamine and its related metabolites (in red font color) levels were decreased by 1,25(OH)2D in MCF10A-ras cells. 1,25(OH)2D inhibited fractional glutamine and glutamate flux into the TCA cycle, as well as glutamine flux into α-ketoglutarate shown by red downward arrows. 1,25(OH)2D significantly decreased SLC1A5 mediated glutamine uptake into the cells, as well as the mRNA and protein abundance of SLC1A5. Abbreviations: GLS, glutaminase; GS, glutamine synthetase; PSAT, phosphoserine aminotransferase; GPT, glutamate-pyruvate transaminase; GOT, glutamicoxaloacetic transaminase; GDH, glutamate dehydrogenase.
Highlights.
Glutamine addiction is reduced by 1,25(OH)2D in MCF10A-ras cells
Intracellular glutamine and glutamate concentrations are reduced by 1,25(OH)2D
Flux of glutamine into the TCA cycle is decreased by 1,25(OH)2D
1,25(OH)2D inhibits glutamine uptake through the glutamine transporter SLC1A5
SLC1A5 is transcriptionally down-regulated through a functional VDRE
Acknowledgments
This work was supported by the National Institutes of Health, National Cancer Institute R25CA128770, National Institute for General Medicine R01GM085291. Additional supports were received from the Purdue University Center for Cancer Research Small Grants Program and Indiana Elks Charities.
Abbreviations
- 1,25(OH)2D
1,25-dihydroxyvitamin D
- SLC1A5
solute carrier family 1 member 5
- GLS
glutaminase
- GPNA
L-γ-glutamyl-p-nitroanilide
- VDR
vitamin D receptor
- VDRE
vitamin D responsive element
- NMR
nuclear magnetic resonance
- GC-MS
gas chromatography-mass spectrometry
Footnotes
Publisher's Disclaimer: This is a PDF file of an unedited manuscript that has been accepted for publication. As a service to our customers we are providing this early version of the manuscript. The manuscript will undergo copyediting, typesetting, and review of the resulting proof before it is published in its final citable form. Please note that during the production process errors may be discovered which could affect the content, and all legal disclaimers that apply to the journal pertain.
Disclosure of Potential Conflicts of Interest: DR holds equity and an executive office at Matrix-Bio, Inc. No other potential conflicts of interest were disclosed
Contributor Information
Xuanzhu Zhou, Email: zhou249@purdue.edu.
Wei Zheng, Email: wzheng87@stanford.edu.
G.A. Nagana Gowda, Email: ngowda@uw.edu.
Daniel Raftery, Email: draftery@uw.edu.
Shawn S. Donkin, Email: sdonkin@purdue.edu.
Brian Bequette, Email: dteegard@purdue.edu.
Dorothy Teegarden, Email: teegarden@purdue.edu.
References
- 1.Society AC. <CANCER FACTS AND FIGURES 2015>. Atlanta: American Cancer Society; 2015. [Google Scholar]
- 2.McPherson K, Steel CM, Dixon JM. Breast cancer—epidemiology, risk factors, and genetics. BMJ. 2000;321(7261):624–628. doi: 10.1136/bmj.321.7261.624. [DOI] [PMC free article] [PubMed] [Google Scholar]
- 3.Tseng M, Byrne C, Evers KA, Daly MB. Dietary intake and breast density in high-risk women: a cross-sectional study. Breast Cancer Res. 2007;9(5):R72. doi: 10.1186/bcr1781. [DOI] [PMC free article] [PubMed] [Google Scholar]
- 4.Gissel T, Rejnmark L, Mosekilde L, Vestergaard P. Intake of vitamin D and risk of breast cancer--a meta-analysis. The Journal of steroid biochemistry and molecular biology. 2008;111:195–199. doi: 10.1016/j.jsbmb.2008.06.002. [DOI] [PubMed] [Google Scholar]
- 5.Anderson LN, Cotterchio M, Kirsh VA, Knight JA. Ultraviolet sunlight exposure during adolescence and adulthood and breast cancer risk: a population-based case-control study among Ontario women. American journal of epidemiology. 2011;174:293–304. doi: 10.1093/aje/kwr091. [DOI] [PubMed] [Google Scholar]
- 6.Crew KD, Gammon MD, Steck SE, Hershman DL, Cremers S, Dworakowski E, et al. Association between plasma 25-hydroxyvitamin D and breast cancer risk. Cancer prevention research (Philadelphia, Pa) 2009;2:598–604. doi: 10.1158/1940-6207.CAPR-08-0138. [DOI] [PMC free article] [PubMed] [Google Scholar]
- 7.Prentice RL, Pettinger MB, Jackson RD, Wactawski-Wende J, Lacroix AZ, Anderson GL, et al. Health risks and benefits from calcium and vitamin D supplementation: Women's Health Initiative clinical trial and cohort study. Osteoporosis international : a journal established as result of cooperation between the European Foundation for Osteoporosis and the National Osteoporosis Foundation of the USA. 2012;24:567–580. doi: 10.1007/s00198-012-2224-2. [DOI] [PMC free article] [PubMed] [Google Scholar]
- 8.Warburg O. On the Origin of Cancer Cells. Science. 1956;123(3191):6. doi: 10.1126/science.123.3191.309. [DOI] [PubMed] [Google Scholar]
- 9.Vander Heiden MG, Cantley LC, Thompson CB. Understanding the Warburg effect: the metabolic requirements of cell proliferation. Science. 2009;324(5930):1029–1033. doi: 10.1126/science.1160809. [DOI] [PMC free article] [PubMed] [Google Scholar]
- 10.Hensley CT, Wasti AT, DeBerardinis RJ. Glutamine and cancer: cell biology, physiology, and clinical opportunities. The Journal of clinical investigation. 2013;123(9):3678–3684. doi: 10.1172/JCI69600. [DOI] [PMC free article] [PubMed] [Google Scholar]
- 11.Polet F, Feron O. Endothelial cell metabolism and tumour angiogenesis: glucose and glutamine as essential fuels and lactate as the driving force. Journal of internal medicine. 2012;273:156–165. doi: 10.1111/joim.12016. [DOI] [PubMed] [Google Scholar]
- 12.DeBerardinis RJ, Cheng T. Q's next: the diverse functions of glutamine in metabolism, cell biology and cancer. Oncogene. 2010;29(3):313–324. doi: 10.1038/onc.2009.358. [DOI] [PMC free article] [PubMed] [Google Scholar]
- 13.Hassanein M, Hoeksema MD, Shiota M, Qian J, Harris BK, Chen H, et al. SLC1A5 mediates glutamine transport required for lung cancer cell growth and survival. Clinical cancer research : an official journal of the American Association for Cancer Research. 2013;19(3):560–570. doi: 10.1158/1078-0432.CCR-12-2334. [DOI] [PMC free article] [PubMed] [Google Scholar]
- 14.Son J, Lyssiotis CA, Ying H, Wang X, Hua S, Ligorio M, et al. Glutamine supports pancreatic cancer growth through a KRAS-regulated metabolic pathway. Nature. 2013;496(7443):101–105. doi: 10.1038/nature12040. [DOI] [PMC free article] [PubMed] [Google Scholar]
- 15.Gaglio D, Metallo CM, Gameiro PA, Hiller K, Danna LS, Balestrieri C, et al. Oncogenic K-Ras decouples glucose and glutamine metabolism to support cancer cell growth. Molecular systems biology. 2011;7:523. doi: 10.1038/msb.2011.56. [DOI] [PMC free article] [PubMed] [Google Scholar]
- 16.Eagle H. Nutrition needs of mammalian cells in tissue culture. Science. 1955;122:501–514. doi: 10.1126/science.122.3168.501. [DOI] [PubMed] [Google Scholar]
- 17.van den Heuvel AP, Jing J, Wooster RF, Bachman KE. Analysis of glutamine dependency in non-small cell lung cancer: GLS1 splice variant GAC is essential for cancer cell growth. Cancer Biol Ther. 2012;13:1185–1194. doi: 10.4161/cbt.21348. [DOI] [PMC free article] [PubMed] [Google Scholar]
- 18.Kung HN, Marks JR, Chi JT. Glutamine synthetase is a genetic determinant of cell type-specific glutamine independence in breast epithelia. PLoS genetics. 2011;7(8):e1002229. doi: 10.1371/journal.pgen.1002229. [DOI] [PMC free article] [PubMed] [Google Scholar]
- 19.McGivan JD, Bungard CI. The transport of glutamine into mammalian cells. Frontiers in bioscience : a journal and virtual library. 2006;12:874–882. doi: 10.2741/2109. [DOI] [PubMed] [Google Scholar]
- 20.Fuchs BC, Finger RE, Onan MC, Bode BP. ASCT2 silencing regulates mammalian target-of-rapamycin growth and survival signaling in human hepatoma cells. American journal of physiology Cell physiology. 2007;293(1):C55–C63. doi: 10.1152/ajpcell.00330.2006. [DOI] [PubMed] [Google Scholar]
- 21.Huang F, Zhao Y, Zhao J, Wu S, Jiang Y, Ma H, et al. Upregulated SLC1A5 promotes cell growth and survival in colorectal cancer. Int J Clin Exp Pathol. 2014;7(9):6006–6014. [PMC free article] [PubMed] [Google Scholar]
- 22.Wise DR, Thompson CB. Glutamine addiction: a new therapeutic target in cancer. Trends in biochemical sciences. 2010;35:427–433. doi: 10.1016/j.tibs.2010.05.003. [DOI] [PMC free article] [PubMed] [Google Scholar]
- 23.Adjei AA. Blocking oncogenic Ras signaling for cancer therapy. Journal of the National Cancer Institute. 2001;93:1062–1074. doi: 10.1093/jnci/93.14.1062. [DOI] [PubMed] [Google Scholar]
- 24.Prior IA, Lewis PD, Mattos C. A comprehensive survey of Ras mutations in cancer. Cancer research. 2012;72:2457–2467. doi: 10.1158/0008-5472.CAN-11-2612. [DOI] [PMC free article] [PubMed] [Google Scholar]
- 25.Takashima A, Faller DV. Targeting the RAS oncogene. Expert opinion on therapeutic targets. 2013;17:507–531. doi: 10.1517/14728222.2013.764990. [DOI] [PMC free article] [PubMed] [Google Scholar]
- 26.Dawson PJ, Wolman SR, Tait L, Heppner GH, Miller FR. MCF10AT: a model for the evolution of cancer from proliferative breast disease. The American journal of pathology. 1996;148:313–319. [PMC free article] [PubMed] [Google Scholar]
- 27.Zheng W, Tayyari F, Gowda GA, Raftery D, McLamore ES, Porterfield DM, et al. Altered glucose metabolism in Harvey-ras transformed MCF10A cells. Molecular carcinogenesis. 2013;54:111–120. doi: 10.1002/mc.22079. [DOI] [PMC free article] [PubMed] [Google Scholar]
- 28.Zheng W, Tayyari F, Gowda GA, Raftery D, McLamore ES, Shi J, et al. 1,25-dihydroxyvitamin D regulation of glucose metabolism in Harvey-ras transformed MCF10A human breast epithelial cells. The Journal of steroid biochemistry and molecular biology. 2013;138:81–89. doi: 10.1016/j.jsbmb.2013.03.012. [DOI] [PMC free article] [PubMed] [Google Scholar]
- 29.Esslinger CS, Cybulski KA, Rhoderick JF. Ngamma-aryl glutamine analogues as probes of the ASCT2 neutral amino acid transporter binding site. Bioorg Med Chem. 2005;13(4):1111–1118. doi: 10.1016/j.bmc.2004.11.028. [DOI] [PubMed] [Google Scholar]
- 30.Carlberg C, Polly P. Gene regulation by vitamin D3. Crit Rev Eukaryot Gene Expr. 1998;8(1):19–42. doi: 10.1615/critreveukargeneexpr.v8.i1.20. [DOI] [PubMed] [Google Scholar]
- 31.Hallmarks of Cancer: The Next Generation. Cell. 2011;144:646–674. doi: 10.1016/j.cell.2011.02.013. [DOI] [PubMed] [Google Scholar]
- 32.Ward PS, Thompson CB. Metabolic Reprogramming: A Cancer Hallmark Even Warburg Did Not Anticipate. Cancer cell. 2012;21:297–308. doi: 10.1016/j.ccr.2012.02.014. [DOI] [PMC free article] [PubMed] [Google Scholar]
- 33.Yuneva M, Zamboni N, Oefner P, Sachidanandam R, Lazebnik Y. Deficiency in glutamine but not glucose induces MYC-dependent apoptosis in human cells. The Journal of cell biology. 2007;178(1):93–105. doi: 10.1083/jcb.200703099. [DOI] [PMC free article] [PubMed] [Google Scholar]
- 34.Wang Q, Hardie RA, Hoy AJ, van Geldermalsen M, Gao D, Fazli L, et al. Targeting ASCT2-mediated glutamine uptake blocks prostate cancer growth and tumour development. The Journal of pathology. 2015;236:278–289. doi: 10.1002/path.4518. [DOI] [PMC free article] [PubMed] [Google Scholar]
- 35.Wang Q, Beaumont KA, Otte NJ, Font J, Bailey CG, Geldermalsen M, et al. Targeting glutamine transport to suppress melanoma cell growth. International Journal of Cancer. 2015;135(5):1060–1071. doi: 10.1002/ijc.28749. [DOI] [PubMed] [Google Scholar]
- 36.Willems L, Jacque N, Jacquel A, Neveux N, Maciel TT, Lambert M, et al. Inhibiting glutamine uptake represents an attractive new strategy for treating acute myeloid leukemia. Blood. 2013;122:3521–3532. doi: 10.1182/blood-2013-03-493163. [DOI] [PMC free article] [PubMed] [Google Scholar]
- 37.Kaira K, Sunose Y, Arakawa K, Sunaga N, Shimizu K, Tominaga H, et al. Clinicopathological significance of ASC amino acid transporter-2 expression in pancreatic ductal carcinoma. Histopathology. 2014;66:234–243. doi: 10.1111/his.12464. [DOI] [PubMed] [Google Scholar]
- 38.Shimizu K, Kaira K, Tomizawa Y, Sunaga N, Kawashima O, Oriuchi N, et al. ASC amino-acid transporter 2 (ASCT2) as a novel prognostic marker in non-small cell lung cancer. British journal of cancer. 2014;110(8):2030–2039. doi: 10.1038/bjc.2014.88. [DOI] [PMC free article] [PubMed] [Google Scholar]
- 39.Toyoda M, Kaira K, Ohshima Y, Ishioka NS, Shino M, Sakakura K, et al. Prognostic significance of amino-acid transporter expression (LAT1, ASCT2, and xCT) in surgically resected tongue cancer. British journal of cancer. 2014;110:2506–2513. doi: 10.1038/bjc.2014.178. [DOI] [PMC free article] [PubMed] [Google Scholar]


