Abstract
One well-established cause of ischemic stroke is atherosclerotic plaque rupture in the carotid artery. Rupture occurs when a tear in the fibrous cap exposes highly thrombogenic material in the lipid core. Though some fibrous cap material properties have been measured, such as ultimate tensile strength and stress-strain responses, there has been very little, if any, data published regarding the fracture behavior of atherosclerotic fibrous caps. This study aims to characterize the qualitative and quantitative fracture behavior of human atherosclerotic plaque tissue obtained from carotid endarterectomy samples using two different metrics. Uniaxial tensile experiments along with miniature single edge notched tensile (MSENT) experiments were performed on strips of isolated fibrous cap. Crack tip opening displacement (CTOD) and stress in the un-cracked segment (UCS) were measured at failure in fibrous cap MSENT specimens subjected to uniaxial tensile loading. Both CTOD and the degree of crack blunting, measured as the radius of curvature of the crack tip, increased as tearing propagated through the tissue. Higher initial stress in the UCS is significantly correlated with higher collagen content and lower macrophage content in the fibrous cap (ρ = 0.77, P = 0.009; ρ = −0.64, P = 0.047; respectively). Trends in the data show that higher CTOD is inversely related to collagen content, though the sample size in this study is insufficient to statistically substantiate this relationship. To the authors’ knowledge, this is the pioneering study examining the fracture behavior of fibrous caps and the first use of the CTOD metric in vascular tissue.
Keywords: Atherosclerosis, Plaque rupture, Crack tip opening displacement (CTOD), Crack blunting, Fracture mechanics
1. Introduction
Atherosclerotic plaque rupture can lead to myocardial infarction or ischemic stroke, two of the leading causes of death in the United States [1]. It is estimated that by 2030 there will be 3.4 million strokes in American adults, a 20% increase in prevalence since 2012 [2]. Atherosclerotic plaque rupture in the carotid artery can lead to stroke or transient ischemic attack (TIA), which affect approximately 795,000 and 5 million people each year, respectively. Strokes are one of the top causes of long-term disability, while also accounting for one in every 19 deaths in the US [2].
Ischemic stroke can be induced by multiple mechanisms. One well-established cause is plaque rupture, during which a tear in the fibrous cap of an atherosclerotic plaque exposes the highly thrombogenic necrotic core material. In some cases, the resulting thrombosis causes vessel occlusion, during which the patient will experience an ischemic stroke or TIA. Plaque rupture in the carotid artery accounts for approximately 15% of all ischemic strokes [3]. This mechanism generally occurs in lesions called a thin-cap fibroatheroma (TCFA), characterized by a thin fibrous cap covering a large necrotic core [4–7]. Though these morphological characteristics provide a good framework for identifying vulnerable plaques, the true test of plaque vulnerability is whether or not the mechanical strength of the tissue can withstand the physiological loading conditions to which it is subjected. When loads experienced in vivo exceed the mechanical strength of the fibrous cap, the tissue will fail, often resulting in thrombus formation that may lead to ischemic stroke. The extent of damage from plaque rupture varies. The thrombosis from plaque rupture may remain clinically silent if the thrombus does not completely occlude the vessel. However, healing of the rupture sites within the fibrous cap promotes further occlusion of the vessel, and frequently subsequent ruptures or erosions of the fibrous cap occur [4,5]. These subsequent ruptures or erosions may result in a clinical event. Therefore, identifying which fibrous caps are more likely to tear is a good predictor of which plaques are more likely to result in a clinical event.
The fibrous cap is composed of smooth muscle cells (SMCs), macrophages, and an extracellular matrix made up primarily of collagen and proteoglycans [7]. Collagen type I and collagen type III are the primary structural components [8] in fibrous caps and are responsible for much of the mechanical response of the tissue. SMCs and macrophages can secrete collagenases, such as matrix metalloproteinases (MMPs), which may weaken the fibrous cap by degrading collagen [9–11]. Relating the fracture behavior to the material constituents will provide insight into the structure-function roles within the fibrous cap.
In order to predict likelihood of plaque rupture, the first step is to identify the best metric to assess fracture toughness of the fibrous cap. While there is some information in the literature regarding quantitative measures of fibrous cap failure, such as ultimate tensile strength, the detailed failure mechanism of fibrous caps is not well understood. It is important to understand how the tissue fails in order to select the best metric to predict the failure of these tissues. This study will utilize a miniature single edge notched tensile (MSENT) test from which both strain-based fracture metrics and stress-based fracture metrics can be calculated.
With regard to quantitative metrics, several groups have previously used energy release rate to characterize fracture toughness in soft biological tissues, both in an adhesive layer [12–14], and within a biological tissue [15–17]. Though not used previously to characterize fracture toughness in vascular tissue, crack tip opening displacement (CTOD) was first proposed by Wells at the British Welding Institute to characterize failure in elastic-plastic yielding conditions [18]. Wells observed that plastic deformation resulted in blunting at the crack tip, and that the extent of crack-tip blunting increased in proportion to the toughness of the material. Later, Dawes showed that CTOD is linearly related to the J-integral in elastic-plastic conditions and that both are valid fracture parameters [19].
Since the fracture toughness of fibrous caps has not been studied, this study aims to quantitatively characterize the fracture behavior of fibrous caps using both the CTOD metric and the stress in the un-cracked segment (UCS) to assess fracture toughness. To the authors’ knowledge this is the first application of CTOD in vascular tissue.
2. Materials and methods
2.1. Sample preparation and dissection
The current study was approved by the IRB at Greenville Health System on September 3, 2013 and all patients gave written informed consent. In order to be considered for this study, patients must have greater than 50% stenosis in the carotid artery and a prior stroke or TIA, or greater than 70% carotid artery stenosis. Human carotid endarterectomy specimens were obtained from 8 patients at the time of surgery at Greenville Memorial Hospital (patient demographics in Table 1). Two plaque specimens generated multiple samples from the same patients (Samples III and IV; Samples VII and VIII). The excised specimens were immediately immersed in Belzer UW Cold Storage Solution (Bridge to Life Ltd., Columbia, SC, USA), a solution which helps to maintain organ viability prior to transplant [20,21], and were kept between 4 °C and 10 °C until testing. All mechanical testing was completed within 48 h of tissue harvest. The intact specimen, shown in Fig. 1 (left), ranges from approximately two to five cm in length. The specimen is nominally centered in the carotid artery bifurcation and usually contains portions of the common carotid artery (CCA), the internal carotid artery (ICA), and the external carotid artery (ECA). The intact specimen was sliced into a series of transverse slices nominally 5-mm thick (Fig. 1, center) using a custom slicing device. The fibrous cap was visually identified (Fig. 1, right) and carefully dissected from the remaining tissue using fine forceps and a scalpel.
Table 1.
Patient demographics.
| Sample ID | Gender | Age | Region of sample used for mechanical testing |
|---|---|---|---|
| I | M | 46 | Carotid Bulb |
| II | F | 89 | Common Carotid Artery |
| III | M | 84 | Carotid Bulb |
| IV | M | 84 | Carotid Bulb |
| V | M | 60 | Carotid Bulb |
| VI | M | 74 | Carotid Bulb |
| VII | M | 86 | Internal Carotid Artery |
| VIII | M | 86 | Internal Carotid Artery |
| IX | F | 74 | Internal Carotid Artery |
| X | F | 56 | Carotid Bulb |
Fig. 1.
Typical examples of specimens obtained from carotid endarterectomy. An intact specimen immediately following harvest is shown on the left, with the common carotid artery at the bottom. The specimens are sliced into a series of 5 mm rings, as shown in the center. A transverse view of one slice is shown on the right, with the fibrous cap, atheroma, and underlying media labeled.
2.2. Mechanical testing of isolated fibrous cap
All samples were subjected to tensile loading in the circumferential direction, corresponding to the direction of maximum wall stress (hoop stress). Two types of mechanical tests were performed. First, uniaxial tensile tests on the fibrous cap were performed to determine the stress-strain response of the fibrous cap. Then, the fracture behavior within the fibrous cap was examined. Immediately following the uniaxial tensile tests, a scalpel was used to introduce an initial flaw on one edge in the longitudinal direction, approximately at the midpoint between the two grips. The flaw orientation is nominally perpendicular to the longitudinal edge, with the loading applied parallel to the longitudinal edge (i.e., along the in vivo circumferential direction).
2.2.1. Experimental setup
The isolated fibrous cap was mounted into a set of metal grips, with 100 grit sandpaper on the inner surface to minimize slippage. The grips were connected to a Bose 3200 Test Instrument (Bose Corp., Framingham, MA, USA). One grip was stationary and connected to a load cell, while the other grip was connected to an actuator. All experiments were performed in displacement control. Both the uniaxial load and displacement were recorded at a rate of 2 Hz or higher during the experiment. Due to the unique geometry of each plaque specimen, in some cases the length of the isolated fibrous cap was very short (less than 15 mm). In the case of these short specimens, Dermabond Advanced (Ethicon Inc., Somerville, NJ, USA) (a topical skin adhesive) was added to the grips in order to further reduce the potential for specimen slippage within the grips.
Two charge-coupled device (CCD) cameras (Grasshopper GRAS-50S5 M, Point Grey Research, Richmond, BC, Canada) were positioned at a 90° offset from each other, one providing a front view and the other providing a side view of the tissue. Images were acquired at 1 Hz throughout each experiment. Small dots of black tissue marking dye were applied to the front face of the tissue in order to perform marker tracking and to measure the stretch ratio. The experiments were performed at a loading and unloading rate of 0.05 mm/s, with additional Belzer UW solution applied to the tissue at regular intervals (i.e., approximately every two minutes) during testing to prevent drying.
2.2.2. Uniaxial tensile experiments
Uniaxial tensile testing was performed to obtain the stress-strain response of the uncracked tissue. The tissue was preconditioned through multiple loading and unloading cycles until the maximum load at the end of each cycle reached steady state. The loading portion of the last cycle from each experiment was used to calculate the stress-strain response of the tissue. The stretch ratio was determined every second using the applied dot pattern. The Cauchy stress is determined by dividing the instantaneous force by the deformed cross-sectional area. The cross-sectional area was estimated using specimen width and thickness measurements from the images captured by the cameras. The resulting experimental stress-strain data points were fitted by a second order polynomial hyperelastic model using Abaqus (Version 6.13-2, Dassault Systèmes Simulia Corp., Providence, RI, USA) material data fitting tools.
2.2.3. Miniature single edge notched tensile experiments
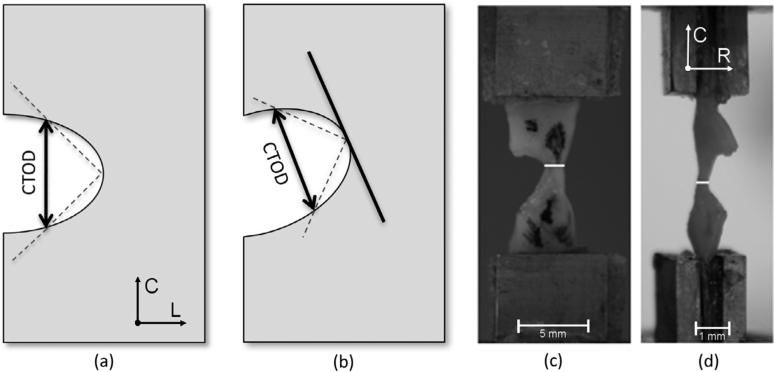
As discussed earlier, miniature single edge notched tensile (MSENT) experiments were performed on plaque specimens that were prepared with an initial crack perpendicular to the direction of the applied load. In these studies, the initial crack length was between 45% and 70% of the overall width of the tissue. Cyclical controlled displacement was applied such that the crack extended slowly during several cycles of loading; each crack extension is approximately 0.4 mm in length. For the ten specimens where crack extension in the nominally longitudinal direction occurred from the notch root region, the crack tip opening displacement (CTOD) is obtained as the crack extends using images acquired during the MSENT experiments1. CTOD is calculated by measuring the distance between the intersections of a 90 degree vertex centered at the crack tip with the crack edges, as first suggested by Rice [22]; a schematic is shown in Fig. 2. Additionally, the uniaxial average Cauchy stress in the UCS, σ, is determined at the initiation of tearing in each cycle as σ = F/(w * t), where F is the instantaneous measured load, w is the instantaneous current remaining width of the UCS and t is the instantaneous current measured thickness in the UCS. To assess the degree of crack tip blunting, the radius of curvature was measured at the initiation of tearing in each cycle by measuring the radius of the largest circle that would fit at the crack tip without overlapping the crack edges. Two independent reviewers performed the data analysis. The CTOD, crack extension, width of the UCS, and thickness of the UCS were each compared between reviewers to determine the sensitivity of the method and all measurements agreed within 10%.
Fig. 2.
A depiction of the CTOD measurement (a, b) and the geometry measurements required for the stress in the UCS calculations (c, d). CTOD is calculated by measuring the distance between the intersections of the sides of a 90 degree vertex centered at the crack tip. The axisymmetric case is shown in (a) and the non-axisymmetric case is shown in (b). The isolated fibrous cap is mounted in a pair of micro clamps in (c, d) and the current cross-sectional area is measured for the stress in the UCS calculations. The current cross-sectional area of the UCS is determined by measuring the current width (white line, c) and the current thickness (white line, d) of the UCS at the crack tip. The longitudinal (L), circumferential (C), and radial (R) directions are as shown.
2.3. Histological studies
After mechanical testing, the samples were fixed in a solution of 4% paraformaldehyde in 0.1 M phosphate buffer, pH 7.4, embedded in paraffin, and sectioned transversely at a thickness of 5 μm. To determine total collagen content, three sections, each from separate regions of the tissue, were stained in 0.1% Picrosirius Red (PSR) in saturated picric acid for 90 min, washed for 2 min in 0.01 M hydrochloric acid, dehydrated, cleared, and mounted in Permount.
To determine the smooth muscle cell (SMC) content in each sample, three sections were blocked in 10% goat serum and incubated with rabbit anti-smooth muscle alpha-actin (Thermo Scientific, Waltham, MA, 1:50 dilution). Following an incubation with horseradish peroxidase (HRP) conjugated goat anti-rabbit IgG (Bio-Rad, Hercules, CA, 1:1000 dilution), the signal was detected with 3, 3′ –diaminobenzidine (DAB) (Vector Laboratories, Burlingame, CA).
Macrophage content was also assessed in three sections of tissue from each fibrous cap specimen. The sections were first blocked with 1% bovine serum albumin and incubated with mouse anti-CD68 (Invitrogen, Carlsbad, CA, 1:100 dilution). Following successive incubations with biotinylated rabbit anti-mouse IgG (Jackson ImmunoResearch, West Grove, PA, 1:500 dilution) and with HRP-conjugated streptavidin (Jackson ImmunoResearch, West Grove, PA, 1:500 dilution), the signal was detected with DAB (Vector Laboratories, Burlingame, CA).
Images were captured with a Zeiss AxioCam CCD camera and analyzed using Image-Pro Plus software (Version 5.1.0.20, Media Cybernetics, Rockville, MD, USA). A 10X objective lens was used to collect all images from the samples. Several regions of each section were imaged, as the sections were sometimes too large to be completely visualized at 10X magnification. Measurements from within each section and between sections were averaged to produce a final value for each sample.
Collagen content was determined based on the fractional area of birefringence observed in the PSR-stained tissue sections. First, an image was collected in brightfield and the total tissue area was measured using Image-Pro Plus. Then the same field was examined under cross-polarized light and an image was collected. The area of the sample that showed green, yellow, or orange-red birefringence characteristic of collagen was then measured. The collagen content of the sample as a whole was calculated by comparing the birefringent area to the total tissue area. A similar process was used to determine the SMC and macrophage content of each sample. However, in these cases, the brown signal from the DAB was detected on the brightfield image and the autofluorescence of the tissue was used to determine the total tissue area.
2.4. Statistical analysis
Initially, all data sets were assessed for normality using the Shapiro-Wilk test. For normally-distributed variables, data are reported in terms of the mean and standard deviation and relationships between measured parameters were assessed using linear regression. For non-normally distributed variables, data from multiple samples are reported in terms of the median, first quartile (IQR1), and third quartile (IQR3) values and significant relationships between measured parameters were assessed using Spearman's Rho (ρ). ANOVA was used to assess the differences in area fractions of individual tissue components (collagen, smooth muscle cells, and macrophages) and Tukey's Honestly Significant Difference Test was used as a post-hoc ANOVA test. All tests were performed at a significance level of 0.05.
3. Results
3.1. Stress-strain curves
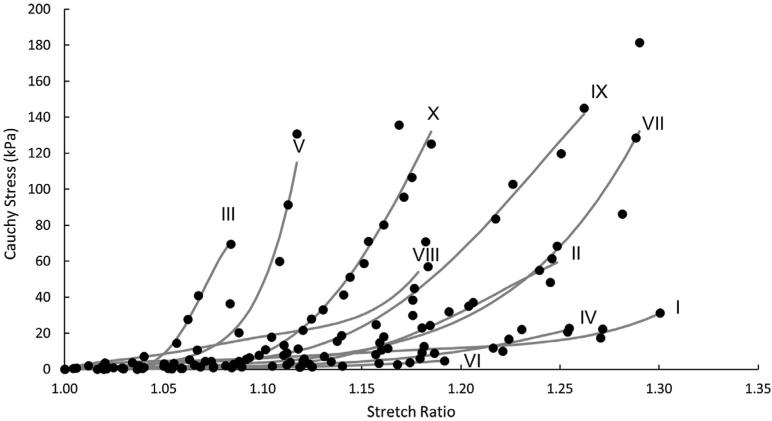
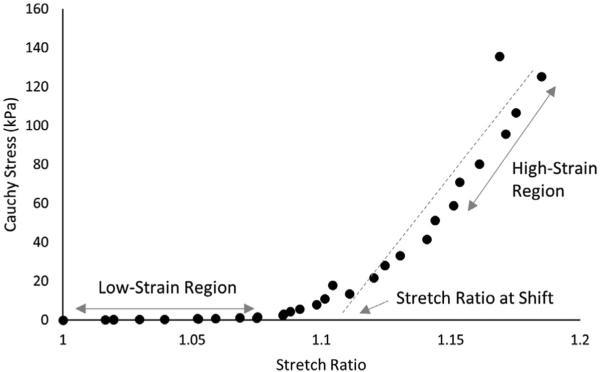
Fig. 3 presents the stress-strain curves for tensile loading of individual uncracked fibrous cap specimens. In our studies, each specimen exhibits non-linear response that is typical of vascular tissue. Further study of the data shown in Fig. 3 led the authors to extract subsets of the overall data that represent (a) the low-strain region and (b) the high-strain region. The stretch at which the shift between these two regions occurs is determined by the intersection of the final slope with the x-axis; a diagram is provided in Fig. 4. In addition, linear regression is performed on the data points in each of these subsets to identify the tangent modulus. Table 2 presents both the tangent moduli and the stretch ratio at which the shift between the two regions occurs. Results show that the mean low-strain tangent modulus (LSTM) is 64.3 ± 43.4 kPa, the mean high-strain tangent modulus (HSTM) is 1029.8 ± 795.4 kPa, and the mean stretch ratio at the shift between the two data sets is 1.11 ± 0.04. More detailed investigation of the data in Fig. 3 suggests that there are three major sub-groups in the stress-strain response; a stiff group (III, V), an intermediate group (II, VI, VII, VIII), and a compliant group (I, IV).
Fig. 3.
The stress-strain response of several fibrous caps. The dots represent experimental data points The solid curves represent predictions based on material model data fitting performed in Abaqus.
Fig. 4.
The low-strain tangent modulus (LSTM), high-strain tangent modulus (HSTM) and the stretch ratio at shift are determined from the stress-strain curves. Data from the low-strain region and high-strain region of each stress-strain curve are fit by linear regression to determine the low-strain tangent modulus and high-strain tangent modulus, respectively. The stretch ratio at shift is determined by calculating the intersection of the HSTM line with the X-axis.
Table 2.
Parameters describing the stress-strain response for each sample.
| Sample ID | LSTM (kPa) | HSTM (kPa) | Stretch ratio at shift |
|---|---|---|---|
| I | 60.7 | 142.8 | 1.11 |
| II | 16.3 | 536.8 | 1.14 |
| III | 90.9 | 1972 | 1.05 |
| IV | 20.5 | 205.2 | 1.15 |
| V | 75.4 | 2086 | 1.07 |
| VI | 6.64 | 44.77 | 1.09 |
| VII | 65.6 | 1303 | 1.19 |
| VIII | 149.1 | 963.0 | 1.09 |
| IX | 100.7 | 1050 | 1.13 |
| X | 56.8 | 1995 | 1.12 |
3.2. Crack tip opening displacement
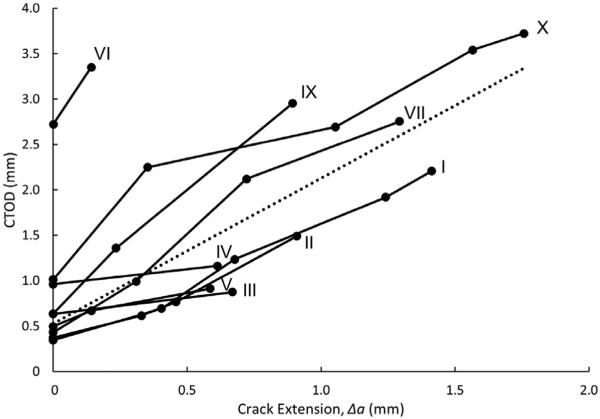
Fig. 5 presents the CTOD measurements for the fibrous cap specimens during crack extension. As shown in Fig. 5, CTOD increases with increasing crack extension. This behavior is consistent with ductile materials that exhibit crack tip blunting. In these studies with relatively small specimens, the overall amount of crack extension is limited by the geometry of the sample and by the size of the initial crack. Inspection of the data in Fig. 5 suggests that CTOD is a linearly increasing function of crack extension. The median [IQR 1, IQR 3] initial CTOD is 0.54 [0.42,0.71] mm, and the mean slope of the CTOD measurements is 1.22 ± 0.76. It is important to note that, in almost all the plaque specimens, the initial CTOD values are clustered around 0.5 mm, with the exception of samples IV, VI and X, which have higher initial CTOD values (0.96 mm, 2.73 mm, and 1.01 mm, respectively).
Fig. 5.
The CTOD increases with crack extension (Δa) for each specimen. The dashed line shows a trendline through all CTOD data points.
In addition to the CTOD measurements, the radius of curvature of the crack tip is quantified at the initiation of tearing for each sample as a metric for the degree of crack tip blunting. Two samples exhibited such a high degree of blunting that a 90° vertex did not intersect the edges of the crack. In these cases, CTOD could not be calculated using the 90° intersection definition (a) for the entire duration of crack extension in sample VIII and (b) for the final part of crack extension in sample VI. Even so, in all cases the radius of curvature of the crack tip at the initiation of tearing was measured. The median [IQR 1, IQR 3] radius of curvature of the crack tip at initial tearing is 0.24 [0.13,0.27] mm.
3.3. Stress in the un-cracked segment
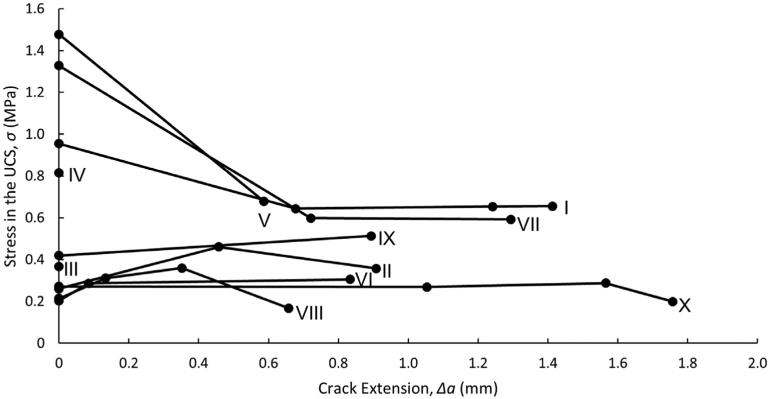
Stress in the UCS was calculated at the initiation of tearing for each cycle, with median [IQR 1, IQR 3] values of 0.393 [0.263,0.920] MPa. The stress in the UCS is plotted versus crack extension in Fig. 6. There appear to be two groups of responses. One group (I, V, VII) has a high initial stress in the UCS, followed by much lower stresses at the initiation of additional crack extension. The other group (II, VI, VIII, IX, X) has relatively constant stresses in the UCS. Samples III and IV only had one cycle of tearing and therefore only one stress calculation. Additionally, when Figs. 5 and 6 are compared, it is clear that CTOD and stress in the UCS are not directly related. While CTOD is a strictly increasing function of crack extension, stress in the UCS is essentially constant after an initial decrease in some cases. The crack extension values are different between Figs. 5 and 6 due to the analysis method used for each figure. In Fig. 6, the goal was to measure the initiation stress for each cycle and therefore the stress in the uncracked segment is only measured at the initiation of tearing for each cycle. For samples with only one cycle of data, such as sample III, there is only one measurement of stress in the UCS. On the other hand, in Fig. 5, the goal was to measure the initial CTOD in the very first cycle and visualize how CTOD changes with increasing crack extension. Therefore, CTOD was measured at the initiation of the first cycle and at the maximum displacement in every cycle (including the initial cycle). Samples with only one cycle of data have only one stress measurement, but two CTOD measurements.
Fig. 6.
Stress in the UCS versus crack extension for each specimen. Samples III and IV only had one cycle of tearing and therefore were not evaluated at multiple crack extensions.
3.4. Relationships between fibrous cap constituents and mechanical test data
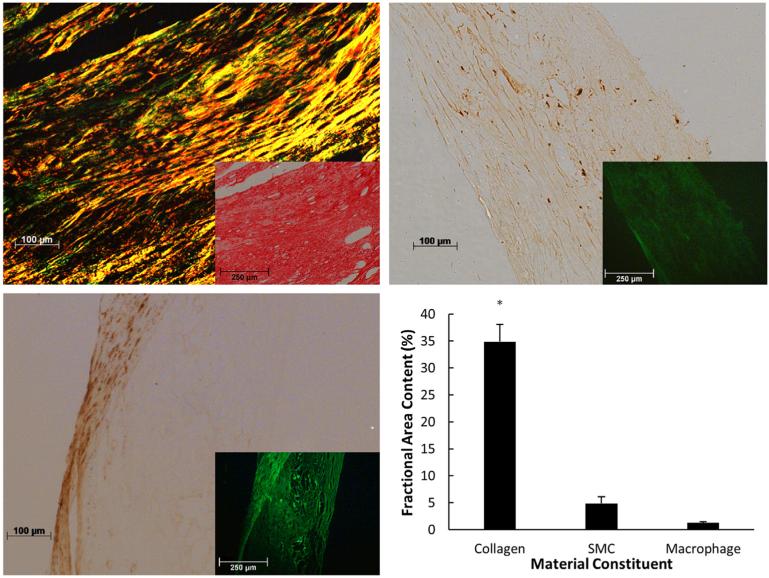
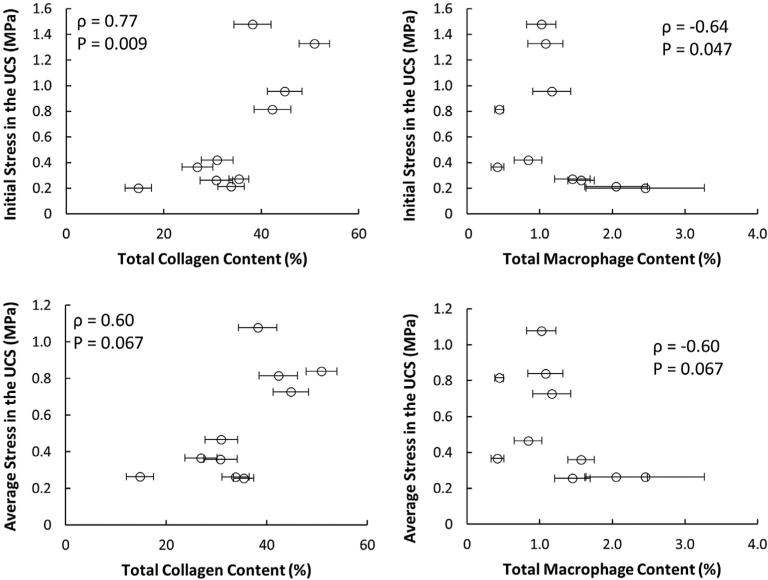
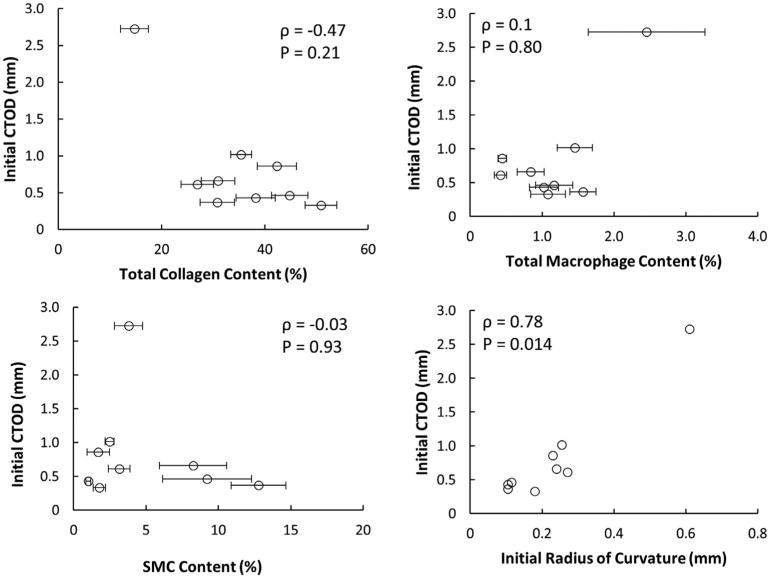
Collagen content, SMC content, and macrophage content were calculated in each specimen after mechanical testing. Collagen was the dominant constituent in the fibrous caps (34.9% ± 10.1%), followed by SMC (4.8% ± 3.9%), and macrophages (1.3% ± 0.7%). ANOVA followed by Tukey's Honest Significant Difference test confirms that collagen in the fibrous caps is significantly more abundant than the other measured constituents (Fig. 7). The stress in the UCS at failure initiation in the first cycle depends on both collagen content (ρ = 0.77, P = 0.009) and macrophage content (ρ = −0.64, P = 0.047), though the effect of SMC content was not statistically significant (ρ = −0.49, P = 0.15). However, when the stress in the UCS is averaged over each cycle, none of the constituents have significant effects on the stress in the UCS (Fig. 8). Results in Fig. 9 (top left) show that the initial CTOD appears to decrease with collagen content. However, due to the limited sample size with only one data point for low collagen content, the trend is not statistically significant (ρ = −0.47, P = 0.2). The effect of collagen content on CTOD at fixed values of crack extension was assessed and no significant trends were found (data not shown). Also, data in Fig. 9 (top right) indicates that CTOD and macrophage content do not have a statistically significant relationship (ρ = 0.1, P = 0.80). SMC content does not affect any of the fracture parameters. The statistical relationships between fibrous cap composition and fracture parameters are summarized in Table 3.
Fig. 7.
Representative images from PSR staining (top left), total macrophage immunohistochemistry (IHC) (top right), SMC IHC (bottom left) and the quantified results (bottom right). Insets represent images used to quantify total tissue area. Collagen is significantly more abundant than SMCs or macrophages in the fibrous cap (*denotes p < 0.01). Error bars represent standard error.
Fig. 8.
The initial stress in the UCS is affected by collagen and macrophage content. There are statistically significant relationships between both collagen content (top left) and macrophage content (top right) with the stress in the uncracked segment for the initial tearing cycle. While the trends are similar when the stress in the UCS is averaged over all cycles, the trends are no longer significant with either collagen content (bottom left) or macrophage content (bottom right). No significant relationship is observed between SMCs and stress in the UCS (data not shown). ρ denotes rho, and P represents the P-value associated with a significant relationship between the two variables. Error bars represent standard error.
Fig. 9.
Initial CTOD does not depend on fibrous cap constituents but is related to radius of curvature. There is an inverse trend between total collagen content and initial CTOD and a direct trend between total macrophage content and initial CTOD, but neither relationship is statistically significant. There is no clear trend between SMC content and initial CTOD. There is a statistically significant relationship between initial CTOD and initial radius of curvature at the crack tip.
Table 3.
Summary of key statistical findings of relationships between selected parameters.
| Parameter 1 | Parameter 2 | Spearman's Rho (ρ) | Statistically significant |
|---|---|---|---|
| Collagen Content | Initial CTOD | –0.47 | No (P = 0.21) |
| Collagen Content | Initial Stress in the UCS | 0.77 | Yes (P = 0.009) |
| Collagen Content | Average Stress in the UCS | 0.60 | No (P = 0.067) |
| Macrophage Content | Initial CTOD | 0.10 | No (P = 0.80) |
| Macrophage Content | Initial Stress in the UCS | –0.64 | Yes (P = 0.047) |
| Macrophage Content | Average Stress in the UCS | 0.60 | No (P = 0.067) |
| SMC Content | Initial CTOD | –0.03 | No (P = 0.93) |
| SMC Content | Initial Stress in the UCS | –0.49 | No (P = 0.15) |
| SMC Content | Average Stress in the UCS | –0.45 | No (P = 0.19) |
| Initial Radius of Curvature | Initial CTOD | 0.78 | Yes (P = 0.014) |
3.5. Other observations of tissue behavior
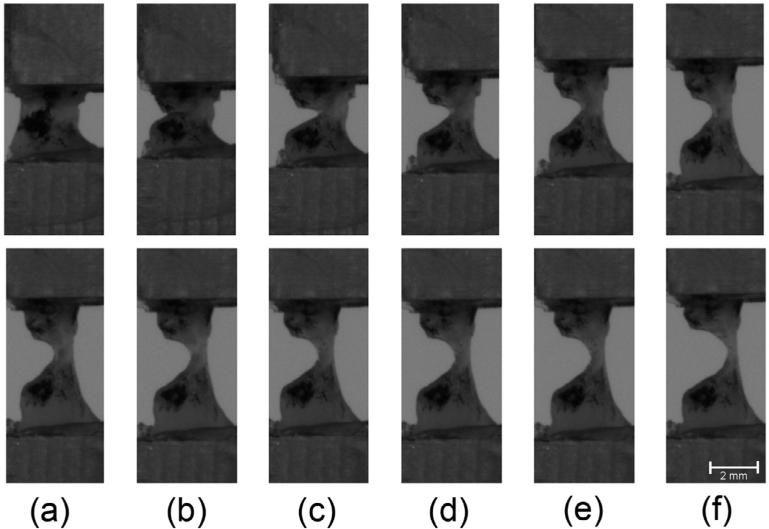
During the MSENT experiments, the crack tip exhibited blunting in each sample. Fig. 10 shows a representative series of images of the crack both before and during tissue failure. The radius of curvature of the crack tip increased with each consecutive cycle in every specimen, showing that the degree of crack tip blunting increases with crack extension. Wells noted that crack tip blunting increased directly with an increase in toughness of the material [18]. To examine whether or not our results also show this trend, the initial CTOD and the initial radius of curvature of the crack tip were compared. We find a significant direct correlation (ρ = 0.78, P = 0.014), shown in Fig. 9, that matches Wells' observations.
Fig. 10.
Blunting of the crack tip progresses as the tissue tears. The first row shows the initial, intact specimen (a), the specimen immediately after the notch is made (b), and the specimen during the deformation before tearing initiated (c-f). The bottom row shows the progression of blunting as tearing progresses in the tissue (a-f).
Both the initial crack length and the initial geometry of the fibrous cap varied from sample to sample (mean initial crack length = 2.66 mm ± 0.83 mm; mean initial thickness = 1.36 mm ± 0.55 mm, range 0.43–2.25 mm). There is no observable significant change in any of the measured or calculated fracture parameters based on the varied initial crack length or initial thickness.
4. Discussion
The material properties of fibrous caps exhibit substantial variability, which is consistent with previous observations of stress-strain curves [17–24]. To the authors’ knowledge, this is the first study that has investigated the fracture behavior of fibrous cap tissue and the first to use CTOD as a fracture parameter in vascular tissue. The results show that the initial fracture stress increases with collagen content and decreases with macrophage content, potentially due to the macrophages secreting collagenases such as MMPs. Though the data suggests that there is an inverse relationship between CTOD and collagen content, the limited number of samples is insufficient to provide statistical confidence in this observation. Additional experimental studies and possibly further investigation of the fine tissue structure, such as degree of calcification and collagen fiber orientation, may be required to understand the failure process in fibrous caps fully.
4.1. Validity of results
Obtaining valid fracture toughness measurements in soft biological materials is inherently difficult, primarily due to limitations of specimen size. The results in this study show that CTOD increases with crack length, due to an increase in blunting of the crack tip with each increment of crack extension. While the size limitations of fibrous cap specimens make it difficult, if not impossible, to obtain adequate samples for ASTM standardized testing for fracture toughness experiments, these results can still be used to add to the understanding of fibrous cap failure. Atherosclerotic fibrous caps are notoriously heterogeneous tissues [23]. For this reason, a metric that can provide insight into the relative mechanical strength of fibrous caps is beneficial. The fracture parameters quantified in this study can be used to compare resistance to failure between samples from different patients and to infer which fibrous caps are more likely to rupture under specific loading conditions.
4.2. Effect of material constituents
The results from this study show that total collagen content and total macrophage content affect the mechanical strength of the fibrous cap. Previous studies have shown that the tearing stress in the fibrous cap is affected by both collagen content and macrophage content [24–26]; these trends are consistent with our observations. This study has shown that while the initial tearing stress can be statistically predicted using the tissue components, the CTOD and the radius of curvature cannot be statistically related to the same parameters in this study. The authors believe that these trends will become statistically significant with increased sample size. However, it is also possible that the organization of the collagen fibers is the critical parameter necessary to describe the strain-based fracture of fibrous caps.
It is well known that the orientation of collagen fibers in a biological material is important in defining the mechanical response [27–29]. If collagen fibers are aligned parallel to the direction of loading (circumferential orientation), as seen in the arterial media, then the fibers will increase tensile strength. However, if collagen fibers are oriented perpendicular to the loading direction (longitudinal orientation), they will have very little impact on the material response. In this case, the mechanical response will be controlled by the interactions between the fibers and the remaining extracellular matrix, rather than by the fibers themselves. Collagen organization in the fibrous cap is frequently assumed to be isotropic. However, Akylidiz et al. recently have found anisotropic collagen fiber organization in atherosclerotic plaques [30]. The collagen fiber organization has not been examined in this study and is relevant future work.
4.3. Notch sensitivity
The effect of the presence of a notch on the mechanical strength of a material oftentimes is measured by the notch sensitivity ratio (NSR). NSR is the ratio of the notch strength, or stress required to tear the material when a notch is present, to the ultimate tensile strength (UTS), which is the stress at which failure initiates in an un-cracked material. A NSR of 1 is indicative of a material that is not weakened by the presence of a notch and is known as a notch-insensitive material [31,32]. Ideally, the tensile strength would be measured in an un-cracked specimen and in a cracked specimen with the same material properties, and the results would be compared pairwise. This approach is logistically difficult in fibrous cap tissue due to the small size of the specimens and heterogeneity of material properties. Even samples from the same patient can have noticeably different results (for example: samples III and IV, samples VII and VIII in this study).
Since our current study has not obtained ultimate tensile strength data for the small plaque specimens, previous results from the literature may provide some insight. A few studies measured the UTS of whole plaque specimens [33–35] and at least two studies measured UTS in isolated fibrous cap tissue [36,37]. Teng et al. report a median [IQR 1, IQR 3] UTS of 0.158 [0.0721, 0.259] MPa in fibrous caps from symptomatic patients [36], which is much lower than the stress measurements presented in this study of 0.366 [0.279,0.648] MPa in fibrous caps from asymptomatic patients. Holzapfel et al. report a median UTS of 0.290 MPa in isolated fibrous caps from iliac atherosclerotic lesions tested in the circumferential direction [37]. These results suggest a NSR between 1.3 and 2.3, which is indicative of a notch-strengthening material. It should be noted that an apparent NSR greater than one in this case may reflect a difference in material properties between plaques from symptomatic versus asymptomatic patients or from iliac versus carotid arteries, rather than the effect of the notch. Future work should include measuring the UTS of carotid fibrous caps from asymptomatic patients. Ultimate tensile strength (UTS) has been used to assess material strength in healthy vascular tissue as well. Holzapfel et al. report average UTS of 0.488 MPa, 0.202 MPa, and 1.031 MPa for the non-diseased intima, media, and adventitia, respectively [37]. When compared to the results from this study, it is clear that the fibrous cap is a weakened disease state of the intima, based on the observed reduced stresses at failure.
Additionally, the frequent observation of failure away from the crack tip supports the idea of a relatively high NSR (≥1). In such cases, tissues with a higher NSR do not have a significant stress concentration at the crack tip. Therefore, the material is not predisposed to fail preferentially at the notch tip. It is further noted that notch insensitivity or defect tolerance is expected to occur in highly fibrous tissues with a relatively uniform fiber orientation when loaded parallel to the predominant fiber direction. If the bonding between fibers is relatively poor, then the stress cannot be transmitted between fibers and the tissue essentially acts as a series of independent fibers [38].
Clinically, notch insensitivity could be a very beneficial material behavior for fibrous caps. If a flaw does not create a stress concentration in the fibrous cap, this gives the tissue an opportunity to heal over time, as long as the critical fracture criterion is not exceeded during the healing process. For example, if high blood pressure is experienced for a short time and a small tear occurs in the fibrous cap, the event may remain clinically silent since the tear will not readily propagate. If the blood pressure is then lowered, the fibrous cap could repair this tear over time without an increased risk for future plaque rupture events. However, if high blood pressure is uncontrolled and maintained long term, the critical failure criterion of the tissue may be exceeded and the tissue could continue to tear, resulting in a clinical event such as a stroke or TIA. It is important to note that this analysis does not consider the effects of material fatigue, which may also play a significant role in plaque rupture.
4.4. Fracture parameters for fibrous caps
Generally, fibrous cap stability has been assessed by the stress at which failure occurs, rather than the CTOD or the strain, but our results and the following discussion suggest that stress may not always be the most appropriate metric to use. As mentioned in section 3.3, CTOD and stress in the UCS are not directly related. The trends between collagen content and initial stress in the UCS (Fig. 8, top left) and collagen content and initial CTOD (Fig. 9, top left) clearly show that the fracture parameters present conflicting rankings of mechanical strength. Therefore, both metrics are necessary to assess the likelihood of failure completely. Plaques with high collagen content are able to withstand high stresses, though they may still be vulnerable to a strain-based fracture of the fibrous cap. Fibrous caps that fail at a lower CTOD, or lower strain, are at a higher risk for plaque delamination. If the fibrous cap is unable to deform to the same extent as the media, plaque dissection may occur at the shoulders, a prominent event during balloon angioplasty [39–41]. This effect has also been demonstrated in a finite element model where the plaque tissue is approximately one order of magnitude stiffer than the medial layer [42]. A mismatch in material properties between the media and the intima may contribute to the high frequency of plaque ruptures at the plaque shoulders.
Relating the fracture parameters to clinically measurable variables may aid clinicians in selecting optimal treatment for individual patients. In particular, an estimate of the plaque mechanical properties could help guide the optimal treatment for carotid artery stenosis. Carotid endarterectomy (CEA) is generally considered the gold standard of treatment for carotid artery stenosis, but recently carotid artery stenting (CAS) has been suggested as an alternative, less invasive, technique. CAS has been shown to result in more strokes during the periprocedural period than CEA [43–45], which may be a result of the high strain applied on fibrous caps during balloon angioplasty. This increased risk of stroke during the periprocedural period may be reduced if the mechanical properties of the plaque are considered prior to selecting a treatment.
4.5. Limitations
This study has only examined the total collagen content of fibrous caps, and more detailed analysis of the 3D collagen architecture and collagen types (collagen I and collagen III, in particular) is relevant future work. Additionally, collagenases, such as MMPs, have not been investigated in this study. MMPs have been shown to degrade collagen fibers in atherosclerotic plaques, which can lead to a reduction in the tensile strength of the fibrous cap and increase plaque vulnerability [46–48].
This study has investigated plaque mechanical properties in the circumferential direction. Recently it has been shown that under hyperemic blood flow, the axial plaque stresses, while much lower than those required to cause tissue failure as reported here, may contribute to axial localization of plaque rupture (i.e., proximal vs. distal) [49]. Increased axial stress under hyperemic conditions is expected to have the greatest influence in acute coronary syndromes that occur during exertion [50]. Thus, fracture behavior of fibrous caps in the axial direction may also be of interest in future investigations.
5. Conclusions
This study shows, for the first time, that CTOD can be used as a comparative metric for fracture toughness in atherosclerotic fibrous cap samples from individual patients. The initial fracture stress in the UCS is related to the collagen and macrophage content of the fibrous cap. Though trends in the data show that higher CTOD is inversely related to collagen content, the sample size in this study is insufficient to statistically substantiate this relationship. Thus, collagen and macrophage content cannot be statistically shown to be related to CTOD at failure in fibrous caps. Additionally, the results suggest that fibrous caps may exhibit notch insensitivity or even notch strengthening behavior. Lastly, the results show that analyzing the stress in fibrous caps provides only one part of the picture when considering plaque rupture. Stress in the UCS and CTOD present conflicting rankings of mechanical strength, suggesting that both metrics should be evaluated when assessing plaque stability. The strain, or deformation, which a fibrous cap is able to withstand is also an important aspect of plaque stability which is often ignored in the analysis of plaque rupture.
Statement of Significance.
A tear in the fibrous cap of atherosclerotic plaque can lead to ischemic stroke or myocardial infarction. While there is some information in the literature regarding quantitative measures of fibrous cap failure, there is little information regarding the behavior of the tissue during failure. This study examines the failure behavior of fibrous caps both qualitatively, by examining how and where the tissue fails, and quantitatively, by measuring (a) crack tip opening displacement (CTOD) in vascular tissue for the first time and (b) uniaxial stress in the un-cracked segment (UCS). This study shows that both metrics should be evaluated when assessing plaque vulnerability.
Acknowledgments
The authors would like to acknowledge financial support from the National Science Foundation through Grant number CMMI-1200358. The authors would also like to acknowledge financial support from the National Institutes of Health through Grant number 1R03 EB019663-01A1, and funding through the Aspire II program from the Office of the Vice President of Research at the University of South Carolina. The funding organizations played no role in the study design, data analysis, or manuscript preparation.
Footnotes
Of the 34 specimens used in our experiments, 13 specimens (38%) failed in the grip region, 6 (18%) specimens failed in regions away from both the grips and the notch root and 5 (15%) specimens exhibited tearing across the thickness. Results from these experiments are not included in this paper.
Disclosures
The authors have no conflicts of interest to disclose.
References
- 1.Heron M. Deaths: Leading causes for 2010. Nat. Vital Stat. Rep. 2013;62 [PubMed] [Google Scholar]
- 2.Go AS, Mozaffarian D, Roger VL, Benjamin EJ, Berry JD, Blaha MJ, Dai S, Ford ES, Fox CS, Franco S, Fullerton HJ, Gillespie C, Hailpern SM, Heit JA, Howard VJ, Huffman MD, Judd SE, Kissela BM, Kittner SJ, Lackland DT, Lichtman JH, Lisabeth LD, Mackey RH, Magid DJ, Marcus GM, Marelli A, Matchar DB, McGuire DK, Mohler ER, III, Moy CS, Mussolino ME, Neumar RW, Nichol G, Pandey DK, Paynter NP, Reeves MJ, Sorlie PD, Stein J, Towfighi A, Turan TN, Virani SS, Wong ND, Woo D, Turner MB. Heart disease and stroke statistics–2014 update: a report from the American Heart Association. Circulation. 2014;128 doi: 10.1161/01.cir.0000441139.02102.80. http://dx.doi.org/10.1161/01.cir.0000441139.02102.80. [DOI] [PMC free article] [PubMed] [Google Scholar]
- 3.Petty GW, Brown RD, Whisnant JP, Sicks JD, O'Fallon WM, Wiebers DO. Ischemic stroke subtypes: a population-based study of incidence and risk factors. Stroke. 1999;30:2513–2516. doi: 10.1161/01.str.30.12.2513. http://dx.doi.org/10.1161/01.STR.30.12.2513. [DOI] [PubMed] [Google Scholar]
- 4.Burke AP, Kolodgie FD, Farb A, Weber DK, Malcom GT, Smialek J, Virmani R. Healed plaque ruptures and sudden coronary death: Evidence that subclinical rupture has a role in plaque progression. Circulation. 2001;103:934–940. doi: 10.1161/01.cir.103.7.934. http://dx.doi.org/10.1161/01.CIR.103.7.934. [DOI] [PubMed] [Google Scholar]
- 5.Bentzon JF, Otsuka F, Virmani R, Falk E. Mechanisms of plaque formation and rupture. Circ. Res. 2014;114:1852–1866. doi: 10.1161/CIRCRESAHA.114.302721. http://dx.doi.org/10.1161/CIRCRESAHA.114.302721. [DOI] [PubMed] [Google Scholar]
- 6.Finn AV, Nakano M, Narula J, Kolodgie FD, Virmani R. Concept of vulnerable/unstable plaque. Arterioscler. Thromb. Vasc. Biol. 2010;30:1282–1292. doi: 10.1161/ATVBAHA.108.179739. http://dx.doi.org/10.1161/ATVBAHA.108.179739. [DOI] [PubMed] [Google Scholar]
- 7.Virmani R, Kolodgie FD, Burke AP, Farb A, Schwartz SM. Lessons from sudden coronary death: a comprehensive morphological classification scheme for atherosclerotic lesions. Arterioscler. Thromb. Vasc. Biol. 2000;20:1262–1275. doi: 10.1161/01.atv.20.5.1262. http://dx.doi.org/10.1161/01.ATV.20.5.1262. [DOI] [PubMed] [Google Scholar]
- 8.Shekhonin BV, Domogatsky SP, Idelson GL, Koteliansky VE, Rukosuev V. Relative distribution of fibronectin and type I, III, IV, V collagens in normal and atherosclerotic intima of human arteries. Atherosclerosis. 1987;67:9–16. doi: 10.1016/0021-9150(87)90259-0. [DOI] [PubMed] [Google Scholar]
- 9.Libby P. Molecular bases of the acute coronary syndromes. Circulation. 1995;91:2844–2850. doi: 10.1161/01.cir.91.11.2844. http://dx.doi.org/10.1161/01.CIR.91.11.2844. [DOI] [PubMed] [Google Scholar]
- 10.Nikkari ST, O'Brien KD, Ferguson M, Hatsukami T, Welgus HG, Alpers CE, Clowes AW. Interstitial collagenase (MMP-1) expression in human carotid atherosclerosis. Circulation. 1995;92:1393–1398. doi: 10.1161/01.cir.92.6.1393. http://dx.doi.org/10.1161/01.CIR.92.6.1393. [DOI] [PubMed] [Google Scholar]
- 11.Uzui H, Harpf A, Liu M, Doherty TM, Shukla A, Chai NN, Tripathi PV, Jovinge S, Wilkin DJ, Asotra K, Shah PK, Rajavashisth TB. Increased expression of membrane type 3-matrix metalloproteinase in human atherosclerotic plaque: role of activated macrophages and inflammatory cytokines. Circulation. 2002;106:3024–3030. doi: 10.1161/01.cir.0000041433.94868.12. http://dx.doi.org/10.1161/01.CIR.0000041433.94868.12. [DOI] [PubMed] [Google Scholar]
- 12.Wang Y, Johnson JA, Spinale FG, Sutton MA, Lessner SM. Quantitative measurement of dissection resistance in intimal and medial layers of human coronary arteries. Exp. Mech. 2014;54:677–683. doi: 10.1007/s11340-013-9836-0. http://dx.doi.org/10.1007/s11340-013-9836-0. [DOI] [PMC free article] [PubMed] [Google Scholar]
- 13.Wang Y, Ning J, Johnson JA, Sutton MA, Lessner SM. Development of a quantitative mechanical test of atherosclerotic plaque stability. J. Biomech. 2011;44:2439–2445. doi: 10.1016/j.jbiomech.2011.06.026. http://dx.doi.org/10.1016/j.jbiomech.2011.06.026. [DOI] [PMC free article] [PubMed] [Google Scholar]
- 14.Wang Y, Johnson JA, Fulp A, Sutton MA, Lessner SM. Adhesive strength of atherosclerotic plaque in a mouse model depends on local collagen content and elastin fragmentation. J. Biomech. 2013;46:716–722. doi: 10.1016/j.jbiomech.2012.11.041. http://dx.doi.org/10.1016/j.jbiomech.2012.11.041. [DOI] [PMC free article] [PubMed] [Google Scholar]
- 15.Taylor D, O'Mara N, Ryan E, Takaza M, Simms C. The fracture toughness of soft tissues. J. Mech. Behav. Biomed. Mater. 2012;6:139–147. doi: 10.1016/j.jmbbm.2011.09.018. http://dx.doi.org/10.1016/j.jmbbm.2011.09.018. [DOI] [PubMed] [Google Scholar]
- 16.Chin-Purcell MV, Lewis JL. Fracture of articular cartilage. J. Biomech. Eng. 1996;118:545–556. doi: 10.1115/1.2796042. [DOI] [PubMed] [Google Scholar]
- 17.Chu B, Gaillard E, Mongrain R, Reiter S, Tardif J-C. Characterization of fracture toughness exhaustion in pig aorta. J. Mech. Behav. Biomed. Mater. 2013;17:126–136. doi: 10.1016/j.jmbbm.2012.08.007. http://dx.doi.org/10.1016/j.jmbbm.2012.08.007. [DOI] [PubMed] [Google Scholar]
- 18.Wells AA. Application of fracture mechanics at and beyond general yielding. Br. Weld. J. 1963;10:563–570. http://dx.doi.org/10.1002/9780470827826.ch7. [Google Scholar]
- 19.Dawes MG. Elastic-plastic fracture toughness based on the COD and J-Contour Integral concepts. ASTM STP. 1979;668:307–333. [Google Scholar]
- 20.Fahner PJ, Legemate DA, van der Wal AC, van Marle J, Peters SLM, van Eck CF, van Gulik TM, Idu MM. Comparison of preserved vascular allografts using glycerol and University of Wisconsin solution in a goat carotid artery transplantation model. Eur. Surg. Res. 2012;48:64–72. doi: 10.1159/000334170. http://dx.doi.org/10.1177/1745691612459060. [DOI] [PubMed] [Google Scholar]
- 21.Stewart ZA. UW solution: Still the “gold standard” for liver transplantation. Am. J. Transplant. 2015;15:295–296. doi: 10.1111/ajt.13062. http://dx.doi.org/10.1111/ajt.13062. [DOI] [PubMed] [Google Scholar]
- 22.Rice JR. A path independent integral and the approximate analysis of strain concentration by notches and cracks. J. Appl. Mech. 1968;35:379–386. http://dx.doi.org/10.1115/1.3601206. [Google Scholar]
- 23.Akyildiz AC, Speelman L, Gijsen FJH. Mechanical properties of human atherosclerotic intima tissue. J. Biomech. 2014;47:773–783. doi: 10.1016/j.jbiomech.2014.01.019. http://dx.doi.org/10.1016/j.jbiomech.2014.01.019. [DOI] [PubMed] [Google Scholar]
- 24.Lendon CL, Briggs AD, Born GVR, Burleigh MC, Davies MJ. Mechanical testing of connective tissue in the search for determinants of atherosclerotic plaque cap rupture. Biochem. Soc. Trans. 1988;16:1032–1033. [Google Scholar]
- 25.Lendon CL, Davies MJ, Born GV, Richardson PD. Atherosclerotic plaque caps are locally weakened when macrophage density is increased. Atherosclerosis. 1991;87:87–90. doi: 10.1016/0021-9150(91)90235-u. [DOI] [PubMed] [Google Scholar]
- 26.Burleigh MC, Briggs AD, Lendon CL, Davies MJ, Born GVR, Richardson PD. Collagen types I and III, collagen content, GAGs and mechanical strength of human atherosclerotic plaque caps: span-wise variations. Atherosclerosis. 1992;96:71–81. doi: 10.1016/0021-9150(92)90039-j. [DOI] [PubMed] [Google Scholar]
- 27.Schmid F, Sommer G, Rappolt M, Schulze-Bauer CAJ, Regitnig P, Holzapfel GA, Laggner P, Amenitsch H. In situ tensile testing of human aortas by time-resolved small-angle X-ray scattering. J. Synchrotron Radiat. 2005;12:727–733. doi: 10.1107/S0909049505012549. http://dx.doi.org/10.1107/S0909049505012549. [DOI] [PubMed] [Google Scholar]
- 28.Elliott D, Lynch H, Johannessen W, Wu J, Wu A. Effect of fiber orientation and strain rate on nonlinear tendon tensile properties. J. Biomech. Eng. 2003;125:726–731. doi: 10.1115/1.1614819. http://dx.doi.org/10.1115/1.1614819. [DOI] [PubMed] [Google Scholar]
- 29.Lake SP, Miller KS, Elliott DM, Soslowsky LJ. Effect of fiber distribution and realignment on the nonlinear and inhomogeneous mechanical properties of human supraspinatus tendon under longitudinal tensile loading. J. Orthop. Res. 2009;27:1596–1602. doi: 10.1002/jor.20938. http://dx.doi.org/10.1002/jor.20938. [DOI] [PMC free article] [PubMed] [Google Scholar]
- 30.Akyildiz AC, Speelman L, Chai C-K, Oomens C, Strijkers G, Gijsen F. 3D collagen architecture in atherosclerotic plaques. 11th Int. Symp. Biomech. Vasc. Biol. Cardiovasc. Dis. 2016:21. [Google Scholar]
- 31.Qu RT, Calin M, Eckert J, Zhang ZF. Metallic glasses: notch-insensitive materials. Scr. Mater. 2012;66:733–736. http://dx.doi.org/10.1016/j.scriptamat.2012.01.044. [Google Scholar]
- 32.Qu R, Zhang P, Zhang Z. Notch effect of materials: strengthening or weakening? J Mater. Sci. Technol. 2014;30:599–608. http://dx.doi.org/10.1016/j.jmst.2014.04.014. [Google Scholar]
- 33.Cunnane EM, Mulvihill JJE, Barrett HE, Healy DA, Kavanagh EG, Walsh SR, Walsh MT. Mechanical, biological and structural characterization of human atherosclerotic femoral plaque tissue. Acta Biomater. 2015;11:295–303. doi: 10.1016/j.actbio.2014.09.024. http://dx.doi.org/10.1016/j.actbio.2013.07.012. [DOI] [PubMed] [Google Scholar]
- 34.Mulvihill JJ, Cunnane EM, McHugh SM, Kavanagh EG, Walsh SR, Walsh MT. Mechanical, biological and structural characterization of in vitro ruptured human carotid plaque tissue. Acta Biomater. 2013;9:9027–9035. doi: 10.1016/j.actbio.2013.07.012. http://dx.doi.org/10.1016/j.actbio.2013.07.012. [DOI] [PubMed] [Google Scholar]
- 35.Lawlor MG, O'Donnell MR, O'Connell BM, Walsh MT. Experimental determination of circumferential properties of fresh carotid artery plaques. J. Biomech. 2011;44:1709–1715. doi: 10.1016/j.jbiomech.2011.03.033. http://dx.doi.org/10.1016/j.jbiomech.2011.03.033. [DOI] [PubMed] [Google Scholar]
- 36.Teng Z, Feng J, Zhang Y, Sutcliffe MPF, Huang Y, Brown AJ, Jing Z, Lu Q, Gillard JH. A uni-extension study on the ultimate material strength and extreme extensibility of atherosclerotic tissue in human carotid plaques. J. Biomech. 2015;48:3859–3867. doi: 10.1016/j.jbiomech.2015.09.037. http://dx.doi.org/10.1016/j.jbiomech.2015.09.037. [DOI] [PMC free article] [PubMed] [Google Scholar]
- 37.Holzapfel GA, Sommer G, Regitnig P. Anisotropic mechanical properties of tissue components in human atherosclerotic plaques. J. Biomech. Eng. 2004;126:657–665. doi: 10.1115/1.1800557. http://dx.doi.org/10.1115/1.1800557. [DOI] [PubMed] [Google Scholar]
- 38.Purslow PP. The physical basis of meat texture: observations on the fracture behavior of cooked bovine M. Semitendinosus. Meat Sci. 1985;12:39–60. doi: 10.1016/0309-1740(85)90024-5. [DOI] [PubMed] [Google Scholar]
- 39.Fischman DL, Savage MP, Leon MB, Schatz RA, Ellis SG, Cleman MW, Teirstein P, Walker CM, Bailey S, Hirshfeld JW, Goldberg S. Effect of intracoronary stenting on intimal dissection after balloon angioplasty: results of quantitative and qualitative coronary analysis. J. Am. Coll. Cardiol. 1991;18:1445–1451. doi: 10.1016/0735-1097(91)90673-w. [DOI] [PubMed] [Google Scholar]
- 40.Schomig A, Kastrati A, Dietz R, Rauch B, Neumann F-J, Katus HH, Busch U. Emergency coronary stenting for dissection during percutaneous transluminal coronary angioplasty: angiographic follow-up after stenting and after repeat angioplasty of the stented segment. J. Am. Coll. Cardiol. 1994;23:1053–1060. doi: 10.1016/0735-1097(94)90589-4. [DOI] [PubMed] [Google Scholar]
- 41.Gonzalo N, Serruys PW, Okamura T, Shen ZJ, Garcia-Garcia HM, Onuma Y, van Geuns RJ, Ligthart J, Regar E. Relation between plaque type and dissections at the edges after stent implantation: an optical coherence tomography study. Int. J. Cardiol. 2011;150:151–155. doi: 10.1016/j.ijcard.2010.03.006. http://dx.doi.org/10.1016/j.ijcard.2010.03.006. [DOI] [PubMed] [Google Scholar]
- 42.Badel P, Avril S, Sutton MA, Lessner SM. Numerical simulation of arterial dissection during balloon angioplasty of atherosclerotic coronary arteries. J. Biomech. 2014;47:878–889. doi: 10.1016/j.jbiomech.2014.01.009. http://dx.doi.org/10.1016/j.jbiomech.2014.01.009. [DOI] [PMC free article] [PubMed] [Google Scholar]
- 43.Lanzino G, Rabinstein AA, Brown RD. Treatment of carotid artery stenosis: medical therapy, surgery, or stenting? Mayo Clin Proc. 2009;84:362–388. doi: 10.1016/S0025-6196(11)60546-6. http://dx.doi.org/10.1016/S0025-6196(11)60546-6. [DOI] [PMC free article] [PubMed] [Google Scholar]
- 44.Spence JD. Management of patients with an asymptomatic carotid stenosis—medical management, endovascular treatment, or carotid endarterectomy? Curr Neurol. Neurosci. Rep. 2016;16:1–7. doi: 10.1007/s11910-015-0605-6. http://dx.doi.org/10.1007/s11910-015-0605-6. [DOI] [PubMed] [Google Scholar]
- 45.Sun J, Hatsukami TS. Plaque imaging to decide on optimal treatment medical versus carotid endarterectomy versus carotid artery stenting. Neuroimaging Clin. N. Am. 2016;26:165–173. doi: 10.1016/j.nic.2015.09.011. http://dx.doi.org/10.1016/j.nic.2015.09.011. [DOI] [PubMed] [Google Scholar]
- 46.Fukumoto Y, Deguchi JO, Libby P, Rabkin-Aikawa E, Sakata Y, Chin MT, Hill CC, Lawler PR, Varo N, Schoen FJ, Krane SM, Aikawa M. Genetically determined resistance to collagenase action augments interstitial collagen accumulation in atherosclerotic plaques. Circulation. 2004;110:1953–1959. doi: 10.1161/01.CIR.0000143174.41810.10. http://dx.doi.org/10.1161/01.CIR.0000143174.41810.10. [DOI] [PubMed] [Google Scholar]
- 47.Deguchi JO, Aikawa E, Libby P, Vachon JR, Inada M, Krane SM, Whittaker P, Aikawa M. Matrix metalloproteinase-13/collagenase-3 deletion promotes collagen accumulation and organization in mouse atherosclerotic plaques. Circulation. 2005;112:2708–2715. doi: 10.1161/CIRCULATIONAHA.105.562041. http://dx.doi.org/10.1161/CIRCULATIONAHA.105.562041. [DOI] [PubMed] [Google Scholar]
- 48.Libby P. Collagenases and cracks in the plaque. J. Clin. Invest. 2013;123:3201–3203. doi: 10.1172/JCI67526. http://dx.doi.org/10.1172/JCI67526. [DOI] [PMC free article] [PubMed] [Google Scholar]
- 49.Choi G, Lee JM, Kim H-J, Park J-B, Sankaran S, Otake H, Doh J-H, Nam C-W, Shin E-S, Taylor CA, Koo B-K. Coronary artery axial plaque stress and its relationship with lesion geometry application of computational fluid dynamics to coronary CT angiography. JACC Cardiovasc. Imaging. 2015;8:1156–1166. doi: 10.1016/j.jcmg.2015.04.024. http://dx.doi.org/10.1016/j.jcmg.2015.04.024. [DOI] [PubMed] [Google Scholar]
- 50.Papafaklis MI. Characterizing the hyperemia-induced mechanical stress acting on the plaque. JACC Cardiovasc. Imaging. 2016 doi: 10.1016/j.jcmg.2015.11.017. http://dx.doi.org/10.1016/j.jcmg.2015.11.017. [DOI] [PubMed]


