

Summary
Dysregulation of splicing factor expression and altered alternative splicing are associated with aging in humans and other species, and also with replicative senescence in cultured cells. Here, we assess whether expression changes of key splicing regulator genes and consequent effects on alternative splicing are also associated with strain longevity in old and young mice, across 6 different mouse strains with varying lifespan (A/J, NOD.B10Sn‐H2b/J, PWD.Phj, 129S1/SvlmJ, C57BL/6J and WSB/EiJ). Splicing factor expression and changes to alternative splicing were associated with strain lifespan in spleen and to a lesser extent in muscle. These changes mainly involved hnRNP splicing inhibitor transcripts with most changes more marked in spleens of young animals from long‐lived strains. Changes in spleen isoform expression were suggestive of reduced cellular senescence and retained cellular proliferative capacity in long‐lived strains. Changes in muscle isoform expression were consistent with reduced pro‐inflammatory signalling in longer‐lived strains. Two splicing regulators, HNRNPA1 and HNRNPA2B1, were also associated with parental longevity in humans, in the InCHIANTI aging study. Splicing factors may represent a driver, mediator or early marker of lifespan in mouse, as expression differences were present in the young animals of long‐lived strains. Changes to alternative splicing patterns of key senescence genes in spleen and key remodelling genes in muscle suggest that correct regulation of alternative splicing may enhance lifespan in mice. Expression of some splicing factors in humans was also associated with parental longevity, suggesting that splicing regulation may also influence lifespan in humans.
Keywords: isoforms, lifespan, longevity, mouse, mRNA splicing, splicing factors
Introduction
Aging is a dynamic, multisystem process, which is highly heterogeneous in humans with some people surviving disease‐free until advanced age whilst others succumb to age‐related conditions in mid‐life. The factors underlying individual lifespan are currently unclear, but increasing our understanding of determinants of longevity and ‘healthspan’ are key aims for the future.
Correct expression and regulation of genes is critical for maintenance of cellular and organismal function. Alternative splicing, the process by which single genes can make multiple gene products in an adaptive and reactive fashion is a key part of this process (Cartegni et al., 2002). Indeed, breakdown in the regulation of mRNA splicing is a prominent feature in many age‐related diseases such as Alzheimer's disease, Parkinson's disease and several tumour types (Scuderi et al., 2014; Danan‐Gotthold et al., 2015; Lisowiec et al., 2015; Lu et al., 2015). This may indicate that defects in the splicing machinery may cause the cellular response to stress to be less specific, with effects on cellular resiliency and accumulation of DNA damage. We have previously identified deregulation of splicing factor expression and alternative splicing as a key factor in normal human and cellular aging (Harries et al., 2011; Holly et al., 2013). Alternatively expressed isoforms also demonstrate tissue‐specific differences in aging, as they do for many other phenomena (Holly et al., 2013). Splicing factors themselves demonstrate high species conservation (Barbosa‐Morais et al., 2006), whereas patterns of alternative splicing are partially determined by genetic differences and may be species specific. Splicing patterns show drastically more interspecies variability than gene expression with only 50% of alternatively expressed isoforms being conserved between species (Barbosa‐Morais et al., 2012). Alternatively regulated splice sites demonstrating temporal, spatial or reactive expression are less likely to show species conservation (Garg & Green, 2007).
Several splicing factors have been suggested to be involved in organismal lifespan. The pre‐mRNA processing factor 19 homologue (SNEV) protein, important for spliceosome assembly and mRNA processing, has been shown to suppress cellular senescence and suppress apoptosis when phosphorylated by the ataxia‐telangiectasia (ATM) kinase in endothelial cells (Dellago et al., 2012). The DNA damage protein ATM also appears to be an important regulator of splicing factor expression in our previous work, since targeted gene knockdown of the ATM gene resulted in increased levels of splicing factor expression in fibroblasts (Holly et al., 2013). There is also evidence from systemic models. A network‐based model of genes altered by calorific restriction across 17 tissues in mice revealed that the largest and most responsive gene regulatory module was associated with mRNA processing, with a disproportionally large number of genes being involved in splicing, metabolism, processing and biosynthesis of mRNA (Swindell, 2009). Finally, a study of the relationship between copy number variation (CNV) and longevity in humans revealed that lifespan‐associated CNVs were preferentially located in or near genes encoding proteins involved in splicing control. This led them to conclude that genetic variation that disrupts the processes of alternative splicing may have long‐term effects on lifespan (Glessner et al., 2013).
The study of inbred strains of mice has proven fruitful in uncovering factors associated with lifespan, as for other phenotypes. The Jackson Laboratory has characterized 30 strains of mice, for aging and longevity‐related traits (Yuan et al., 2009, 2011). Initial work with this resource identified that plasma IGF1 levels were related to lifespan in rodents (Yuan et al., 2009). This collection, together with the associated repository of mouse phenome data, represents a rich resource (Bogue et al., 2014). Here, we have harnessed this resource to assess the contribution of regulation of alternative splicing to longevity in mice.
We have systematically assessed the expression of splicing factors previously demonstrated to be altered in human aging in relation to lifespan in six mouse strains of different longevities. Our study design is illustrated in Fig. 1. Splicing factor expression and alternative splicing of key genes are associated with lifespan in mouse spleen tissue and to a lesser extent in mouse muscle, suggesting that aging effects may be driven by immune tissues. Some strain differences in expression are most marked in the young mice, suggesting that they may represent determinants or early markers of longevity rather than representing secondary effects of aging. We also identified differences in expression levels of alternatively expressed isoforms of key aging genes indicative of reduced cellular senescence, maintained cellular proliferative capacity (spleen) and reduced pro‐inflammatory signalling (muscle) in long‐lived mouse strains. Two splicing factors, HNRNPA2B1 and HNRNPA1, were also associated with parental longevity in a large population study of aging, suggesting that regulation of splicing may also be involved in lifespan in human populations.
Figure 1.
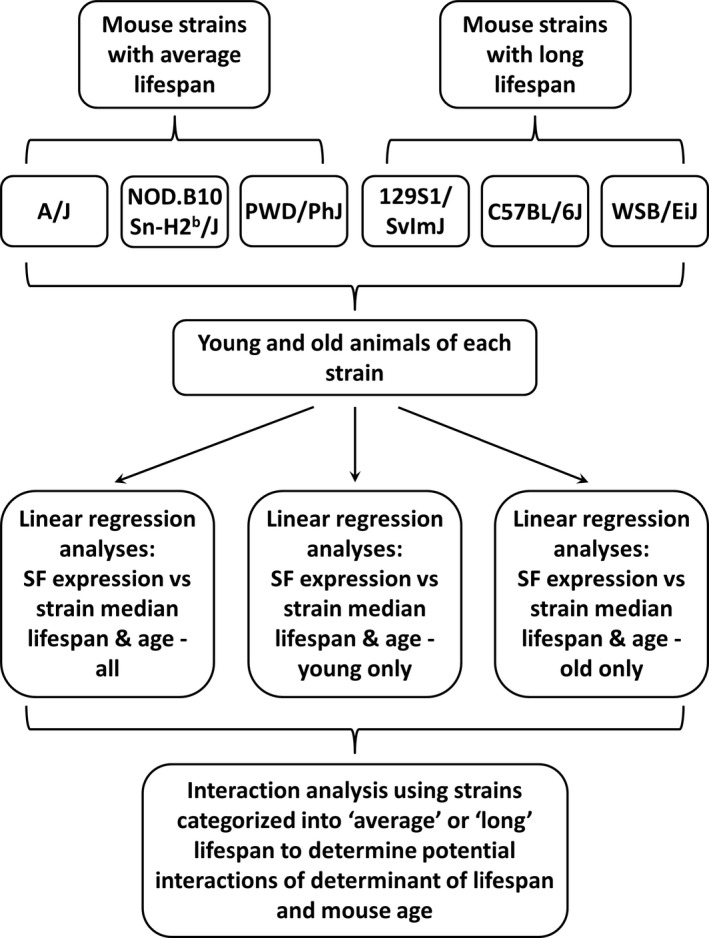
Schematic of study design. This figure shows the experimental strategy employed to assess the effects of strain longevity and mouse age on the expression of an a priori panel of splicing factors (SFs).
Results
Splicing factor transcript expression is associated with lifespan in mouse spleen and to a lesser extent in muscle tissues
We assessed splicing factors that we have previously demonstrated to be altered in human aging in relation to lifespan in 6 mouse strains of different longevities and in samples from both old and young mice as in Fig. 1. The expression of 8/15 and 3/15 splicing factors was associated with strain lifespan in mouse spleen and muscle tissue, respectively.
In spleen, we found associations between strain lifespan and the expression of the Hnrnpa1, Hnrnpa2b1, Hnrnpk, Hnrnpm, Hnrnpul2, Sf3b1, Srsf3 and Tra2β genes (beta coefficients −0.40, −0.26, −0.32, −0.31, −0.22, −0.13 and −0.36; P = 0.01, 0.02, 0.003, 0.003, 0.04, 0.05, 0.02 and 0.02, respectively; Fig. 2A, Table S1). When an analysis was carried out to assess interactions between strain lifespan and mouse age, we found effects in both young and old mice of long‐lived strains for all associated genes except Hnrnpul2. In the case of Hnrnpa1 and Hnrnpa2b1 genes, these differences were more marked in the young mice of long‐lived strains (beta coefficients −0.14 and −0.19, P = 0.001 and < 0.0001 in the young long‐lived mice compared with −0.09 and −0.12; P = 0.01 and 0.02 for the old long‐lived mice for Hnrnpa1 and Hnrnpa2b1, respectively; Table S9). For Srsf3, the associations between splicing factor expression/age and splicing factor expression/strain median lifespan appear to be comparable, whereas for Tra2β, our data suggest that the effects of age are stronger than those of lifespan (Table S9). The majority (5/8) of the splicing factors demonstrating association of expression differences with lifespan belonged to the hnRNP class of splicing inhibitors, with only 2 splicing activators (Srsf3 and Tra2β) showing expression changes with lifespan. The remaining associated splicing factor, Sf3b1, encodes a component of the U2 snRNP in the core spliceosome complex, rather than a splicing regulator. When data were assessed by binary logistic regression to allow for nonlinearity of response, all but one (Hnrnpul2) of the splicing regulators associated with lifespan in spleen remained associated with median strain lifespan (Table S10).
Figure 2.
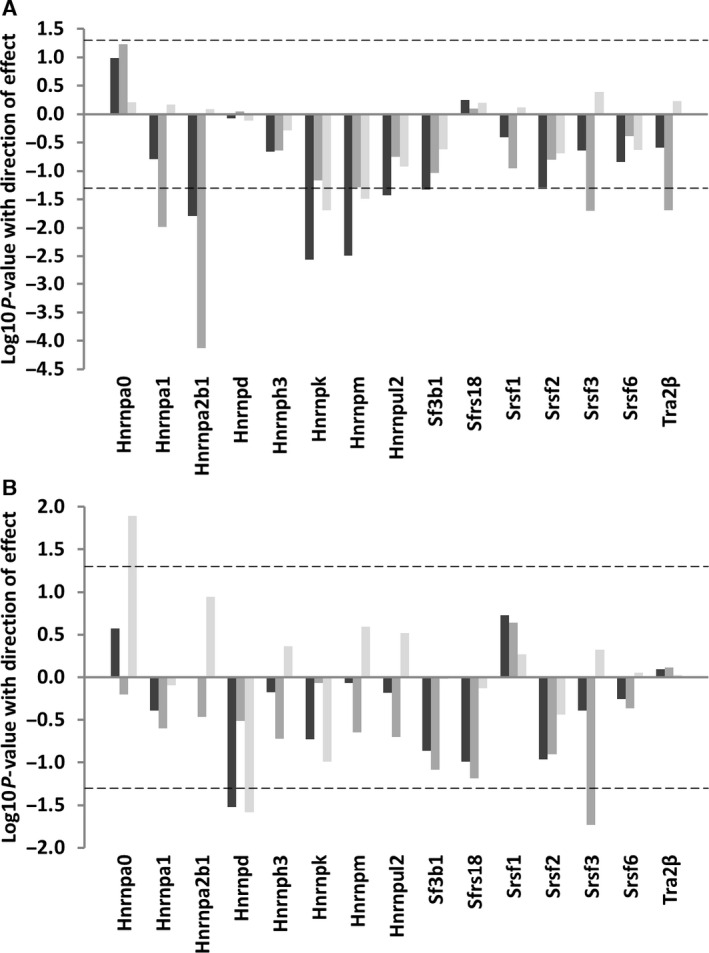
Splicing factor expression according to mouse lifespan. This plot illustrates association between median lifespan and slicing factor expression in total RNA from spleen (A) or muscle (B) tissues in mice of 6 strains of different longevities, as assessed by linear regression against median strain lifespan. The identity of specific splicing factors is given on the x‐axis. The log10 P‐values for associations between lifespan and splicing factor expression from mice of strains with different lifespans and of different ages are given on the y‐axis. Direction of effect is also indicated; data appearing above the zero line on the y‐axis represent positive associations, whilst data appearing below the zero line represent negative associations. Analysis including all animals in the sample is given by dark grey bars, in young animals only by medium grey bars and in old animals only by light grey bars. The dotted line refers to a P‐value cut‐off for statistical significance of P = 0.05.
Fewer splicing factors were associated with strain lifespan in muscle tissue (Fig. 2B, Table S2). Hnrnpa0 expression was found to be positively correlated with long life (beta coefficient 0.36; P = 0.01), whereas Hnrnpd and Srsf3 transcripts both demonstrated reduced expression (beta coefficients −0.24 and −0.40; P = 0.03 and 0.02, respectively). Interaction analysis revealed that the Srsf3 effect was again driven by effects in the young animals of the long‐lived strains (beta coefficient −0.14, P = 0.01 in the young long‐lived mice compared with beta coefficient −0.05, P = 0.28 in the old long‐lived mice; Table S9). Again 2/3 lifespan‐associated splicing factors represented hnRNP splicing inhibitors rather than SRSF splicing activators. When data were assessed by binary logistic regression to allow for nonlinearity of response, all of the splicing regulators associated with lifespan in muscle remained associated with median strain lifespan (Table S11). Effects were tissue specific, with little overlap between lifespan‐associated splicing factors in spleen and those in muscle, with only Srsf3 common to both data sets.
Alternatively spliced genes demonstrate longevity‐associated isoform changes in mouse spleen and muscle tissue
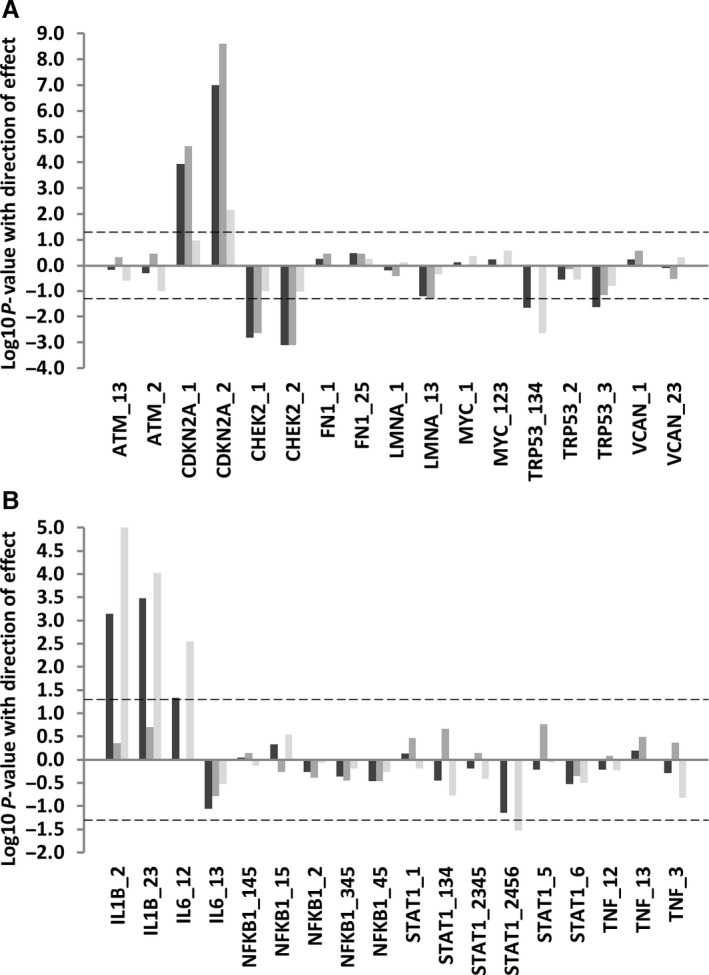
In spleen, we found splicing differences in association with lifespan for 4/8 genes tested (Fig. 3A; Table S3). Both uc008toi.1 and uc008toh.1 transcripts encoding p16INK4A and p14ARF isoforms of the Cdkn2a gene were expressed at lower levels in the long‐lived strains (beta coefficients −0.43 and −0.59; P = 0.002 and < 0.0001 for uc008toi.1 [p16INK4A] and uc008toh.1 [p14ARF], respectively). Analysis of the interaction of strain longevity and mouse age revealed that although the effects on Cdkn2a isoform expression increased with age as expected in both average‐lived and long‐lived mice, the increase in expression was much less marked in the old long‐lived mice than in old mice of average lifespan (beta coefficients 0.44 and 0.50, P = <0.0001 and < 0.0001 for the old average‐lived mice compared with beta coefficients 0.22 and 0.27, P = 0.01 and 0.001 for the old long‐lived mice; Table S9).
Figure 3.
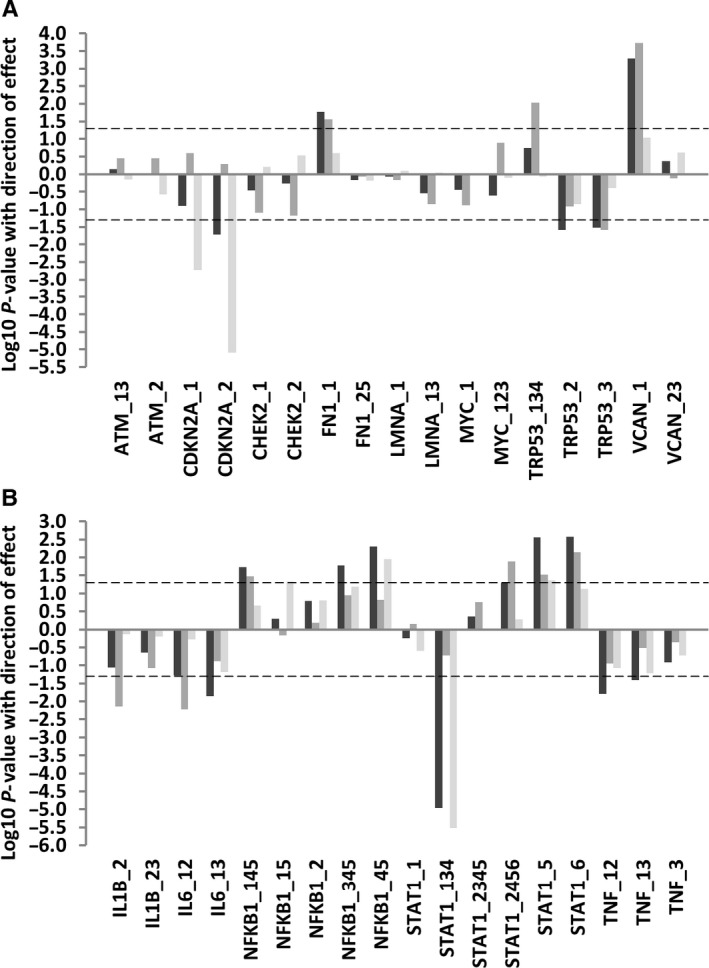
The expression of alternative isoforms of key genes according to mouse lifespan. This plot illustrates association between median lifespan and the expression of alternatively expressed isoforms of key genes in total RNA from spleen (A) or muscle (B) tissues in mice of 6 strains of different longevities as assessed by linear regression against median strain lifespan. The identity of specific splicing factors is given on the x‐axis. The log10 P‐values for associations between lifespan and splicing factor expression from mice of strains with different lifespans and of different ages are given on the y‐axis. Direction of effect is also indicated; data appearing above the zero line on the y‐axis represent positive associations, whilst data appearing below the zero line represent negative associations. Analysis including all animals in the sample is given by dark grey bars, in young animals only by medium grey bars and in old animals only by light grey bars. The dotted line refers to a P‐value cut‐off for statistical significance of P = 0.05.
We also found expression of the uc007bju.2 isoform only of the Fn1 gene to be increased in the long‐lived strains (beta coefficient 0.25, P = 0.02). There is increased expression of the long isoform of the Trp53 gene encoding full‐length p53 (uc007jql.2/uc007jqn.2), but reduced expression of the truncated p53AS isoforms (uc011xww.1/uc007jqm.2; beta coefficients 0.41 and −0.35, P = 0.009 and 0.03 for full‐length Trp53 and truncated p53AS isoforms, respectively). Assessment of the interaction between strain longevity and mouse age revealed that expression of the full‐length p53 isoform is only significantly increased in the young animals of long‐lived strains (in comparison with young animals of short‐lived strains P = 0.004; the older animals were not significantly different to young short‐lived strains P > 0.05) and that diminished expression of p53AS was only significantly decreased in the old animals of long‐lived strains (P = 0.009, in comparison with young animals of short‐lived strains; other groups were P > 0.05, Table S9). Finally, expression of the full‐length uc007rjg.1 isoform of the Vcan gene is upregulated (beta coefficient 0.34, P = 0.001).
In mouse muscle, expression of isoforms of all five genes tested in relation to lifespan was altered (Fig. 3B, Table S4). First, expression of the full‐length uc008mht.1 isoform of the Il1b gene was reduced in the long‐lived strains (beta coefficient −0.46, P = 0.007), whilst the intron‐retained uc008mhu.1 Il1b isoform was unaffected. Interaction analysis revealed that this difference was limited to the young mice of the long‐lived strains (P = 0.004 for young long‐lived mice compared with P = 0.34 for the old long‐lived mice). Expression levels of the intron‐retained uc008wuv.1 and full‐length uc008wuw.1 isoforms of the Il6 gene were also reduced (beta coefficient −0.48, P = 0.006 and −0.28, P = 0.01, respectively). Interaction analyses revealed that the effects on the intron‐retained isoform were significant in the young long‐lived mice only (P = 0.04 for young long‐lived mice compared with P = 0.72 for old long‐lived mice; Table S9).
Expression of the uc012cyg.1/uc008rlx.1 isoforms which encode the long full‐length forms of the Nfkb1 gene was greater in long‐lived strains (beta coefficient 0.31, P = 0.005). No difference was seen in the expression of the noncoding truncated uc012cyf.1 Nfkb1 isoform. Isoform usage for the Stat1 gene in long‐lived strains differed; the uc007axz.1 and uc007aya.2 isoforms of Stat1 that both encode ‘variant 2’ of the STAT1 protein demonstrated diminished expression in the long‐lived strains (beta coefficients −0.63, P = <0.0001), whereas the Stat1 uc007ayc.2 isoform encoding ‘variant 1’ demonstrated increased expression in the long‐lived strains (beta coefficient 0.46, P = 0.007). Interaction analysis revealed that the decrease in Stat1 variant 2 expression was present only in the old long‐lived mice (P = 0.01 in old long‐lived mice compared with P = 0.28 in the young long‐lived mice; Table S9). The greater Stat1 variant 1 expression was driven by effects in the young long‐lived mice (P = 0.03 in young long‐lived mice compared with P = 0.95 in old long‐lived mice). Transcript uc007ayb.2, encoding Stat1 ‘variant 3’, was also upregulated (beta coefficient 0.33, P = 0.005) although this was seen in both young and old animals of long‐lived strains. Finally, expression of both the uc012arb.2 and uc008cgs.2 isoforms of the Tnf gene which encode TNF variants 1 and 2 were reduced in muscle (beta coefficients −0.27 and −0.18, P = 0.02 and 0.04 for uc012arb.2 and uc008cgs.2, respectively). Interaction analyses revealed that the effect for Tnf variant 1 is most marked in the old long‐lived animals (P = 0.008 in the old long‐lived animals compared with P = 0.05 in the young long‐lived animals, Table S9).
Few splicing factors are associated with age in mouse spleen and muscle tissues
Associations between mouse age and splicing factor expression were less marked than those seen for strain longevity (Fig. 4A,B, Tables S5 and S6). In spleen, we found reduced expression of the Hnrnpa2b1, Srsf1, Srsf3 and Tra2β transcripts in old mice (beta coefficients −0.46, −0.34, −0.45 and −0.53; P = 0.005, 0.05, 0.007 and 0.008, respectively). Effects on Srsf1, Srsf3 and Tra2β expression were evident in old animals of both average‐lived and long‐lived strains, but interaction analysis revealed that the age‐associated difference in Hnrnpa2b1 expression was most marked in the old animals of strains of average lifespan (beta coefficients −0.11, P = 0.02 in the old long‐lived animals compared to beta coefficient −0.13 P = <0.0001 in the old average‐lived animals). Age‐associated changes to splicing factor expression were much less evident in muscle tissue, with only Hnrnpa1 demonstrating increased expression (beta coefficient 0.22, P = 0.05). Analysis of cluster patterns for age revealed considerable inter‐ and intrastrain heterogeneity in splicing factor expression (Fig. S1).
Figure 4.
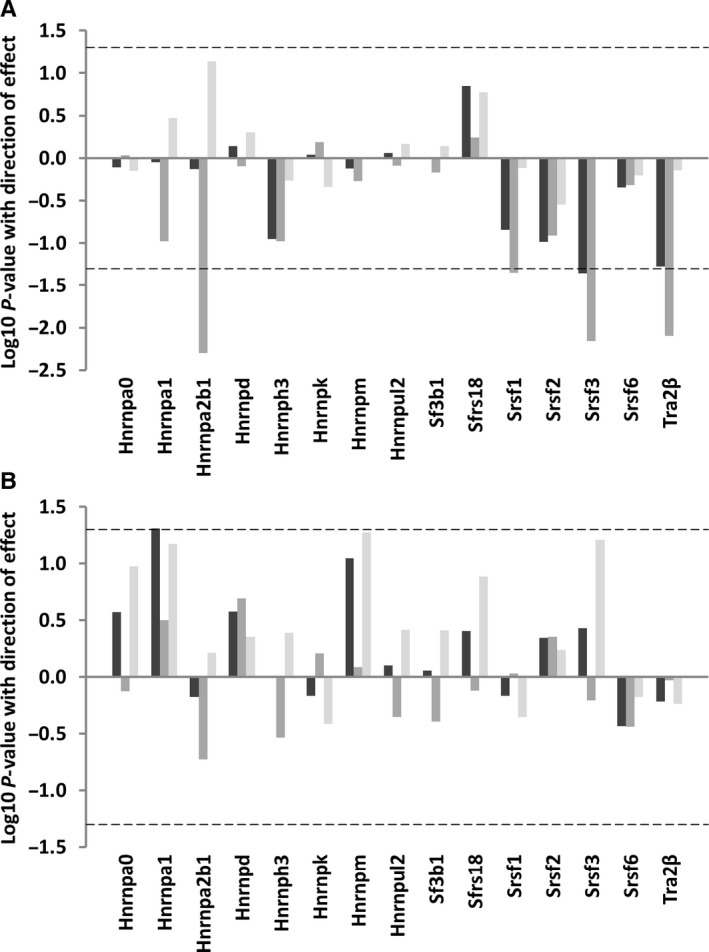
Splicing factor expression according to mouse age. This plot illustrates association between age and splicing factor expression in total RNA from spleen (A) or muscle (B) tissues in young (6 months) vs. old (20–22 months) mice. The identity of specific splicing factors is given on the x‐axis. The log10 P‐values for associations between age and splicing factor expression from mice of different ages and of different strains are given on the y‐axis. Direction of effect is also indicated; data appearing above the zero line on the y‐axis represent positive associations, whilst data appearing below the zero line represent negative associations. Analysis including all animals in the sample is given by dark grey bars, in animals of average‐lived strains only by medium grey bars and in long‐lived animals only by light grey bars. The dotted line refers to a P‐value cut‐off for statistical significance of P = 0.05.
Alternatively expressed isoforms demonstrate differential expression with age in mouse spleen and muscle tissue
Despite the small numbers of splicing factors demonstrating age‐associated differences in splicing factor expression, we noted differences in alternative splicing in both spleen and muscle from aged mice (Fig. 5A,B, Tables S7 and S8).
Figure 5.
The expression of alternative isoforms of key genes according to mouse age. This plot illustrates association between the expression of age and the expression of alternatively expressed isoforms of key genes in total RNA from spleen (A) or muscle (B) tissues in young (6 months) vs. old (20–22 months) mice. The identity of isoforms is given on the x‐axis. The log10 P‐values for associations between age and the expression of alternative isoforms from mice of different ages and of different strains are given on the y‐axis. Direction of effect is also indicated; data appearing above the zero line on the y‐axis represent positive associations, whilst data appearing below the zero line represent negative associations. Analysis including all animals in the sample is given by dark grey bars, in animals of average‐lived strains only by medium grey bars and in long‐lived animals only by light grey bars. The dotted line refers to a P‐value cut‐off for statistical significance of P = 0.05.
In mouse spleen, we identified increased expression of both uc008toi.1 and uc008toh.1 transcripts encoding p16INK4A and p14ARF isoforms of the Cdkn2a gene in the old animals as expected (beta coefficients 0.40 and 0.53, P = <0.0001 and 0 < 0.0001, respectively). Interaction analyses revealed the age‐associated increase in both Cdkn2a isoforms to be significantly reduced in old animals of long‐lived strains as described above. We also identified decreased expression of both uc008yrw.1 (full length) and uc008yrx.1 (exon skipped) isoforms of the Chek2 gene with increasing age (beta coefficients −0.33 and −0.35, P = 0.02 and 0.01, respectively). Interaction analyses between mouse age and strain longevity revealed that reduced expression of the full‐length Chek2 isoform was more marked in the old animals of the long‐lived strains (beta coefficient −0.26, P = <0.0001 in the old long‐lived animals compared with beta coefficient −0.24, P = 0.003 in the old average‐lived animals; Table S9). Trp53 isoforms also demonstrated effects with age in mouse spleen. With age, there was a reduction in levels of transcripts encoding both full‐length p53 (uc007jql.2/ uc007jqn.2) and also those encoding the truncated alternatively spliced p53AS (uc007jqm.2) isoform (beta coefficients −0.24 and −0.24, P = 0.02 and 0.03, respectively).
In mouse muscle, we found increased expression of both the full‐length (uc008mht.1) and the intron‐inclusion (uc008mhu.1) Il1b transcripts with age (beta coefficients 0.37 and 0.39, P = 0.001 and < 0.0001). The old animals also demonstrated elevated expression of the uc008wuv.1 isoform of the Il6 gene, which contains a retention of intron 4 relative to the consensus transcript (beta coefficient 0.44, P = 0.003). Old animals also demonstrated reduction of uc007ayd.2, uc007aya.2, uc007ayb.2 and uc007ayc.2 isoforms of the Stat1 gene, with the effects on uc007aya.2 being revealed by interaction analysis between mouse age and strain lifespan to be present exclusively in the old animals of long‐lived strains (beta coefficient −0.17, P = 0.01; Table S9).
The expression of some splicing factors is associated with parental longevity in a large human population
We examined the expression of 15 splicing factors identified through the mouse work described in this study and previous analyses (Holly et al., 2013) and determined that 2 genes, HNRNPA2B1 and HNRNPA1, demonstrated associations of their expression with parental longevity, as defined in Dutta et al. (2013a) in the human InCHIANTI population study as well as in mice (Table 1). HNRNPA2B1 transcripts demonstrated increased expression in the offspring of long‐lived parents (beta coefficients 0.12, P = 0.017), whereas HNRNPA1 demonstrated reduced expression in the offspring of long‐lived parents (beta coefficient −0.09; P = 0.035, respectively; Table 1). Hnrnpa1 demonstrates reduced expression in association with longevity in both man and mouse, whereas Hnrnpa2b1 shows elevated expression with longevity in people, but reduced expression with longevity in mice.
Table 1.
Associations between splicing factor expression and parental longevity in humans (the InCHIANTI population)
| Gene name | Probe Id | Beta coefficient | 95% Confidence intervals | P‐value | |
|---|---|---|---|---|---|
| HNRNPA2B1 | ILMN_1886493 | 0.116 | 0.020 | 0.212 | 0.017 |
| HNRNPA1 | ILMN_1676091 | −0.091 | −0.176 | −0.006 | 0.035 |
| HNRNPA2B1 | ILMN_2369682 | 0.088 | 0.002 | 0.175 | 0.044 |
| TRA2B | ILMN_1742798 | 0.092 | −0.001 | 0.186 | 0.051 |
| HNRNPA1 | ILMN_1661346 | 0.069 | −0.004 | 0.143 | 0.065 |
| SRSF1 | ILMN_1795341 | 0.082 | −0.008 | 0.171 | 0.073 |
| HNRNPD | ILMN_2321451 | 0.088 | −0.010 | 0.186 | 0.078 |
| HNRNPK | ILMN_1701753 | −0.066 | −0.176 | 0.043 | 0.232 |
| HNRNPUL2 | ILMN_2072091 | 0.076 | −0.053 | 0.205 | 0.246 |
| HNRNPK | ILMN_2378048 | 0.060 | −0.058 | 0.178 | 0.319 |
| SRSF18 | ILMN_2161357 | 0.068 | −0.072 | 0.209 | 0.341 |
| HNRNPUL2 | ILMN_1810327 | 0.055 | −0.066 | 0.176 | 0.374 |
| HNRNPA1 | ILMN_2220283 | 0.034 | −0.051 | 0.119 | 0.432 |
| SRSF2 | ILMN_1696407 | 0.047 | −0.074 | 0.167 | 0.446 |
| HNRNPD | ILMN_1751368 | −0.034 | −0.137 | 0.068 | 0.511 |
| SRSF6 | ILMN_1697469 | 0.033 | −0.077 | 0.143 | 0.552 |
| SRSF6 | ILMN_1754304 | 0.030 | −0.078 | 0.138 | 0.585 |
| HNRNPA0 | ILMN_1753279 | −0.035 | −0.164 | 0.095 | 0.598 |
| HNRNPA1 | ILMN_1663447 | −0.034 | −0.168 | 0.101 | 0.624 |
| HNRNPA1 | ILMN_1720745 | 0.025 | −0.080 | 0.131 | 0.637 |
| HNRNPM | ILMN_2385173 | −0.029 | −0.161 | 0.103 | 0.668 |
| SRSF6 | ILMN_1805371 | −0.026 | −0.149 | 0.096 | 0.673 |
| SF3B1 | ILMN_1712347 | −0.022 | −0.151 | 0.107 | 0.738 |
| SF3B1 | ILMN_1705151 | 0.017 | −0.091 | 0.125 | 0.754 |
| HNRNPM | ILMN_1745385 | −0.016 | −0.119 | 0.086 | 0.756 |
| HNRNPA1 | ILMN_2175075 | −0.012 | −0.126 | 0.102 | 0.838 |
| SRSF3 | ILMN_2389582 | 0.004 | −0.118 | 0.125 | 0.951 |
The relationship of parental longevity with expression of 15 unique splicing factors in 405 individuals by multivariate linear regression. Genes demonstrating significant associations at P = <0.05 are indicated in bold underlined text.
Genetic variation within Hnrnpa2b1 and Hnrnpa1 that is discrepant between strains is unlikely to contribute to differences in gene expression
We have carried out a bioinformatic analysis of the potential for genetic variation that is discrepant between strains of mice to affect the regulation of the Hnrnpa2b1 and Hnrnpa1 genes. These genes were selected because their expression is associated with longevity in both mouse and man. The Hnrnpa2b1 gene harbours 14 genetic variants that are discordant between strains. Two of these variants, rs51031918 and rs252413833, are associated with changes to the binding efficiencies of SRSF2 and SRSF5 splicing enhancers (see Table S12). These changes are, however, very subtle and may not adversely affect SRSF2 or SRSF5 binding. Similarly, two Hnrnpa1 variants (rs32398879 and rs50030666) are discordant between the strains. One of these, rs50030666, lies in a cassette exon which is intronic in some Hnrnpa1 isoforms, but coding in others (see Table S12). The coding change causes the substitution of glycine residue for a similarly sized serine residue with equivalent charge. No other predicted effects of genetic variation on transcription factor binding, RNA regulatory elements (A‐rich elements, C to U RNA editing sites or microRNA binding sites) were identified for any variant studied.
Discussion
Splicing factor expression has been shown to be conclusively associated with chronological age in humans (Harries et al., 2011) and also with cellular senescence in multiple human primary cell lines in culture (Holly et al., 2013), indicating that these factors may be linked with cellular plasticity and adaptability during the aging process. Here, we have assessed the potential relationships between splicing factor expression and alternative splicing with strain longevity across 6 mouse strains of variable medium to long lifespans, in both young and old animals. We also assessed associations between splicing factor expression and parental longevity in the offspring of long‐lived parents in humans. We have found that over half of the splicing factors tested are associated with longevity in mouse spleen, and to a lesser extent in mouse muscle and that these changes are accompanied by alterations to the profile of selected alternatively expressed isoforms in both tissues. Two splicing factors, HNRNPA1 and HNRNPA2B1, also showed evidence of an association with parental longevity in humans. These results, to our knowledge, represent the first link between the regulation of alternative splicing and inherited longevity traits in mammals.
In spleen, 7/8 splicing factors tested demonstrated associations with strain longevity in both young and old animals, with effects being predominant in the young animals of longer‐lived strains suggesting that these differences in splicing factor expression are not the end result of aging processes as such, but rather may represent fundamental differences in factor expression that drive or contribute to the aging process. It is possible that changes happening early on in life may set the scene for future longevity, which is an interesting concept given that several genes such as Foxo1, known to be associated with extended lifespan, are developmental genes (Lunetta et al., 2007). It is very difficult to predict what the consequence of these changes will be to the overall level or pattern of splicing in long‐lived mice or humans, since splice site choice at any given exon: intron junction is determined by the balance of activators and repressors, and that this balance is individually determined for each splice site in each gene (Cartegni et al., 2002). However, diminished splicing factor expression may be beneficial in younger animals, since both SRSF and hnRNP splicing factors are known to have oncogenic features (Gautrey et al., 2015; Goncalves & Jordan, 2015; Guo et al., 2015). Lower splicing factor expression in younger animals may thus protect against an earlier death from malignancy.
We also found clear evidence to suggest tissue specificity of effect which is very common in studies of splicing with 8/15 (53%) splicing factors showing associations with strain longevity in spleen, but only 3/15 (20%) in muscle. It would be interesting to determine whether the splicing events targeted by these sets of splicing factors also show associations between median strain lifespan and splice site usage, but such analysis would be very difficult due to degeneracy of splicing factor binding sites, potential for compensation by other splicing factors and the fact that splice site usage is dependent on the balance of enhancers and silencers rather than on the binding of a specific splicing factor per se. The pattern of longevity‐associated splicing regulator transcripts showed little overlap between the spleen and muscle data sets, with only changes to Srsf3 expression being common to both tissues. This is in line with our previous findings, as we have previously shown that although fibroblasts and endothelial cells that have undergone in vitro senescence both show deregulation of splicing factors, the patterns of precisely which regulators are altered show quite marked differences between cell types (Holly et al., 2013). Spleen is a lymphoid organ, consisting of large numbers of white blood cells. Most of the transcripts extracted from spleen will arise from B cells, T cells and mononuclear phagocytes. Our findings may thus reflect the hypothesis that aging of the immune system is one of the drivers of development of aging phenotypes (Franceschi & Campisi, 2014). It should also be considered that the preponderance of splicing factor expression changes in spleen compared with muscle could also reflect an accelerated rate of aging and more extensive tissue modification in spleen compared to muscle. White blood cells are also highly heterogeneous, reactive and proliferative but relatively unspecialized compared to the highly differentiated nonproliferative muscle cells. It may be that muscle requires less adaptive response than spleen cells, since it has a defined and tightly regulated function with less need to respond to environmental challenge.
Previous work from our group has identified that offspring of long‐lived parents may have better health (Dutta et al., 2013a,b). In the current study, two of the associations between splicing factor expression and longevity were also seen in RNA samples derived from the peripheral blood of participants in the InCHIANTI study (Ferrucci et al., 2000), where we found relationships between expression of the HNRNPA2B1 and HNRNPA1 transcripts and parental longevity. HNRNPA2B1 demonstrated increased expression in blood RNA from people with at least one long‐lived parent, whereas parental longevity (as a continuous trait reflecting the combined age at death of both parents) was associated with lower HNRNPA1 expression (Table 1). Hnrnpa1 is also downregulated with greater lifespan in mouse splenocytes, but the HNRNPA2B1 effect in humans is reversed compared to what we observe in the mice. This may be because the association between Hnrnpa2b1 expression and longevity is most marked in the young animals of the long‐lived strains, and our human subjects are mostly elderly, with a mean age of approximately 75 years (Harries et al., 2011). Interestingly, both Hnrnpa2b1 and Hnrnpa1 are known to be determinants of lifespan in Drosophila species, by virtue of their regulation of the TDB‐43 protein (Romano et al., 2014). TDB‐43 is crucial in fruit flies for correct splicing and regulation of mRNA stability and is associated with amyotrophic lobar sclerosis and frontotemporal lobar degeneration in humans (Neumann et al., 2007; Kim et al., 2013). Mutations have also been described in age‐related diseases such as Alzheimer's, Parkinson's and Huntington's diseases (Baloh, 2011). Recent studies have shown that the action of TDB‐43 relies on its ability to tether hnRNPA2B1 and hnRNPA1 proteins, and disruption or abolition of this association dramatically reduces lifespan in Drosophila (Romano et al., 2014).
The consequences of altered splicing in spleen give a broad picture of altered expression and processing of genes involved in reduced cell senescence, superior DNA repair and retained cellular proliferative capacity in the long‐lived strains. Old animals of long‐lived strains of mice expressed reduced amounts of Cdkn2a isoforms compared with old animals of average‐lived strains. Cdkn2a is an important marker of cellular senescence (Tominaga, 2015) and ablation of Cdkn2a expression reverses aging phenotypes in klotho mice (Sato et al., 2015), indicating that old animals of long‐lived strains may have lower levels of senescent cells. Young animals of longer‐lived strains also expressed profiles of Trp53 isoforms consistent with enhanced transcription and cell growth properties compared to young animals of average‐lived strains, since they express higher levels of full‐length p53 and lower levels of truncated p53AS which is thought to have antagonistic function (Wu et al., 1997; Almog et al., 2000; Huang et al., 2002). Altered splicing of inflammatory genes involved in muscle remodelling produces a picture consistent with lower levels of pro‐inflammatory signalling by virtue of lower levels of Il1b and Il6 expression in young animals and reduced Tnf signalling in the older animals of long‐lived strains.
We saw fewer associations of splicing factor expression with chronological age than we expected based on our previous human data. Our previous work suggests that splicing factor expression is strongly associated with age in humans and with cellular senescence in human cell models (Harries et al., 2011; Holly et al., 2013). In our human work, the per‐year age‐related changes in splicing factor expression were also relatively small (beta coefficients ranging from −0.01 to 0.005) (Holly et al., 2013), which may explain why strong effects were not seen in the current mouse study where our sample numbers were much smaller. There is also considerable interstrain heterogeneity for most splicing factors; the young animals of one strain may express lower basal levels of splicing factors than the older animals of another and effects of aging may thus be difficult to detect in small numbers of samples (Fig. S1). These data suggest that the associations of splicing factor expression with longevity across strains may actually be considerably larger than effects of age alone on splicing factor expression within strains. Again, most changes seen in this study were seen in spleen, which is consistent with a key role in senescence for immune‐mediated drivers of aging and aging phenotypes.
The limitations of our study include the relatively small sample sizes, restriction of our analyses to a small number of tissues, and the fact that we have assessed splicing patterns only at the mRNA level. Gene expression is a highly variable parameter in biological systems, so future experiments are likely to need larger sample sizes and assessment of potential effects in other tissue types, as well as assessment of effects on protein levels. Although the genes tested were selected a priori and therefore do not require adjustment for multiple testing, one must recognize that this does not entirely remove the possibility of false positives. It must also be considered that differences in splicing factor and isoform expression may arise not only from changes in the amount of transcription, but also from differences in the relative stabilities of different isoforms. These changes may form part of the mechanistic basis for our associations, as we would not expect stability changes unrelated to longevity to associate statistically with strain median lifespan. Finally, in the human follow up work described here, we were also restricted by the availability of expression data for all interesting splicing factors on the array and the likelihood that any effects were likely to be moderate on a per‐year basis as they were in our previous human age data. This is likely to have reduced our power in the human study, and thus further work in larger populations is now required to definitively explore this possibility in human subjects.
Another potential caveat is that the splicing factor expression differences we have discovered in this study reflect other strain differences that are unrelated to longevity. Whilst this is a possibility, the links between splicing factor expression and aging in humans and other animals are well documented from our previous work (Harries et al., 2011; Holly et al., 2013) and that of other groups (Meshorer & Soreq, 2002). Our observation that the lifespan‐associated expression changes relating to Hnnrpa2b1 and Hnrnpa1 we observe in mice are also translatable to humans is also supportive of our conclusions. More broadly, the importance of splicing factors in determination of lifespan is also suggested by studies of the effects of calorific restriction in mice (Swindell, 2009) and studies of the relationship between copy number variant (CNV) polymorphisms and longevity in humans (Glessner et al., 2013).
Some of the genetic differences between strains may actually contribute mechanistically to the differences in strain median lifespan. To that effect, we carried out a bioinformatic analysis on the potential for genetic variation discordant between strains to lead to gene regulation differences for Hnrnpa2b1 and Hnrnpa1, where we also found effects in man. We discovered some minor changes to the bioinformatically predicted strength of SRSF2 and SRSF5 binding within Hnrnpa2b1 and a potential amino acid change for an alternatively expressed isoform of Hnrnpa1. Although these predictions are interesting, the predicted effects of the changes on Hnrnpa2b1 or Hnrnpa1 expression or activity are likely to be slight. The splicing effects cause only a slight alteration to predicted binding efficiency of SRSF2 or SRSF5, and the coding change involves the substitution of a serine for a glycine in an alternatively spliced cassette exon of Hnrnpa1, which may not comprise the major isoform at this locus. These amino acids are in any case of similar size and charge and may not cause much change to protein functionality. It is likely the effects on median strain longevity arise from multiple changes in many genes.
To be able to assign definitive causality for a role for splicing factors as determinants of longevity, it would be necessary to carry out detailed functional experiments in vivo and in vitro, which could form the basis for future studies. Such studies could comprise constitutive or conditional knockout or overexpression studies in animal models followed by assessment of effects on lifespan, or in vitro manipulation of splicing factor levels followed by investigation of effects on cellular senescence. Such an approach has previously been employed for the Hnrnpa1 and Hnrnpa2b1 genes where upregulation of the Hnrnpa1 gene or the Hnrnpa2 isoform of the Hnrnpa2b1 gene in mouse hepatocarcinoma cells was shown to cause activation of the RAS‐MAPK‐ERK pathway (Shilo et al., 2014). This is potentially important since a recent study has shown that activation of the RAS‐ERK‐ETS pathway is a key determinant of lifespan in Drosophila species (Slack et al., 2015).
Both in vivo and in vitro studies to moderate the levels or activity of splicing factors in relation to longevity would not be without caveat. Splice site choice is a complex phenomenon and relies upon the balance of splicing activators or silencers, rather than the activity of a single splicing factor per se (Cartegni et al., 2002). This finding, together with observations that exon and intron splicing enhancers and silencers often cluster near splice sites, raises the possibility of compensation between splicing regulatory factors. Selective modulation of a single splicing factor may not then show direct effects on longevity, effects would most probably only be noted after knockdown or overexpression of multiple splicing factors which would have technical challenges both in vitro and in vivo.
This study reports the first evidence of a link between expression of splicing regulator genes and strain lifespan in mice, together with data in support of potential roles for HNRNPA1 and HNRNPA2B1 in parental longevity in humans. We hypothesize that an influence of splicing factor expression on longevity may be mediated by slower immune aging and a protection from malignancy in the young mice of long‐lived strains by virtue of restricting expression of SR and hnRNP proteins which have oncogenic potential in young animals. Both of the splicing factor transcripts demonstrating reduced expression in the old long‐lived mice belonged to the hnRNP class of splicing regulators, indicating that these mice may have less inhibition of splice site usage and be better able to maintain splicing, and therefore cellular plasticity into older age. The changes in splicing factor expression in the spleen are accompanied by changes in alternatively spliced genes indicative of reduced cell senescence, superior DNA repair and retained cellular proliferative capacity, and changes in splicing factor expression in muscle are indicative of lower pro‐inflammatory signalling. Our data highlight the importance of regulation of mRNA processing in determination of lifespan and suggest that splicing factors may provide novel points of intervention for future therapies to reduce disease burden in old age. Moreover, since some of these strains (e.g. C57BL/6J, A/J) are commonly used for the creation and cross‐breeding of genetically modified mice, strain‐specific alterations in alternative splicing could account for unexpected contributions to the final phenotype arising from the genetic background.
Experimental procedures
Mouse strains used for analysis
Strains were chosen on the basis of differential lifespan (A/J, NOD.B10Sn‐H2b/J, PWD.Phj, 129S1/SvlmJ, C57BL/6J and WSB/EiJ; see Table 2 for lifespan details) that were measured in a longitudinal study (Yuan et al., 2009, 2011, 2012) at Jackson Laboratory Nathan Shock Center of Excellence in the Basic Biology of Aging. Strains with extremely short lifespans (median lifespan less than 600 days) were excluded on the basis that a short lifespan may be associated with significant comorbidities. Characteristics of the mice and the numbers of animals used in each category are given in Table 2. All mice used in this study were male. All tissues were obtained from the mice of a cross‐sectional study that was conducted at the same period of time and in the same mouse room with the longitudinal study. Animal housing conditions have been fully described previously (Yuan et al., 2009, 2012). Briefly, mice were fed ad libitum an autoclaved pellet diet with 6% fat and acidified water (pH 2.8–3.1). Animals were kept on a 12:12‐h light/dark cycle at 50% relative humidity at 21–23 °C, in a restricted access specific pathogen‐free barrier facility. Mice were housed four animals per pen in individually ventilated polycarbonate cages supplied with HEPA‐filtered air and were tested quarterly for (and were free of) common viral, bacterial and mycoplasmal species. Mice were inspected daily and excluded if ill. At 6 or 20/22 months of age, mice were euthanized by CO2 asphyxiation, followed by blood collection via cardiac puncture and cervical dislocation. A detailed description of the tissue collection procedure is given in Data S1. Immediately after death, spleen and quadriceps muscle tissues were excised and snap‐frozen in vapour‐phase liquid nitrogen for storage within 5 min of collection. Tissues were stored at −80 °C.
Table 2.
Characteristics of mouse strains used in this study
| Strain | Strain Median lifespan (days)a | Strain Max Age (days) | Longevity class | N Young | N Old |
|---|---|---|---|---|---|
| A/J | 623 | 785 | Average lifespan |
Spleen – 7 Muscle – 8 |
Spleen – 7 Muscle – 7 |
| NOD.B10Sn‐H2b/J | 696 | 954 | Average lifespan |
Spleen – 4 Muscle – 4 |
Spleen – 6 Muscle – 6 |
| PWD.PhJ | 813 | 956 | Average lifespan |
Spleen – 5 Muscle – 4 |
Spleen – 6 Muscle – 6 |
| 129S1/SvlmJ | 882 | 1044 | Long‐lived |
Spleen – 10 Muscle – 4 |
Spleen – 10 Muscle – 10 |
| C57BL/6J | 901 | 1061 | Long‐lived |
Spleen – 10 Muscle – 10 |
Spleen – 8 Muscle – 9 |
| WSB/EiJ | 1005 | 1213 | Long‐lived |
Spleen – 5 Muscle – 5 |
Spleen – 10 Muscle – 10 |
Strain Max Age = the mean of the longest lived 20% within each strain. Data for median and maximum lifespans are given in Yuan et al. (2011) from a longitudinal study that was performed in conjunction with the cross‐sectional study described in the present paper.
The mean lifespan and the maximum lifespan (20% longest lived) are given for each strain used in this study. All mice used in this study were male. Young mice were 6 months old, and old mice were 20–22 months old. Muscle tissue was taken from the quadriceps.
Splicing factor candidate genes for analysis
An a priori list of splicing factor candidate genes were chosen on the basis that they were associated with human aging in populations and in primary human cell lines that had undergone in vitro senescence in our previous work (Harries et al., 2011; Holly et al., 2013). The list of genes included the positive regulatory splicing factors Srsf1, Srsf2, Srsf3, Srsf6, Srsf18 and Tra2β, the negative regulatory splicing inhibitors Hnrnpa0, Hnrnpa1, Hnrnpa2b1, Hnrnpd, Hnrnph3, Hnrnpk, Hnrnpm, Hnrnpul2 and the Sf3b1 subunit of the U2 spliceosome snRNP, which we have previously shown to be associated with age‐related altered DNA methylation (Holly et al., 2014). Assays were obtained in custom TaqMan low‐density array (TLDA) format from Life Technologies (Foster City, CA, USA). Assay Identifiers are given in Data S1.
Alternatively spliced target genes in spleen
Genes were chosen for assessment of alternative splicing in spleen on the basis of potential roles in cellular senescence (Cdkn2a), cell cycle regulation (Trp53, Myc), extracellular matrix (Fn1, Vcan) or DNA damage response (Atm, Chek2), since these genes may also be important in determination of lifespan. We designed TaqMan quantitative real‐time PCR assays to identify specific isoforms or groups of isoforms (if large numbers of common regions rendered the design of specific probes impossible). Assays were obtained in custom TaqMan low‐density array (TLDA) format from Life Technologies. Assay Identifiers are given in Data S2. A list of transcripts captured by each assay are given in Data S3.
Alternatively spliced target genes in muscle
Genes were selected for analysis of alternative splicing in muscle on the basis of potential roles in inflammatory processes relating to muscle remodelling since we have shown in our previous work that these processes are key determinants of muscle strength in older humans (Harries et al., 2012; Blackwell et al., 2015). Our gene list included isoforms of the Il1b, Il6, Nfkb1, Stat1 and Tnf genes. As above, TaqMan quantitative real‐time PCR assays were designed to identify specific isoforms or groups of isoforms (if large numbers of common regions rendered the design of specific probes impossible). Assays were obtained in custom TaqMan low‐density array (TLDA) format from Life Technologies. Assay Identifiers are given in Data S2.
RNA extraction and reverse transcription
Tissue samples were removed from storage and placed in 1 mL TRI Reagent® solution supplemented with the addition of 10 mm MgCl2 to aid recovery of microRNAs for future analysis (Kim et al., 2012). Samples were then completely homogenized (15mins for spleen samples, 30mins for muscle samples) using a bead mill (Retsch Technology GmbH, Haan, Germany). Phase separation was carried out using chloroform. Total RNA was precipitated from the aqueous phase by means of an overnight incubation at −20 °C with isopropanol. RNA pellets were then ethanol‐washed twice and resuspended in RNase‐free dH2O. RNA quality and concentration was assessed by Nanodrop spectrophotometry (Wilmington, DE, USA). Complementary DNA (cDNA) was then reverse‐transcribed from 100 ng total RNA using the Invitrogen VILO cDNA synthesis kit (Life Technologies) in 20 μL reactions according to manufacturer's instructions.
Quantitative real‐time PCR and data analysis
Quantitative RT–PCRs were performed on the ABI 7900HT platform (Life Technologies) on the TaqMan low‐density array (TLDA) platform. Cycling conditions were 50 °C for 2 min, 94.5 °C for 10 min and 50 cycles of 97 °C for 30 s and 57.9 °C for 1 min. The reaction mixes included 50 μL TaqMan® Universal PCR Mastermix II (no AmpErase® UNG) (Life Technologies), 30 μL dH2O and 20 μL cDNA template. 100 μL reaction solution was dispensed into the TLDA card chamber and centrifuged twice for 1 min at 216 × g to ensure distribution of solution to each well. The expression of transcripts in each sample was measured in duplicate replicates. The comparative Ct technique was used to calculate the expression of each test transcript (28). Expression was assessed relative to the global mean of expression and normalized to the median level of expression for each individual transcript. Data were log‐transformed to ensure normal distribution of data. Associations of transcript expression were assessed by linear regression against age, or lifespan as appropriate. Associations of transcript expression with mouse age were assessed in all animals and in animals of average‐lived or long‐lived strains individually, and associations of transcript expression with strain lifespan were assessed in all animals and in young and old groups individually. We also assessed the effect of potential nonlinearity of response for the splicing factor genes in spleen and muscle by a secondary analysis using binary logistic regression on data split by the median lifespan of all the strains. These statistical analyses were carried out using spss v.22 (IBM, North Castle, NY, USA). Interaction between strain longevity and mouse age was assessed using data categorized into average‐lived or long‐lived on the basis of interstrain median lifespan and was carried out in stata v.14 (StataCorp, College Station, TX, USA).
Gene expression cluster analysis for heterogeneity of splicing factor expression with age
The expression of each gene was z‐transformed to be on the scale of standard deviations from the mean, and then the expression values for each gene were plotted against the corresponding sample to generate a heat map. Hierarchical clustering methods were used to group similar expression profiles together. This analysis was done using the ‘heatmap.2’ package in R statistical software package v3.1.1 (Vienna, Austria).
Association between splicing factor expression and parental longevity in the InCHIANTI population
The participants in the InCHIANTI study aged 65+ years were categorized based on the age at death of their parents, the parental longevity score (PLS). Participants (total n = 405) were classified as either ‘two short‐lived parents’ (n = 17), ‘one short‐ and one intermediate‐lived parent’ (n = 140), ‘two intermediate‐lived parents’ (n = 190) or ‘any long‐lived parents’ (n = 58). Short‐, intermediate‐ and long‐lived cut‐offs were calculated separately for mothers and fathers based on the normal distribution of age at death in the cohort, as described in Dutta et al. (2013a). The cut‐offs for mothers were as follows: short‐lived (49–72 years), intermediate‐lived (72–95 years) and long‐lived (> 95 years); mothers aged < 49 years at death were classed as premature and excluded. The cut‐offs for fathers were: short‐lived (52–67 years), intermediate‐lived (68–89 years) and long‐lived (> 89 years); fathers aged < 52 years at death were classed as premature and excluded.
To assess the association between the gene expression levels of the 15 splicing factor genes in whole blood as defined in our previous work (Holly et al., 2013) and parental longevity score, linear regression models were carried out using R statistical software package v3.1.1 (Vienna, Austria), with gene expression as the dependent variable. Models were adjusted for age, sex, waist circumference, highest education level attained, smoking (pack‐years), study site, batches and cell counts (neutrophils, monocytes, basophils, eosinophils and whole white blood cell count). Gene expression data were rank‐normalized prior to analysis to remove any skew.
Bioinformatic assessment of potential regulatory effects of genetic variation within Hnrnpa2b1 and Hnrnpa1 genes
To assess the potential for genetic variation to contribute to splicing factor expression differences that we observe between strains, we have carried out a detailed examination of the strain‐discordant genetic differences in the splicing factor genes Hnrnpa2b1 and Hnrnpa1, which demonstrate links with longevity in both mouse and man. Complete genome sequence data were available for 4 of the strains we have used in our analysis (C57BL/6J, 129S1/SvImJ, A/J and WSB/EiJ). SNPs discordant between strains were examined for evidence of effects on gene regulation by a variety of bioinformatic approaches. Firstly, SNPs located in the 5′ UTR of the Hnrnpa2b1 or Hnrnpa1 genes were assessed for position relative to known transcription factor binding sites using regrna2.0 (http://regrna2.mbc.nctu.edu.tw/), an integrated web server tool that allows screening for potential regulatory elements. Secondly, intronic SNPs were assessed for their ability to interrupt exon and intron splicing enhancer and silencer loci using regrna2.0 and esefinder (http://rulai.cshl.edu/cgi-bin/tools/ESE3/esefinder.cgi?process=home), a specific tool for the identification of splicing regulatory elements. Finally, sequences in the 3′ untranslated region were screened for ability to disrupt elements with potential to disrupt elements important for mRNA stability (A‐rich elements, C to U RNA editing sites and miRNA binding sites) using regrna2.0.
Author contributions
BL carried out laboratory work, analysis and contributed to the manuscript, LCP contributed the statistical assessment of parental longevity in the human samples. FE contributed technical assistance and analysis. KF advised on selection and mouse strains and analytical approaches. RY and LP designed and managed the initial mouse lifespan study, identified genetic differences in Hnrnpa2b1 and Hnrnpa1 discordant between strains and contributed to the manuscript. DEH codirected the Jackson laboratory Nathan Shock Centre of Excellence in the Basic Biology of Aging at the time this work was performed, and was instrumental in facilitating the mouse collection and animal husbandry facilities used in this study. GAK contributed to and reviewed the manuscript. LF provided access to the InCHIANTI study data. DM comanaged the study and reviewed the manuscript. LWH managed the study, interpreted the data and wrote the manuscript.
Supporting information
Fig. S1 Interstrain heterogeneity of splicing factor expression according to mouse age in mouse strains of different lifespan.
Table S1 Splicing factor expression in mouse spleen tissue by lifespan, across 6 strains of different longevities.
Table S2 Splicing factor expression in mouse muscle tissue by lifespan, across 6 strains of different longevities.
Table S3 Alternative isoform expression in mouse spleen tissue by lifespan, across 6 strains of different longevities.
Table S4 Alternative isoform expression in mouse muscle tissue by lifespan, across 6 strains of different longevities.
Table S5 Splicing factor expression in mouse spleen tissue by age in young (6 months) and old (20–22 months) mice.
Table S6 Splicing factor expression in mouse muscle tissue by age in young (6 months) and old (20–22 months) mice.
Table S7 Alternative isoform expression in mouse spleen tissue by age in young (6 months) and old (20–22 months) mice.
Table S8 Alternative isoform expression in mouse muscle tissue by age in young (6 months) and old (20–22 months) mice.
Table S9 Analyses of potential interactions between mouse strain longevity and mouse age.
Table S10 Splicing factor expression in mouse spleen tissue by lifespan, across 6 strains of different longevities by binary logistic regression.
Table S11 Splicing factor expression in mouse muscle tissue by lifespan, across 6 strains of different longevities by binary logistic regression.
Table S12 Genetic variation within the mouse Hnrnpa2b1 and Hnrnpa1 genes and its predicted effect on gene regulation.
Data S1 Detailed tissue collection protocol.
Data S2 Assay identifiers and sequence details for qRT–PCR assays used in this study.
Data S3 Alternatively expressed isoforms captured by quantitative real‐time PCR assays. Microsoft word file. Additional information describing precisely which alternatively expressed isoforms of analysed genes are captured by each probe set.
Acknowledgments
The authors would like to acknowledge the Wellcome Trust (grant number WT097835MF LWH, DM), and NIH‐NIA grant number AG038070 to The Jackson Laboratory for providing the funding for this study. We would also like to acknowledge the contributions of Federica Bighi and John Watt for technical assistance. The authors have no conflict of interest to disclose.
References
- Almog N, Goldfinger N, Rotter V (2000) p53‐dependent apoptosis is regulated by a C‐terminally alternatively spliced form of murine p53. Oncogene 19, 3395–3403. [DOI] [PubMed] [Google Scholar]
- Baloh RH (2011) TDP‐43: the relationship between protein aggregation and neurodegeneration in amyotrophic lateral sclerosis and frontotemporal lobar degeneration. FEBS J. 278, 3539–3549. [DOI] [PMC free article] [PubMed] [Google Scholar]
- Barbosa‐Morais NL, Carmo‐Fonseca M, Aparicio S (2006) Systematic genome‐wide annotation of spliceosomal proteins reveals differential gene family expansion. Genome Res. 16, 66–77. [DOI] [PMC free article] [PubMed] [Google Scholar]
- Barbosa‐Morais NL, Irimia M, Pan Q, Xiong HY, Gueroussov S, Lee LJ, Slobodeniuc V, Kutter C, Watt S, Colak R, Kim T, Misquitta‐Ali CM, Wilson MD, Kim PM, Odom DT, Frey BJ, Blencowe BJ (2012) The evolutionary landscape of alternative splicing in vertebrate species. Science 338, 1587–1593. [DOI] [PubMed] [Google Scholar]
- Blackwell J, Harries LW, Pilling LC, Ferrucci L, Jones A, Melzer D (2015) Changes in CEBPB expression in circulating leukocytes following eccentric elbow‐flexion exercise. J. Physiol. Sci. 65, 145–150. [DOI] [PMC free article] [PubMed] [Google Scholar]
- Bogue MA, Peters LL, Paigen B, Korstanje R, Yuan R, Ackert‐Bicknell C, Grubb SC, Churchill GA, Chesler EJ (2014) Accessing data resources in the mouse phenome database for genetic analysis of murine life span and health span. J. Gerontol. A Biol. Sci. Med. Sci. 71, 170–177. [DOI] [PMC free article] [PubMed] [Google Scholar]
- Cartegni L, Chew SL, Krainer AR (2002) Listening to silence and understanding nonsense: exonic mutations that affect splicing. Nat. Rev. Genet. 3, 285–298. [DOI] [PubMed] [Google Scholar]
- Danan‐Gotthold M, Golan‐Gerstl R, Eisenberg E, Meir K, Karni R, Levanon EY (2015) Identification of recurrent regulated alternative splicing events across human solid tumors. Nucleic Acids Res. 43, 5130–5144. [DOI] [PMC free article] [PubMed] [Google Scholar]
- Dellago H, Khan A, Nussbacher M, Gstraunthaler A, Lammermann I, Schosserer M, Muck C, Anrather D, Scheffold A, Ammerer G, Jansen‐Durr P, Rudolph KL, Voglauer‐Grillari R, Grillari J (2012) ATM‐dependent phosphorylation of SNEVhPrp19/hPso4 is involved in extending cellular life span and suppression of apoptosis. Aging (Albany NY) 4, 290–304. [DOI] [PMC free article] [PubMed] [Google Scholar]
- Dutta A, Henley W, Robine JM, Langa KM, Wallace RB, Melzer D (2013a) Longer lived parents: protective associations with cancer incidence and overall mortality. J. Gerontol. A Biol. Sci. Med. Sci. 68, 1409–1418. [DOI] [PMC free article] [PubMed] [Google Scholar]
- Dutta A, Henley W, Robine JM, Llewellyn D, Langa KM, Wallace RB, Melzer D (2013b) Aging children of long‐lived parents experience slower cognitive decline. Alzheimers Dement. 10, S315–322. [DOI] [PubMed] [Google Scholar]
- Ferrucci L, Bandinelli S, Benvenuti E, Di Iorio A, Macchi C, Harris TB, Guralnik JM (2000) Subsystems contributing to the decline in ability to walk: bridging the gap between epidemiology and geriatric practice in the InCHIANTI study. J. Am. Geriatr. Soc. 48, 1618–1625. [DOI] [PubMed] [Google Scholar]
- Franceschi C, Campisi J (2014) Chronic inflammation (inflammaging) and its potential contribution to age‐associated diseases. J. Gerontol. A Biol. Sci. Med. Sci. 69(Suppl 1), S4–S9. [DOI] [PubMed] [Google Scholar]
- Garg K, Green P (2007) Differing patterns of selection in alternative and constitutive splice sites. Genome Res. 17, 1015–1022. [DOI] [PMC free article] [PubMed] [Google Scholar]
- Gautrey H, Jackson C, Dittrich AL, Browell D, Lennard T, Tyson‐Capper A (2015) SRSF3 and hnRNP H1 regulate a splicing hotspot of HER2 in breast cancer cells. RNA Biol. 12, 1139–1151. [DOI] [PMC free article] [PubMed] [Google Scholar]
- Glessner JT, Smith AV, Panossian S, Kim CE, Takahashi N, Thomas KA, Wang F, Seidler K, Harris TB, Launer LJ, Keating B, Connolly J, Sleiman PM, Buxbaum JD, Grant SF, Gudnason V, Hakonarson H (2013) Copy number variations in alternative splicing gene networks impact lifespan. PLoS One 8, e53846. [DOI] [PMC free article] [PubMed] [Google Scholar]
- Goncalves V, Jordan P (2015) Posttranscriptional regulation of splicing factor SRSF1 and its role in cancer cell biology. Biomed. Res. Int. 2015, 287048. [DOI] [PMC free article] [PubMed] [Google Scholar]
- Guo J, Jia J, Jia R (2015) PTBP1 and PTBP2 impaired autoregulation of SRSF3 in cancer cells. Sci. Rep. 5, 14548. [DOI] [PMC free article] [PubMed] [Google Scholar]
- Harries LW, Hernandez D, Henley W, Wood AR, Holly AC, Bradley‐Smith RM, Yaghootkar H, Dutta A, Murray A, Frayling TM, Guralnik JM, Bandinelli S, Singleton A, Ferrucci L, Melzer D (2011) Human aging is characterized by focused changes in gene expression and deregulation of alternative splicing. Aging Cell 10, 868–878. [DOI] [PMC free article] [PubMed] [Google Scholar]
- Harries LW, Pilling LC, Hernandez LD, Bradley‐Smith R, Henley W, Singleton AB, Guralnik JM, Bandinelli S, Ferrucci L, Melzer D (2012) CCAAT‐enhancer‐binding protein‐beta expression in vivo is associated with muscle strength. Aging Cell 11, 262–268. [DOI] [PMC free article] [PubMed] [Google Scholar]
- Holly AC, Melzer D, Pilling LC, Fellows AC, Tanaka T, Ferrucci L, Harries LW (2013) Changes in splicing factor expression are associated with advancing age in man. Mech. Ageing Dev. 134, 356–366. [DOI] [PMC free article] [PubMed] [Google Scholar]
- Holly AC, Pilling LC, Hernandez D, Lee BP, Singleton A, Ferrucci L, Melzer D, Harries LW (2014) Splicing factor 3B1 hypomethylation is associated with altered SF3B1 transcript expression in older humans. Mech. Ageing Dev. 135, 50–56. [DOI] [PMC free article] [PubMed] [Google Scholar]
- Huang H, Kaku S, Knights C, Park B, Clifford J, Kulesz‐Martin M (2002) Repression of transcription and interference with DNA binding of TATA‐binding protein by C‐terminal alternatively spliced p53. Exp. Cell Res. 279, 248–259. [DOI] [PubMed] [Google Scholar]
- Kim YK, Yeo J, Kim B, Ha M, Kim VN (2012) Short structured RNAs with low GC content are selectively lost during extraction from a small number of cells. Mol. Cell 46, 893–895. [DOI] [PubMed] [Google Scholar]
- Kim HJ, Kim NC, Wang YD, Scarborough EA, Moore J, Diaz Z, MacLea KS, Freibaum B, Li S, Molliex A, Kanagaraj AP, Carter R, Boylan KB, Wojtas AM, Rademakers R, Pinkus JL, Greenberg SA, Trojanowski JQ, Traynor BJ, Smith BN, Topp S, Gkazi AS, Miller J, Shaw CE, Kottlors M, Kirschner J, Pestronk A, Li YR, Ford AF, Gitler AD, Benatar M, King OD, Kimonis VE, Ross ED, Weihl CC, Shorter J, Taylor JP (2013) Mutations in prion‐like domains in hnRNPA2B1 and hnRNPA1 cause multisystem proteinopathy and ALS. Nature 495, 467–473. [DOI] [PMC free article] [PubMed] [Google Scholar]
- Lisowiec J, Magner D, Kierzek E, Lenartowicz E, Kierzek R (2015) Structural determinants for alternative splicing regulation of the MAPT pre‐mRNA. RNA Biol. 12, 330–342. [DOI] [PMC free article] [PubMed] [Google Scholar]
- Lu ZX, Huang Q, Park JW, Shen S, Lin L, Tokheim CJ, Henry MD, Xing Y (2015) Transcriptome‐wide landscape of pre‐mRNA alternative splicing associated with metastatic colonization. Mol. Cancer Res. 13, 305–318. [DOI] [PMC free article] [PubMed] [Google Scholar]
- Lunetta KL, D'Agostino RB Sr, Karasik D, Benjamin EJ, Guo CY, Govindaraju R, Kiel DP, Kelly‐Hayes M, Massaro JM, Pencina MJ, Seshadri S, Murabito JM (2007) Genetic correlates of longevity and selected age‐related phenotypes: a genome‐wide association study in the Framingham Study. BMC Med. Genet. 8(Suppl 1), S13. [DOI] [PMC free article] [PubMed] [Google Scholar]
- Meshorer E, Soreq H (2002) Pre‐mRNA splicing modulations in senescence. Aging Cell 1, 10–16. [DOI] [PubMed] [Google Scholar]
- Neumann M, Igaz LM, Kwong LK, Nakashima‐Yasuda H, Kolb SJ, Dreyfuss G, Kretzschmar HA, Trojanowski JQ, Lee VM (2007) Absence of heterogeneous nuclear ribonucleoproteins and survival motor neuron protein in TDP‐43 positive inclusions in frontotemporal lobar degeneration. Acta Neuropathol. 113, 543–548. [DOI] [PubMed] [Google Scholar]
- Romano M, Buratti E, Romano G, Klima R, Del Bel Belluz L, Stuani C, Baralle F, Feiguin F (2014) Evolutionarily conserved heterogeneous nuclear ribonucleoprotein (hnRNP) A/B proteins functionally interact with human and Drosophila TAR DNA‐binding protein 43 (TDP‐43). J. Biol. Chem. 289, 7121–7130. [DOI] [PMC free article] [PubMed] [Google Scholar]
- Sato S, Kawamata Y, Takahashi A, Imai Y, Hanyu A, Okuma A, Takasugi M, Yamakoshi K, Sorimachi H, Kanda H, Ishikawa Y, Sone S, Nishioka Y, Ohtani N, Hara E (2015) Ablation of the p16(INK4a) tumour suppressor reverses ageing phenotypes of klotho mice. Nat. Commun. 6, 7035. [DOI] [PMC free article] [PubMed] [Google Scholar]
- Scuderi S, La Cognata V, Drago F, Cavallaro S, D'Agata V (2014) Alternative splicing generates different parkin protein isoforms: evidences in human, rat, and mouse brain. Biomed. Res. Int. 2014, 690796. [DOI] [PMC free article] [PubMed] [Google Scholar]
- Shilo A, Ben Hur V, Denichenko P, Stein I, Pikarsky E, Rauch J, Kolch W, Zender L, Karni R (2014) Splicing factor hnRNP A2 activates the Ras‐MAPK‐ERK pathway by controlling A‐Raf splicing in hepatocellular carcinoma development. RNA 20, 505–515. [DOI] [PMC free article] [PubMed] [Google Scholar]
- Slack C, Alic N, Foley A, Cabecinha M, Hoddinott MP, Partridge L (2015) The Ras‐Erk‐ETS‐signaling pathway is a drug target for longevity. Cell 162, 72–83. [DOI] [PMC free article] [PubMed] [Google Scholar]
- Swindell WR (2009) Genes and gene expression modules associated with caloric restriction and aging in the laboratory mouse. BMC Genom. 10, 585. [DOI] [PMC free article] [PubMed] [Google Scholar]
- Tominaga K (2015) The emerging role of senescent cells in tissue homeostasis and pathophysiology. Pathobiol. Aging Age Relat. Dis. 5, 27743. [DOI] [PMC free article] [PubMed] [Google Scholar]
- Wu Y, Huang H, Miner Z, Kulesz‐Martin M (1997) Activities and response to DNA damage of latent and active sequence‐specific DNA binding forms of mouse p53. Proc. Natl Acad. Sci. USA 94, 8982–8987. [DOI] [PMC free article] [PubMed] [Google Scholar]
- Yuan R, Tsaih SW, Petkova SB, Marin de Evsikova C, Xing S, Marion MA, Bogue MA, Mills KD, Peters LL, Bult CJ, Rosen CJ, Sundberg JP, Harrison DE, Churchill GA, Paigen B (2009) Aging in inbred strains of mice: study design and interim report on median lifespans and circulating IGF1 levels. Aging Cell 8, 277–287. [DOI] [PMC free article] [PubMed] [Google Scholar]
- Yuan R, Peters LL, Paigen B (2011) Mice as a mammalian model for research on the genetics of aging. ILAR J. 52, 4–15. [DOI] [PMC free article] [PubMed] [Google Scholar]
- Yuan R, Meng Q, Nautiyal J, Flurkey K, Tsaih SW, Krier R, Parker MG, Harrison DE, Paigen B (2012) Genetic coregulation of age of female sexual maturation and lifespan through circulating IGF1 among inbred mouse strains. Proc. Natl Acad. Sci. USA 109, 8224–8229. [DOI] [PMC free article] [PubMed] [Google Scholar]
Associated Data
This section collects any data citations, data availability statements, or supplementary materials included in this article.
Supplementary Materials
Fig. S1 Interstrain heterogeneity of splicing factor expression according to mouse age in mouse strains of different lifespan.
Table S1 Splicing factor expression in mouse spleen tissue by lifespan, across 6 strains of different longevities.
Table S2 Splicing factor expression in mouse muscle tissue by lifespan, across 6 strains of different longevities.
Table S3 Alternative isoform expression in mouse spleen tissue by lifespan, across 6 strains of different longevities.
Table S4 Alternative isoform expression in mouse muscle tissue by lifespan, across 6 strains of different longevities.
Table S5 Splicing factor expression in mouse spleen tissue by age in young (6 months) and old (20–22 months) mice.
Table S6 Splicing factor expression in mouse muscle tissue by age in young (6 months) and old (20–22 months) mice.
Table S7 Alternative isoform expression in mouse spleen tissue by age in young (6 months) and old (20–22 months) mice.
Table S8 Alternative isoform expression in mouse muscle tissue by age in young (6 months) and old (20–22 months) mice.
Table S9 Analyses of potential interactions between mouse strain longevity and mouse age.
Table S10 Splicing factor expression in mouse spleen tissue by lifespan, across 6 strains of different longevities by binary logistic regression.
Table S11 Splicing factor expression in mouse muscle tissue by lifespan, across 6 strains of different longevities by binary logistic regression.
Table S12 Genetic variation within the mouse Hnrnpa2b1 and Hnrnpa1 genes and its predicted effect on gene regulation.
Data S1 Detailed tissue collection protocol.
Data S2 Assay identifiers and sequence details for qRT–PCR assays used in this study.
Data S3 Alternatively expressed isoforms captured by quantitative real‐time PCR assays. Microsoft word file. Additional information describing precisely which alternatively expressed isoforms of analysed genes are captured by each probe set.