

Abstract
Neurotransmitters are not only involved in brain function but are also important signaling molecules for many diverse cell types. Neurotransmitters are widely conserved, from evolutionarily ancient organisms lacking nervous systems through man. Here, results are reported from a loss‐ and gain‐of‐function survey, using pharmacological modulators of several neurotransmitter pathways to examine possible roles for these pathways in normal embryogenesis. Applying reagents targeting the glutamatergic, adrenergic and dopaminergic pathways to embryos of Xenopus laevis from gastrulation to organogenesis stages, we observed and quantified numerous malformations, including craniofacial defects, hyperpigmentation, muscle mispatterning and miscoiling of the gut. These data implicate several key neurotransmitters in new embryonic patterning roles, reveal novel earlier stages for processes involved in eye development, suggest new targets for subsequent molecular‐genetic investigation, and highlight the necessity for in‐depth toxicology studies of psychoactive compounds to which human embryos might be exposed during pregnancy.
Keywords: acetylcholine, adrenaline, BAY 36‐7620, Cimaterol, development, dopamine, drug screen, embryogenesis, glutamate, malformation, neurotransmitter, Nicergoline, noradrenaline, Norketamine, Propranolol, Riluzole, SCH23390, serotonin, teratogen, toxicology, Xenopus
Introduction
Although neurotransmitters are most often investigated for their role relaying information throughout the nervous system, they also participate as chemical messengers in many signaling events of a non‐neuronal nature (Lauder, 1988; Entschladen et al. 2002; Levin et al. 2006; Dube & Amireault, 2007). Neurotransmitters precede the appearance of nervous systems on both developmental and evolutionary time scales. Classical neurotransmitters have been found in oocytes and pre‐nervous embryos of both vertebrates and invertebrates, including mammals, amphibians, fish, insects and echinoderms (Buznikov & Shmukler, 1981; Kusano et al. 1982). In addition, neurotransmitters are so evolutionarily ancient that they are found in organisms outside the animal kingdom. For example, acetylcholine is present in all kingdoms of life including fungi and bacteria (Horiuchi et al. 2003), and serotonin is present in plants (Levin et al. 2006; Pelagio‐Flores et al. 2011). It has thus been hypothesized that the complex cognitive functions occurring in animal brains, and partially mediated by neurotransmitters, evolved from much simpler cell–cell signaling events responsible for developmental patterning and maintenance of homeostasis in primitive organisms (Buznikov & Shmukler, 1981).
Humans and other vertebrates express serotonergic, glutamatergic, cholinergic and dopaminergic receptors in non‐neural tissues, where these receptors participate in a variety of physiological events (Levin et al. 2006; Wessler & Kirkpatrick, 2008; Bozic & Valdivielso, 2015; Tank & Lee Wong, 2015). Most remarkably, complete neurotransmitter systems containing not only receptors, but also machinery for neurotransmitter synthesis and degradation, are present in several somatic organs. For example, the kidney possesses its own dopaminergic system that protects it from oxidative stress and inflammation, and regulates sodium excretion (Choi et al. 2015). In addition, the epidermis has cholinergic and adrenergic systems that control cell growth, motility and pigmentation (Grando et al. 2006), as well as a serotonergic system responsible for a wide range of responses to environmental rhythms and stresses (Slominski et al. 2003, 2005).
Perhaps most interestingly, neurotransmitters have been shown to participate in embryonic development as well as in maintenance of physiological states. They are best known for organizing the developing mammalian brain (Nguyen et al. 2001), but also act as important body‐wide patterning signals in a wide variety of animals. In the sea urchin embryo, cleavage and gastrulation are, in part, regulated by serotonin (Levin et al. 2006); a similar role was found for serotonin in the fruit fly model (Colas et al. 1999a,b). In addition, lipophilic analogs of serotonin, acetylcholine and cannabinoids have been shown to rescue sea urchin embryos from developmental defects induced by the amyloid protein fragments responsible for Alzheimer's disease (Buznikov et al. 2008).
In vertebrates, several developmental roles of serotonin are well documented. Serotonin regulates many different aspects of bone development, including chondrogenic differentiation (Bhasin et al. 2004), osteoblast proliferation (Cray et al. 2014) and maintenance of bone mass (Ducy & Karsenty, 2010). Serotonergic signaling is also an invaluable regulator of craniofacial development, stimulating neural crest cell migration (Moiseiwitsch & Lauder, 1995; Choi et al. 1997), morphogenesis of the jaw joint and branchial arches (Reisoli et al. 2010), skull ossification (Cray et al. 2014), formation of the teeth (Moiseiwitsch & Lauder, 1996), and organization of the retina (Reisoli et al. 2008). In addition, it has been shown in both frog and chick that serotonin acts as a very early signal in left–right patterning, acting upstream of the earliest asymmetrically transcribed genes (Fukumoto et al. 2005a,b; Carneiro et al. 2011; Beyer et al. 2012; Vandenberg et al. 2012, 2014).
Although serotonin is well established as a player in vertebrate embryonic development, the developmental functions of other neurotransmitter families are yet to be characterized. Information on involvement of neurotransmitters in pattern formation would not only identify novel components of embryogenesis, but also give important insight into potential new endpoints for teratogenic (embryotoxic) effects of widespread pharmaceuticals (Alwan et al. 2007; Louik et al. 2007; Colvin et al. 2011; Myles et al. 2013; Hurault‐Delarue et al. 2014; Yazdy et al. 2014). To begin to identify possible patterning roles for other neurotransmitter families, this study took advantage of compounds developed for neuropharmacological research, and an exploratory drug screen was conducted in the Xenopus laevis embryo, a popular vertebrate model for the study of well‐conserved developmental mechanisms (Kaltenbrun et al. 2011; King et al. 2012; Ori et al. 2013; Pratt & Khakhalin, 2013; Schmitt et al. 2014), as well as for studies of developmental toxicology (Sunderman et al. 1991, 1992; Fort et al. 1992; Mouche et al. 2011; Leconte & Mouche, 2013). This preliminary screen represents the first tier of an inverse drug screen, of the variety described by (Adams & Levin, 2006), in which drugs are tested in a hierarchical manner according to target specificity, to rapidly bypass large families with no apparent roles and progressively home in on targets with interesting functions. Here, representative pharmacological loss‐ and gain‐of‐function experiments were presented using reagents targeting the glutamatergic, adrenergic and dopaminergic systems indiscriminately (ex. glutamate release inhibitor) or at the first level of receptor categorization (ex. adrenergic β‐agonist). This study specifically focused on reagents whose effects revealed true patterning defects as opposed to simply generalized toxicity at the cellular level. The results of this screen demonstrate that neuroactive drugs, many of which are used clinically, are capable of inducing a wide variety of craniofacial, pigmentation, muscle and body axis abnormalities. These data implicate several interesting targets for further pharmacological testing, as well as for future molecular‐genetic experiments and analysis of developmental marker expression.
Materials and methods
Animal husbandry
Xenopus laevis eggs were fertilized in vitro and embryos were cultured according to standard protocols (Sive et al. 2000) in 0.1 × modified Mark's Ringer (MMR, pH 7.8) solution with 0.1% gentamycin. Embryos were housed at 14–22 °C and staged according to Nieuwkoop & Faber (1994). All experimental procedures involving use of laboratory animals were approved by the Institutional Animal Care and Use Committee (IACUC) and Division of Laboratory Animal Medicine at Tufts University, under protocol number (M2014‐79).
Pharmacological screen
All compounds were obtained from Tocris, with the exception of propranolol, which was obtained from Sigma. Drugs were dissolved in water or dimethylsulfoxide (DMSO; if water insoluble), aliquotted and stored at −20 °C until use.
Embryos from three–four mothers were mixed and divided into control (MMR) or experimental (MMR + drug at concentrations of 500 nm–500 μm) groups. Doses were established for each drug on an individual basis as follows. To establish an initial reference point for dosing, literature using the drug in either a cell culture, syaptosome Xenopus oocyte, or mammalian brain slice system was examined. The dose was then adjusted upwards or downwards from the value found in the literature, until a dose was reached at which embryos displayed developmental phenotypes but no increase in mortality or overt toxicity compared with controls. If drugs caused different phenotypes at different doses, all such results were discussed. All doses discussed were within about one order of magnitude of the doses found in the literature: riluzole, 4 μm (Westphalen & Hemmings, 2003); norketamine, 39 μm (Ebert et al. 1997a); BAY 36‐7620, 10 μm (Carroll et al. 2001); propranolol, 50 μm (Pan et al. 2015); nicergoline, 10 μm (Caraci et al. 2005); cimaterol, 100 μm (Hu et al. 1988); and SCH 23390, 10 μm (Szulczyk et al. 2012). Vehicle (DMSO for water‐insoluble compounds) levels never exceeded 0.5%, a level that permits completely normal embryonic development. Water was used as vehicle whenever possible. Drug exposures began at gastrulation (Stages 10–11) and continued until Stage 45. If this length of exposure was unable to produce any aberrant phenotypes, an earlier exposure starting at cleavage was tested (2/4 cell‐Stage 45). At Stage 45, embryos were imaged on a Nikon (SMZ‐1500) microscope with a combination of incident light and transmitted light that best highlighted anatomical features.
Statistics
At Stage 45, embryos were morphologically scored for craniofacial defects (compressed head, microcephaly, indentation or projection of nose), abnormal eye development (cyclopia, missing eyes, ectopic retinal pigment epithelium (RPE), pigmented optic nerves, and undersized or misshapen eyes), miscoiling of the gut and hyperpigmentation, via a Zeiss SV6 microscope. Hyperpigmentation was an all‐or‐nothing phenotype (Blackiston et al. 2011; Lobikin et al. 2015) characterized by large numbers of ectopic melanocytes being present around the eyes and in the peripheral regions of the head, as well as increased melanocyte arborization and coverage of the gut and tail. Occasional dead embryos and embryos lacking basic body organization (such as exogastrulates) were considered unscorable and excluded from analysis. The incidences of unscorable embryos did not differ between control and drug‐treated groups. Counts of normal and abnormal embryos in control and drug‐treated groups were plotted on a 2 × 2 contingency table and statistically analyzed with Fisher's Exact Test, using graphpad software.
To further characterize the defects observed, five embryos per dose of each drug were randomly selected, and a number of parameters describing craniofacial shape, pigmentation, body size and body curvature were measured using imagej software. For visual descriptions of these parameters, please see Fig. S1. These parameters were then compared with those of five randomly‐selected control embryos via the Mann–Whitney U‐test. Basic dimensions of the head included maximum width, length from posterior‐most point of the craniofacial skeleton to anterior‐most point of the head, and distance between the eyes (as defined by the proximal‐most extension of RPE toward the midline). Parameters of facial shape included length : width ratio, anterior projection of the nose (length of a line running perpendicularly from the imaginary line connecting the eye lenses to the anterior‐most point of the face) and eye ratio (distance between eyes : max head width).
In addition to quantifying craniofacial size and shape, a variety of parameters were also used to describe overall body size and curvature. Two different types of body length measurement were taken: ‘straight’ length and ‘string’ length. Straight length is defined as the length of a straight line extending from the anterior‐most point of the head to the tip of the tail. String length is the length of a line that extends from the anterior‐most point of the head to the tip of the tail, passing through the muscular portion of the tail and bending with the animal. Curvature of the animal was quantified by calculating the ratio of straight length to string length. Perfectly straight animals have a string : straight ratio of 1, and lower ratio values signify increased curvature. For straight drug‐treated animals and their respective controls, straight length was the primary metric used to describe overall body size. For curved animals and their respective controls, however, string length was a more accurate indicator of the animals’ body size.
Finally, for drugs that caused hyperpigmentation, gut and tail melanocytes were quantified on digital images using the cell counter function of imagej. Animals in the images were anesthetized with tricaine (MS‐222), which contracts pigment granules and allows discrete pigmented cells to be counted unambiguously. Areas in which melanocytes were counted were defined using a standard‐size area in Adobe Photoshop. In the gut, melanocytes were counted within a circle whose diameter was 350 pixels. In the tail, melanocytes were counted within a 350 × 200 pixel box extending posteriorly from the cloaca, whose bottom edge lined up with the ventral‐most edge of the tail muscles.
Whole‐mount immunohistochemistry for muscle visualization
Control and drug‐exposed embryos were killed at Stage 45 with tricaine (MS‐222) and fixed in MEMFA [100 mm 3‐(N morpholino) propanesulfonic acid (pH 7.4), 2 mm ethylene‐glycol tetraacetic acid, 1 mm MgSO4, 3.7% formaldehyde] for 2 h. Embryos were then washed 3 × in phosphate‐buffered saline (PBS), permeabilized at room temperature in PBTr [PBS, 2 mg mL−1 bovine serum albumin (BSA), 0.1% Triton X‐100] for 30 min, and blocked for 1 h at room temperature with 10% goat serum in PBT (PBS, 2 mg mL−1 BSA, 0.1% Tween‐20). Embryos were rocked overnight at 4 °C with 12/101 primary antibody (DHSB, 1 : 100 dilution in blocking solution). Following primary exposure, embryos were washed 6 × in PBT (1 h per wash) and blocked for 1 h with 10% goat serum in PBT. Embryos were then rocked overnight at 4 °C with AlexaFluor‐555 (1 : 500 dilution in blocking solution). Following secondary incubation, embryos were washed 6 × in PBT (1 h per wash) and imaged on a Nikon (SMZ‐1500) microscope.
Alcian Blue staining
Alcian Blue staining was performed on embryos with phenotypes in which examination of craniofacial cartilages would be informative for characterizing their specific defects. Embryos were continuously exposed to drugs from gastrulation until Stage 45. They were then washed 3 × in MMR. Embryos were then grown in MMR and fed every other day with spirulina until they reached Stage 48 (except for riluzole and Bay 36‐7620, which were analyzed at Stage 45 because of viability problems at later stages.). Tadpoles were then killed with an overdose of tricaine (MS‐222) and fixed overnight in MEMFA. Tadpoles were then stained in Alcian Blue according to Pasqualetti et al. (2000) and imaged with a Nikon (SMZ‐1500) microscope.
Results
Riluzole treatment caused hyperpigmentation, edema, miscoiling of the gut and craniofacial defects
Riluzole is an anticonvulsive drug that increases γ‐aminobutyric acid (GABA)‐ergic signaling by blocking its reuptake, and decreases glutamatergic signaling by inhibiting glutamate release (Cifra et al. 2013). At all riluzole doses tested (exposed from gastrula to Stage 45), over 90% of embryos were hyperpigmented due to the presence of excess (including ectopic) abnormally arborized melanocytes darkening the gut, tail and peripheral regions of the head (Fig. 1). The frequency of total developmental abnormalities in riluzole‐treated embryos (n = 54, 61 and 58 for 5, 33 and 50 μm, respectively) was significantly greater than in control (n = 55) embryos at all doses tested (P < 0.01 for all doses). Although riluzole caused a high occurrence of defects regardless of dose, the frequencies of different sub‐classes of defects changed according to the dose tested, with the exception of hyperpigmentation. In Xenopus, hyperpigmentation results from a neoplastic‐like conversion of melanocytes (Morokuma et al. 2008; Blackiston et al. 2011), and in humans, can be a sign of systemic diseases resulting from the dysregulation of endocrine or cell–cell signaling pathways (Speeckaert et al. 2014). Hyperpigmentation was not observed at all in controls. Quantification of gut and tail melanocytes revealed that embryos treated with 5 μm riluzole had significantly larger populations of melanocytes in these body areas than did controls (Table 1; P < 0.02 for gut, P < 0.03 for tail). It is not yet known whether the increased number of melanocytes in riluzole‐treated tadpoles is due to conversion of additional cell types into the melanocyte lineage in ectopic locations, or overproliferation and migration of excess melanocytes away from their endogenous locations.
Figure 1.

Embryos treated with riluzole (RZ) developed abnormal pigmentation, miscoiled guts, edema and craniofacial defects. Embryos were continuously exposed to 5, 33 or 50 μm of RZ from gastrulation (Stages 10–11) until Stage 45. All scale bars represent 1 mm. (a) Representative pigment, gut and craniofacial anomalies observed in Stage 45 RZ‐treated embryos. Embryos developed hyperpigmentation in all doses of RZ, as evidenced by melanocyte invasion into peripheral regions of the head, increased number and arborization of melanocytes in the tail, and increased melanocyte coverage of the gut. Abnormal melanocyte coverage is marked with red arrows. (i, ii, iii) Profile, gut and head of normally developed embryo. (vi, vii, viii) Profile, gut and head of hyperpigmented embryo treated with 5 μm RZ. Gut (vii) and craniofacial (viii) development are normal. (xi) Profile of embryo treated with 33 μm RZ, pericardial edema marked with blue arrow. (xii) Miscoiled gut of embryo treated with 33 μm RZ, marked with yellow arrow. (xiii) Head of embryo treated with 33 μm RZ, which appears enlarged due to edematous swelling. (xvi) Profile of embryo treated with 50 μm RZ, pericardial edema marked with blue arrow. (xvii) Miscoiled gut of embryo treated with 50 μm RZ, marked with yellow arrow. (xviii) Head of embryos treated with 50 μm RZ, compressed on the anterior–posterior (AP) axis with thickening and pigmentation of eye–brain connections, marked with green arrows. (iv, ix, xiv, xix) Ventral views of Stage 45 embryos stained with the skeletal muscle antibody 12/101. Interhyoideus muscle (ih) and hypaxial muscle (h) are labeled on the control embryo. Muscular defects, such as disorganization of the hypaxial muscles or disruption of the interhyoideus muscle, are labeled with white arrows. (v, x, xv, xx) Ventral views of Stage 45 control and RZ‐treated embryos stained with Alcian blue. In the control embryo, Meckel's cartilage is labeled ‘m’, the ceratohyal cartilage is labeled ‘ch’ and the branchial arches are labeled ‘ba’. (b) Percentages of control and RZ‐treated embryos that developed hyperpigmentation, edema, miscoiled guts and retinal pigment epithelium (RPE) defects. Categories are not mutually exclusive, as most embryos developed at least two types of defects.
Table 1.
Median and interquartile range for measurements of head dimensions, body length and melanocyte counts in control and riluzole‐treated Stage 45 embryos
| CTRL n = 5 | Riluzole 5 μm n = 5 | Riluzole 33 μm n = 5 | Riluzole 50 μm n = 5 | ||||||||
|---|---|---|---|---|---|---|---|---|---|---|---|
| Med. | IQR | Med. | IQR | Significant? | Med. | IQR | Significant? | Med. | IQR | Significant? | |
| Head length (lengthh) | 2.73 | 0.14 | 2.76 | 0.2 | No, P = 0.83 | 2.27 | 0.03 | Yes, P < 0.02 | 1.77 | 0.18 | Yes, P < 0.02 |
| Head width (widthh) | 3.35 | 0.11 | 3.30 | 0.1 | No, P = 0.53 | 3.52 | 0.11 | No, P = 0.14 | 2.73 | 0.31 | Yes, P < 0.02 |
| Lengthh/widthh | 0.81 | 0.03 | 0.84 | 0 | No, P = 0.30 | 0.64 | 0.02 | Yes, P < 0.02 | 0.67 | 0.09 | No, P = 0.09 |
| Lengthh/lengthb | 0.27 | 0.01 | 0.26 | 0 | No, P = 0.30 | 0.22 | 0.02 | Yes, P < 0.02 | 0.19 | 0.02 | Yes, P < 0.02 |
| Eye ratio | 0.65 | 0.01 | 0.65 | 0 | No, P = 0.53 | 0.59 | 0.06 | No, P = 0.09 | 0.22 | 0 | Yes, P < 0.02 |
| Body length (lengthb) | 9.89 | 0.22 | 9.99 | 0.4 | No, P = 0.53 | 10 | 0.51 | No, P = 0.40 | 9.32 | 0.9 | Yes, P < 0.05 |
| Gut melanocytes | 48 | 5 | 68 | 11 | Yes, P < 0.02 | n/a | n/a | n/a | n/a | n/a | n/a |
| Tail melanocytes | 20 | 4 | 34 | 4 | Yes, P < 0.03 | n/a | n/a | n/a | n/a | n/a | n/a |
Embryos were exposed to drug continuously from gastrulation until Stage 45. All length and width measurements are in mm, and melanocyte counts represent number of cells within defined areas (as explained in Fig. S1). Melanocytes of 33 and 50 μm embryos were unable to contract sufficiently under tricaine anesthesia, making them impossible to quantify. Measurements of riluzole‐treated embryos were compared with those of controls using a two‐tailed Mann–Whitney U‐test. Statistically significant p values are in bold type.
IQR, interquartile range; med., median.
Unlike hyperpigmentation, all other classes of defect increased in a dose‐dependent manner (Fig. 1b). Edema, while not present in controls, was observed in 26% of embryos treated with 5 μm riluzole. All embryos at the 33 and 50 μm doses exhibited pronounced pericardial edema as well as swelling of the face. Miscoiling of the gut, which is normally arranged in a spiral pattern, also became more frequent as riluzole dose increased. While only a small percentage (1–3%) of control and 5 μm embryos developed miscoiled guts, this defect was present in 70% of embryos treated with 33 μm riluzole and 100% of embryos treated with 50 μm riluzole. In addition, staining with skeletal muscle antibody 12/101 (Fig. 1a; Kintner & Brockes, 1984) demonstrated that occurrence of muscle defects increased in a dose‐dependent manner. Disorganization of hypaxial muscles lining the gut was only observed in 7.4% of control embryos (n = 27), while this defect was present in 21.1% of 5 μm embryos (n = 19), all 33 μm embryos (n = 26) and 96.6% of 50 μm embryos (n = 29). Similarly, disruptions in the continuity of the interhyoideus muscle of the lower jaw were observed in only 3.7% of control embryos, while this defect was present in 5.3% of 5 μm embryos, 11.5% of 33 μm embryos and 34.5% of 50 μm embryos.
Craniofacial anomalies were yet another class of defects that varied according to dose of riluzole. Quantification of craniofacial dimensions and Alcian blue staining reveal that the facial morphology of embryos exposed to 5 μm riluzole was indistinguishable from that of controls (Fig. 1a; Table 1). However, embryos treated with 33 μm had significantly squatter heads (Fig. 1a; Table 1). This is evident in the shape of their craniofacial skeletons and confirmed by their shorter head lengths (P < 0.02), as well as their smaller head length : head width (P < 0.02) and head length : body length ratios (P < 0.02). All embryos treated with 50 μm had a similar but more severe craniofacial morphology (Fig. 1a; Table 1). Heads of 50 μm embryos were significantly smaller than controls in both length (P < 0.02) and width (P < 0.02). Their smaller head length : head width ratios (P = 0.09) indicate that they were also noticeably squatter in shape. Although the bodies of 50 μm embryos were significantly shorter than those of controls (P < 0.05), their head length : body length ratios (P < 0.02) were also significantly smaller, showing that their heads were, in fact, specifically compressed on the A–P axis.
In addition to changes in facial shape and size, 76% of embryos treated with 50 μm riluzole had a RPE defect characterized by the thickening and pigmentation of connections between the eye and brain (Fig. 1b). This same defect was never observed at frequencies over 4% in control embryos or embryos treated with lower doses of drug. Quantification of eye ratio (distance between eyes relative to maximum head width) confirmed that the RPE of embryos exposed to 50 μm riluzole extended significantly closer to the midline than that of controls (Table 1; P < 0.02).
Norketamine altered patterning of the tail or eye, depending on treatment start time
Norketamine is a dissociative anesthetic and N‐methyl‐d‐aspartate (NMDA) non‐competitive inhibitor (Ebert et al. 1997b). Embryos were continuously exposed to norketamine, starting at either cleavage (early exposure) or gastrulation (late exposure; Fig. 2a). Embryos exposed to 100 μm norketamine starting at gastrulation developed defects at a significantly higher frequency than controls (P < 0.01). The most common defect observed in these late‐exposure embryos was a truncated tail on a rounded fin (Fig. 3b). This defect was present in 45% of drug‐treated embryos, but was not observed at all in controls. There was no significant difference in the occurrence of eye defects between controls and late exposure embryos.
Figure 2.

Late norketamine exposure disrupted patterning of the tail, while early exposure caused eye defects. (a) Embryos were continuously exposed to norketamine until Stage 45. All scale bars represent 1 mm. The early exposure began during cleavage (2 cell–4 cell), while the late exposure started at gastrulation (Stages 10–11). Both exposures began before the end of neurulation (~Stage 20), at which point the eye vesicle evaginates. Only the early exposure, however, lead to the development of eye defects. (b) Early‐exposure embryos (shown at Stage 45) developed a truncated tail with a rounded fin. (c) Classes of eye phenotypes observed in Stage 45 embryos treated with early norketamine exposure. Embryos scored in the ‘other’ category either had a combination of two types of defect [i.e. one eye missing and one eye with retinal pigment epithelium (RPE) defects], or defects that did not fit neatly into any of the defect categories previously mentioned (i.e. undersized eyes). Eye defects are marked with green arrows. (i) Embryo with normal eye development. (ii) Cyclops embryo. (iii) Embryo with pigmented optic nerves. (iv) Embryo with thickening and pigmentation of connections between the eyes and brain. (v) Embryo missing right eye. (vi) Embryo missing both eyes. (vii, viii) Embryos with one misshapen eye and one undersized eye. (d) Percentages of control and norketamine‐treated embryos that developed different types of eye defects. All classes of eye phenotypes are mutually exclusive.
Figure 3.

BAY 36‐7620 disrupted patterning of the head, eye, gut and tail axis. Embryos were continuously exposed to 27 or 40 μm of BAY 36‐7620 (BAY) from gastrulation (Stages 10–11) to Stage 45. All scale bars represent 1 mm. (a) Representative tail, craniofacial, retinal pigment epithelium (RPE) and gut defects observed in Stage 45 BAY‐treated embryos. (i, ii, iii) Normally developed tail, head and gut. Embryos treated with 27 μm BAY developed different permutations of tail, head, eye and gut anomalies. (vi) Curved tail. (vii) Square‐shaped head compressed on anterior–posterior (AP) axis with pigmented optic nerves. (viii) Miscoiled gut. All embryos treated with 40 μm BAY developed curved tails (xi), microcephaly (xii) and uncoiled guts (xiii). All gut defects are marked with yellow arrows, and eye defects are marked with green arrows. (iv, ix) Ventral views of Stage 45 control and 27 μm BAY embryos stained with the skeletal muscle antibody 12/101. In the control embryo, interhyoideus (ih) and hypaxial (h) muscles are labeled. (ix) Muscular phenotype of 27 μm BAY phenotype in which there is weak staining specifically in the craniofacial muscles. (xiv) Profile view of Stage 45 40 μm BAY embryos (at 1.5 × the magnification of iv and ix) stained with 12/101. The head as well as anatomical features such as the cement gland (cg) and eye (e) are labeled. (v, x, xi) Ventral views of Stage 45 control and BAY‐treated embryos stained with Alcian blue. In the control embryo, Meckel's cartilage (m), the ceratohyal cartilage (ch) and branchial arches are labeled. (b) Percentages of control and BAY‐treated embryos that developed tail, craniofacial, RPE and gut defects. Categories are not mutually exclusive, as many embryos developed at least two types of defects.
Embryos treated with either 100 μm (n = 94) or 200 μm (n = 71) norketamine during cleavage developed eye defects (n = 87, P < 0.01 for all doses). The eye defects observed in norketamine‐treated embryos could be divided into four different and mutually exclusive categories. The first was cyclopia, or the fusion of both eyes in the center of the head to form one large eye. The second included defects of the RPE, such as pigmentation of the optic nerves, or thickening and pigmentation of the connection between the eye and brain. The third category consisted of embryos missing either one or both eyes. The final category contained embryos with ocular defects that could not fit easily into the previous three groups. These included embryos with defects such as undersized or generally misshapen eyes, as well as embryos possessing two different defects simultaneously (Fig. 2c).
Both RPE and other defects were present at small percentages (< 3%) in control embryos, and increased in a dose‐dependent manner (Fig. 2d). While only 2.3% of control embryos (n = 87) developed abnormal RPE, this class of defects was observed in 26% of embryos treated with 100 μm and 30% of embryos treated with 200 μm. Similarly, only 1% of control embryos developed defects that fell into the ‘other’ category, while such defects were present in 6.4% and 11% of the 100 and 200 μm norketamine treatment groups, respectively. Cyclopia and missing eyes were not observed at all in controls. Cyclopia, however, was observed in 2% of embryos treated with 100 μm norketamine and 21% of embryos treated with 200 μm. Interestingly, missing eyes were observed in 11% of embryos treated with 100 μm norketamine, but were not observed at all at 200 μm (Fig. 2d).
Treatment with BAY 36‐7620 induced abnormal patterning of the head, gut and tail
BAY 36‐7620 (BAY) is a potent, non‐competitive antagonist of the mGlu1 receptor (Carroll et al. 2001). Embryos treated with BAY from gastrulation until Stage 45 developed craniofacial, gut and tail defects that increased in both penetrance and severity according to the dose administered (Fig. 2). At both 27 µm (n = 57) and 40 μm (n = 58), the occurrence of developmental abnormalities was significantly higher than in control (n = 56) embryos (P < 0.01).
Embryos treated with 27 μm BAY developed permutations of four different developmental abnormalities that were apparent via gross morphological observation: a curved tail; a compressed, rectangular head; pigmented optic nerves (RPE defects); and a miscoiled gut (Fig. 3a). While the craniofacial, gut and RPE defects did occur in control embryos, they occurred at notably higher frequencies in BAY‐treated embryos (Fig. 3b). Miscoiled guts were only present in 5% of control embryos, but were observed in 18% of embryos administered 27 μm BAY. Similarly, one‐third of BAY‐treated embryos had pigmented optic nerves, while RPE abnormalities were only seen in < 5% of controls. Calculation of eye ratio revealed that the RPE of BAY embryos did indeed extend closer to the midline than that of controls (Table 2; P < 0.02). Most remarkably, only 2% of control embryos developed misshapen faces, while craniofacial abnormalities were observed in 46% of embryos treated with BAY. Alcian blue staining showed that the craniofacial skeletons of BAY embryos were notably reduced in size (Fig. 3a). Quantification of craniofacial dimensions confirmed that the heads of 27 μm embryos were significantly smaller than those of controls in terms of both length (P < 0.02) and width (P < 0.02). In addition, their smaller length : width ratios (P < 0.05) reveal that they were significantly squatter in shape, while the smaller head length : body length ratios (P < 0.02) show that they were specifically compressed on the A–P axis (Table 2). Interestingly, 23% of BAY‐treated embryos developed tails that curved along the dorso‐ventral axis, a defect that was not observed at all in controls (Fig. 3b). Calculation of string length : straight length (curvature) ratios confirmed that the bodies of BAY embryos were indeed significantly more curved than those of controls (Table 2; P < 0.05).
Table 2.
Median and interquartile range for measurements of head dimensions, body length and body curvature in control and BAY 36‐7620 (BAY)‐treated Stage 45 embryos
| CTRL n = 5 | BAY 27 μm n = 5 | BAY 40 μm n = 5 | ||||||
|---|---|---|---|---|---|---|---|---|
| Median | IQR | Median | IQR | Significant? | Median | IQR | Significant? | |
| Head length (lengthh) | 2.62 | 0.07 | 2.08 | 0.12 | Yes, P < 0.02 | 1.47 | 0.07 | Yes, P < 0.02 |
| Head width (widthh) | 3.28 | 0.03 | 2.98 | 0.04 | Yes, P < 0.02 | 2.1 | 0.48 | Yes, P < 0.02 |
| Lengthh/widthh | 0.81 | 0.04 | 0.71 | 0.07 | Yes, P < 0.05 | 0.73 | 0.12 | No, P = 0.4 |
| Lengthh/lengthbs | 0.25 | 0.03 | 0.20 | 0.01 | Yes, P < 0.02 | 0.17 | 0.01 | Yes, P < 0.02 |
| Eye ratio | 0.63 | 0.02 | 0.18 | 0.03 | Yes, P < 0.02 | n/a | n/a | n/a |
| Body length string (lengthbs) | 10.21 | 0.19 | 10.08 | 0.44 | No, P = 0.53 | 8.88 | 0.52 | Yes, P < 0.02 |
| Curvature ratio | 1.00 | 0.01 | 1.02 | 0.08 | Yes, P < 0.05 | 1.06 | 0.04 | Yes, P < 0.02 |
Embryos were exposed to drug continuously from gastrulation until Stage 45. All length and width measurements are in mm, and body curvature represents the ratio of straight length to string length, as described in Fig. S1. Eye width measurements were not calculated for embryos exposed to 40 μm BAY as not all of them had sufficiently developed eyes. Measurements of BAY‐treated embryos were compared with those of controls using a two‐tailed Mann–Whitney U‐test. Statistically significant p values are in bold type.
IQR, interquartile range.
A combination of different muscular defects was also observed in embryos treated with 27 μm BAY. Disorganized hypaxial muscles were observed in 52.4% of BAY‐treated embryos, and disrupted continuity of the interhyoideus muscle was present in 23.8% of BAY embryos (n = 21). These same defects were only observed in 7.4% and 3.7% of control embryos, respectively (n = 27). Another interesting defect was observed in 23.8% of BAY embryos: normally stained hypaxial muscles but overall dim staining of the craniofacial muscles (Fig. 3a). This defect was not observed in controls.
At 40 μm BAY (n = 58), all embryos developed a unique phenotype consisting of a curved tail, microcephaly and an uncoiled gut (Fig. 3a). No control embryos developed this phenotype. Straight length : string length ratios confirm that the bodies of 40 μm embryos were, in fact, significantly more curved than those of controls (P < 0.02; Table 2). In addition, quantification of head dimensions (Table 2) confirmed that the heads of 40 μm embryos were significantly smaller than those of controls in terms of both length (P < 0.02) and width (P < 0.02). Although the bodies of 40 μm embryos were significantly shorter than those of controls (P < 0.02), their head length : body length ratios revealed that their heads were compressed on the A–P axis (P < 0.02). Alcian blue staining revealed that 40 μm embryos lacked an organized craniofacial skeleton. In addition, hypaxial muscles were reduced and disorganized, and no muscle was present in the heads of these embryos (Fig. 3a; n = 15).
Adrenergic antagonists induced abnormal patterning of the head, gut and skeletal muscles
Propranolol is an antagonist of the β‐adrenergic receptor (Wolter et al. 2014), and nicergoline is an α‐adrenergic antagonist (Alvarez‐Guerra et al. 1999). Embryos treated from gastrulation to Stage 45 with both nicergoline (n = 63, CTRL n = 53) and propranolol (n = 60, CTRL n = 56) developed malformations at a significantly higher frequency than control embryos (P < 0.01 for both drugs). Embryos treated with 100 μm propranolol developed a phenotype that was 100% penetrant, consisting of a miscoiled gut and a rectangular face (Fig. 4b,e,h). Alcian blue staining of propranolol‐treated embryos revealed that all elements of their cartilaginous craniofacial skeleton were reduced in size compared with that of controls, and that the jaw formed a pointed, triangular shape as opposed to the arched shape of controls (Fig. 4n). Quantification of craniofacial dimensions (Table 3) revealed that the heads of propranolol embryos were significantly shorter (P < 0.02) and narrower (P < 0.02) than those of controls. Although they had the same head length : head width proportions (P = 1) as controls, the anterior projection of their noses relative to head length is significantly smaller than that of controls (P < 0.02). In addition, while the bodies of propranolol‐exposed embryos are significantly shorter than those of controls (P < 0.02), their head length : body length ratios are also notably smaller (P = 0.09), suggesting that the heads of propranolol embryos are somewhat compressed on the A–P axis (Table 3).
Figure 4.

Embryos treated with adrenergic antagonists developed craniofacial and gut abnormalities. Embryos were continuously exposed to 100 μm propranolol or 33 μm nicergoline from gastrulation (Stages 10–11) to Stage 45. All scale bars represent 1 mm. (a, d, g) Profile, gut and head of normally developed Stage 45 embryo. (b, e, h) Profile, gut and head of hyperpigmented Stage 45 embryo treated with propranolol. Increased melanocyte coverage of the gut, and arborized melanocyte invasion of the tail and peripheral head regions are marked with red arrows. (e) Miscoiled gut of propranolol‐treated embryo, marked with yellow arrow. (h) Rectangular head of propranolol‐treated embryo with eye defects and indentation between the nostrils. Subtle pointing of the inner edge of the eye is marked with green arrows. (c, f, i) Profile, head and gut of Stage 45 nicergoline‐treated embryo. (f) Miscoiled gut of nicergoline‐treated embryo, marked with yellow arrow. (i) Square‐shaped head of nicergoline‐treated embryo with eye defects and indentation between the nostrils. Pigmentation and thickening of the eye–brain connection are marked with green arrows. (j–l) Ventral view of control and drug‐treated Stage 45 embryos stained with skeletal muscle antibody 12/101. Interhyoideus (ih) and hypaxial (h) muscles are labeled on control embryo. Partial discontinuity at the midline of the interhyoideus and disorganization of the hypaxial muscle are both labeled with white arrows in drug‐treated embryos. (m–o) Ventral view of control and drug‐treated Stage 48 embryos stained with Alcian blue. Meckel's cartilage (m), ceratohyal cartilage (ch) and the branchial arches (ba) are labeled on control embryo.
Table 3.
Median and interquartile range for measurements of head dimensions, body length and melanocyte counts in control and propranolol‐treated Stage 45 embryos
| CTRL n = 5 | Propranolol 100 μm n = 5 | ||||
|---|---|---|---|---|---|
| Median | IQR | Median | IQR | Significant? | |
| Head length (lengthh) | 2.65 | 0.31 | 2.21 | 0.14 | Yes, P < 0.02 |
| Head width (widthh) | 3.32 | 0.12 | 2.91 | 0.17 | Yes, P < 0.02 |
| Lengthh/widthh | 0.8 | 0.06 | 0.80 | 0.07 | No, P = 1 |
| Nose length/lengthh | 0.45 | 0.02 | 0.29 | 0.08 | Yes, P ≤ 0.02 |
| Lengthh/lengthb | 0.28 | 0.04 | 0.25 | 0.02 | No, P = 0.09 |
| Eye ratio | 0.65 | 0.02 | 0.56 | 0.03 | Yes, P < 0.03 |
| Body length (lengthb) | 9.57 | 0.03 | 8.85 | 0.02 | Yes, P < 0.02 |
| Gut melanocytes | 51 | 18 | 76 | 2 | Yes, P < 0.05 |
| Tail melanocytes | 21 | 7 | 34 | 9 | Yes, P < 0.02 |
Embryos were exposed to drug continuously from gastrulation until Stage 45. All length and width measurements are in mm, and melanocyte counts represent number of cells within defined areas (as explained in Fig. S1). Measurements of propranolol‐treated embryos were compared with those of controls using a two‐tailed Mann–Whitney U test. Statistically significant p values are in bold type.
IQR, interquartile range.
In addition, 90% of propranolol‐treated embryos were hyperpigmented, with abnormally arborized melanocytes darkening the gut, tail and peripheral regions of the head (Fig. 4b,h). Quantification of gut (P < 0.05) and tail (P < 0.02) melanocytes indicated that propranolol‐exposed embryos had significantly larger melanocyte populations in these body areas than controls (Table 3). In addition, 50% of embryos developed an RPE defect in which the inner side of the eye was subtly pointed (Fig. 4h). Calculation of the eye ratio revealed that the RPE of propranolol embryos did indeed extend significantly closer to the midline than that of controls (P < 0.03; Table 3). Gut and RPE defects occurred in < 4% of control embryos, while hyperpigmentation and craniofacial abnormalities were not observed at all.
Immunostaining with the skeletal muscle antibody 12/101 (Kintner & Brockes, 1984) revealed that propranolol treatment also induced abnormal muscle patterning (Fig. 4k). Notably, all propranolol‐treated embryos (n = 33) had severe disorganization of the hypaxial muscles surrounding the gut. In addition, continuity of the interhyoideus muscle across the lower jaw was disrupted in ~24% of propranolol‐treated embryos. While all control embryos (n = 30) had perfectly continuous interhyoideus muscles, partial and complete disconnects were observed at the midline of the interhyoideus muscle in 18% and 6% of propranolol‐treated embryos, respectively.
Embryos treated with 33 μm nicergoline developed a similar phenotype to those treated with propranolol, with the exception of hyperpigmentation, which was not observed (Fig. 4c,f,i). All nicergoline‐treated embryos had miscoiled guts and 95% developed small, square‐shaped heads. Alcian blue staining revealed that the craniofacial skeleton of nicergoline‐treated embryos was quite similar to that observed in embryos treated with propranolol. Similarly, all face cartilages were reduced in size, and the jaw formed an abnormally pointed shape (Fig. 4o). Quantification of craniofacial dimensions confirmed that the heads of nicergoline‐treated embryos were significantly shorter (P < 0.02) and narrower (P < 0.02) than those of controls. Although the bodies of nicergoline embryos were significantly shorter (P < 0.02) than those of controls, they had the same head length to body length proportions. The faces of nicergoline embryos, however, differed in shape from control embryos. For example, the head length to width ratio of nicergoline embryos was notably closer to 1 : 1, showing that their heads were indeed squarer in shape. In addition, anterior protrusion of the nose relative to head length was significantly smaller than that of controls, as seen in propranolol embryos (P < 0.02; Table 4). RPE defects were also observed in 59% of nicergoline‐treated embryos, and eye ratio (P < 0.02) was significantly smaller than that of controls (Fig. 4i; Table 4). Miscoiled gut, abnormal face morphology and RPE defects were only observed in 3.8%, 5.7% and 3.8% of control embryos, respectively. As with propranolol, nicergoline treatment induced defects of the hypaxial and interhyoideus muscles, which were not observed in controls (n = 30). All nicergoline‐treated embryos (n = 27) developed disorganized hypaxial muscles, and partial and full disruptions at the midline of the interhyoideus muscle were observed in 48% and 15% of embryos, respectively (Fig. 4l).
Table 4.
Median and interquartile range for measurements of head dimensions and body length in control and nicergoline‐treated Stage 45 embryos
| CTRL n = 5 | Nicergoline 33 μm n = 5 | ||||
|---|---|---|---|---|---|
| Median | IQR | Median | IQR | Significant? | |
| Head length (lengthh) | 2.43 | 0.05 | 1.87 | 0.2 | Yes, P < 0.02 |
| Head width (widthh) | 3.09 | 0.13 | 2.29 | 0.08 | Yes, P < 0.02 |
| Lengthh/widthh | 0.78 | 0.04 | 0.91 | 0.1 | No, P = 0.06 |
| Nose length/lengthh | 0.47 | 0.02 | 0.36 | 0.04 | Yes, P < 0.02 |
| Lengthh/lengthb | 0.25 | 0.01 | 0.27 | 0.03 | No, P = 0.21 |
| Eye ratio | 0.59 | 0.03 | 0.35 | 0.04 | Yes, P < 0.02 |
| Body length (lengthb) | 9.29 | 0.61 | 7.07 | 0.46 | Yes, P < 0.02 |
Embryos were exposed to drug continuously from gastrulation until Stage 45. All length and width measurements are in mm. Measurements of nicergoline‐treated embryos were compared with those of controls using a two‐tailed Mann–Whitney U‐test. Statistically significant p values are in bold type.
IQR, interquartile range.
Embryos treated with cimaterol developed a variety of craniofacial malformations
Cimaterol acts as an agonist at the β‐adrenergic receptor (Smith, 1998). The occurrence of developmental defects in embryos treated (exposure from gastrulation to Stage 45) with 500 μm cimaterol (n = 59) was significantly more frequent than that of controls (n = 53, P < 0.01). Ninety‐five percent of cimaterol‐treated embryos had misshapen mouths, which were shorter in length and rounder than properly developed mouths. In addition, one can observe from a ventral view that the mouth opening of drug‐treated embryos extended in the posterior direction by about 60% of their mouth length (Fig. 5a). Although 5.6% of control embryos had some form of craniofacial anomaly, only 1.8% had the specific mouth shape observed in cimaterol‐treated embryos. In addition to abnormally shaped mouths, 33% of cimaterol‐treated embryos developed a proboscis‐like projection between their nostrils, which gave their heads a pointed shape (Fig. 5b). This phenotype was not observed at all in control embryos. Craniofacial dimensions of cimaterol embryos also differed from those of controls. Heads of cimaterol embryos were significantly narrower (P < 0.05) and shorter (P < 0.02). In addition, their head length : head width ratio (P = 0.06) was notably smaller, as was the anterior extension of their nose relative to their head length (P = 0.06). Although the bodies of cimaterol embryos were significantly shorter than those of controls (P < 0.03), their heads were specifically compressed on the A–P axis, as evidenced by their significantly smaller head length : body length ratio (P < 0.05; Table 5).
Figure 5.

Cimaterol disrupted the patterning of numerous craniofacial features. Embryos were continuously exposed to 500 μm cimaterol from gastrulation (Stages 10–11) to Stage 45. All scale bars represent 1 mm. (a) Mouth and jaw anomalies observed in cimaterol‐treated embryos. (i, ii) Frontal views of Stage 45 control and drug‐treated embryo faces. The mouth is outlined with a dotted white line. (iii, iv) Ventral views of Stage 45 control and drug‐treated embryos. An abnormally shaped mouth is visible in the ventral view of the cimaterol‐treated embryo and is indicated with a pink arrow. (v, vi) Ventral view of Stage 45 control and drug‐treated embryos stained with skeletal muscle antibody 12/101. Levator mandibulae muscles are labeled ‘lm’ and interhyoideus muscles are labeled ‘ih’. The vertical white line represents the distance that the levator mandibulae muscles protrude anteriorly from the interhyoideus. Branches in the branchial arch muscles are labeled with blue arrows. (vii, viii) Ventral view of Stage 48 control and drug‐treated embryos stained with Alcian blue. The jaw is labeled ‘j’. (b) Proboscis‐like protruding between the nostrils observed in cimaterol‐treated embryos. (i, ii) Profile view of control and drug‐treated embryo faces. (iii, iv) Ventral view of control and drug‐treated embryos. The proboscis is labeled with purple arrows. (v, vi) Ventral view of control and drug‐treated Stage 45 embryos stained with skeletal muscle antibody 12/101. The curvature of the posterior edge of the interhyoideus muscle (ih) is traced with a dotted line. (vii, viii) Dorsal view of Stage 48 control and drug‐treated embryos stained with Alcian blue. The ethmoidal plate is labeled ‘ep’ and the jaw is labeled ‘j’.
Table 5.
Median and interquartile range for measurements of head dimensions and body length in control and cimaterol‐treated Stage 45 embryos
| CTRL n = 5 | Cimaterol 500 μm n = 5 | ||||
|---|---|---|---|---|---|
| Median | IQR | Median | IQR | Significant? | |
| Head length (lengthh) | 2.74 | 0.03 | 2.45 | 0.02 | Yes, P < 0.02 |
| Head width (widthh) | 3.39 | 0.03 | 3.18 | 0.17 | Yes, P < 0.05 |
| Lengthh/widthh | 0.81 | 0.01 | 0.78 | 0.03 | No, P = 0.06 |
| Nose length/lengthh | 0.43 | 0.01 | 0.40 | 0.02 | No, P = 0.06 |
| Lengthh/lengthb | 0.27 | 0.01 | 0.26 | 0.01 | Yes, P < 0.05 |
| Eye ratio | 0.64 | 0.01 | 0.63 | 0.02 | No, P = 0.14 |
| Body length (lengthb) | 10.11 | 0.08 | 9.39 | 0.36 | Yes P < 0.03 |
Embryos were exposed to drug continuously from gastrulation until Stage 45. All length and width measurements are in mm. Measurements of cimaterol‐treated embryos were compared with those of controls using a two‐tailed Mann–Whitney U‐test. Statistically significant p values in bold type.
IQR, interquartile range.
Alcian blue staining shows that cimaterol treatment altered the shape and arrangement of the cartilaginous craniofacial skeleton, especially the nasal and jaw cartilages. In embryos that developed the ‘proboscis’ nose, the ethmoidal plate was longer on the anterior–posterior axis and the lower jaw appeared to be absent (Fig. 5b). Embryos with malformed mouths but no ‘proboscis’ had misshapen jaws that were indented or punched‐in when compared with the arch‐like shape of normal jaws (Fig. 5a). Immunostaining with 12/101 revealed that cimaterol treatment also altered patterning of mandibular and branchial arch muscles. Embryos with the proboscis nose had interhyoideus muscles that curved in a sharper inverted ‘U’ shape than those of controls, likely to accommodate for these embryos’ more pointed head shape (Fig. 5b). Embryos with malformed mouths and no proboscis also displayed a unique jaw muscle phenotype. In these individuals, the levator mandibulae muscles were located at the same position as the interhyoideus muscle on the anterior–posterior axis (Fig. 5a). In control embryos, the levator mandibulae muscles extend anteriorly beyond the interhyoideus by about a third of a millimeter. In addition, cimaterol treatment induced branching of the branchial arch muscles, which are normally linear structures (Fig. 5a). This phenotype was observed in 60% of cimaterol‐treated embryos (n = 30), but was only seen in 3% of control embryos (n = 30).
Treatment with SCH 23390 induced abnormal patterning of the head and gut
SCH 23390 (SCH) acts as an antagonist at the dopaminergic D1‐like (D1/D5) receptors (Szulczyk et al. 2012). Embryos treated with both 50 μm (n = 61) and 100 μm (n = 65) SCH developed malformations at a significantly higher frequency than control embryos (n = 58, P < 0.01). All embryos treated with 50 μm SCH developed a rectangular head morphology resembling a muted version of that seen in embryos treated with adrenergic antagonists (Fig. 6h). Alcian blue staining revealed that craniofacial skeletal elements such as the branchial arches, mandibular cartilages and ceratohyal cartilage were reduced in size compared with those of controls (Fig. 6n). Quantification of craniofacial dimensions revealed that the heads of SCH embryos were significantly squatter than those of controls, as evidenced by their shorter length (P < 0.02) and smaller head length : head width ratio (P < 0.02). In addition, these heads were specifically compressed on the A–P axis, as evidenced by their significantly smaller head length : body length ratio (P ≤ 0.02). The anterior protrusion of the nose relative to head length (P < 0.02) and the distance between the eyes relative to maximum head width were also significantly smaller than those of controls (Table 6; P < 0.02). In addition, 26% of embryos treated with 50 μm SCH developed miscoiled guts (Fig. 6e). Both the rectangular‐headed phenotype and miscoiled guts were only observed in 2% of control embryos. Staining with skeletal muscle antibody 12/101 showed that all embryos also developed disorganized hypaxial muscles (Fig. 6k).
Figure 6.
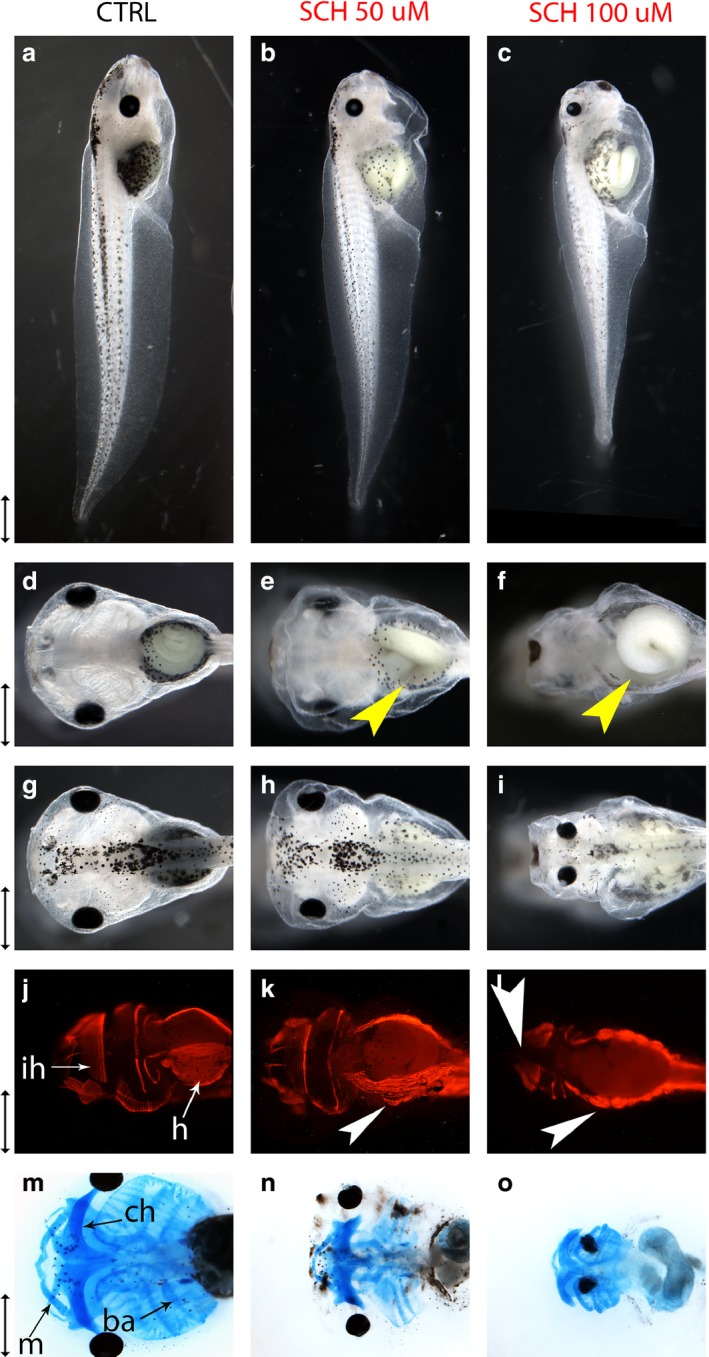
SCH23390‐induced mispatterning of the head and gut. Embryos were continuously exposed to 50 or 100 μm SCH23390 (SCH) from gastrulation (Stages 10–11) to Stage 45. All scale bars represent 1 mm. (a–c) Profile views of control and SCH‐treated embryos at Stage 45. (d–f) Ventral views of control and SCH‐treated embryos. Miscoiled guts are labeled with yellow arrows. (g–i) Dorsal views of control and SCH‐treated embryos. (j–l) Ventral view of control and drug‐treated embryos at Stage 45, stained with muscle antibody 12/101. The interhyoideus muscle of the lower jaw is labeled ‘ih’ and the hypaxial muscles of the gut are labeled ‘ha’ in control embryo. Disruptions of the interhyoideus and disorganization of the hypaxial muscles are labeled with white arrows in drug‐treated embryos. (m–o) Ventral views of Stage 48 control and SCH‐treated embryos stained with Alcian blue. In the control embryo, branchial arches are labeled ‘ba’, Meckel's cartilage is labeled ‘m’ and ceratohyal cartilage is labeled ‘ch’.
Table 6.
Median and interquartile range for measurements of head dimensions and body length in control and SCH 23390‐treated Stage 45 embryos
| CTRL | SCH 23390 50 μm | SCH 23390 100 μm | ||||||
|---|---|---|---|---|---|---|---|---|
| Median | IQR | Median | IQR | Significant? | Median | IQR | Significant? | |
| Head length (lengthh) | 2.74 | 0.03 | 2.33 | 0.04 | Yes, P < 0.02 | 2.03 | 0.27 | Yes, P < 0.02 |
| Head width (widthh) | 3.15 | 0.01 | 3.37 | 0.20 | No, P = 0.17 | 2.44 | 0.53 | Yes, P < 0.02 |
| Lengthh/widthh | 0.87 | 0.01 | 0.71 | 0.04 | Yes, P < 0.02 | 0.87 | 0.11 | No, P = 1 |
| Nose length/lengthh | 0.42 | 0.01 | 0.38 | 0.02 | Yes, P < 0.02 | 0.35 | 0.05 | Yes, P < 0.02 |
| Lengthh/lengthb | 0.27 | 0.01 | 0.24 | 0.01 | Yes, P < 0.02 | 0.24 | 0.02 | Yes, P < 0.02 |
| Eye ratio | 0.64 | 0.01 | 0.6 | 0.01 | Yes, P < 0.02 | 0.38 | 0.05 | Yes, P < 0.02 |
| Body length (lengthb) | 9.96 | 0.17 | 9.82 | 0.1 | No, P = 0.14 | 8.83 | 1.01 | Yes, P < 0.02 |
Embryos were exposed to drug continuously from gastrulation until Stage 45. All length and width measurements are in mm. Measurements of SCH 23390‐treated embryos were compared with those of controls using a two‐tailed Mann–Whitney U‐test.
IQR, interquartile range. Statistically significant p values are in bold type.
All embryos treated with 100 μm SCH developed a phenotype that was not observed in controls: a miscoiled gut, visibly reduced body size and microcephaly (Fig. 6c,f,i). Quantification of craniofacial dimensions confirmed (Table 6) that the heads of 100 μm embryos were smaller in both length (P < 0.02) and width (P < 0.02) than those of controls. Even though 100 μm embryos had significantly shorter bodies (P < 0.02), their head length : body length ratio (P < 0.02) was significantly shorter than that of controls, indicating that the head was specifically compressed on the A–P axis. The anterior projection of the nose relative to head length was also significantly smaller than that of controls (P < 0.02). These findings are in accordance with Alcian blue staining, which showed that the craniofacial skeletons of embryos treated with 100 μm SCH were markedly reduced in size (Fig. 6o). In addition, the eyes of 100 μm embryos were quite inset in the head, as the distance between the eyes relative to maximum head width was significantly smaller than that of controls (Table 6; P < 0.02). Craniofacial muscles were also mispatterned, as 37% and 59% of embryos treated with 100 μm SCH displayed partial and full disruptions, respectively, across the midline of their interhyoideus muscle (n = 27). In addition, all embryos developed disorganized hypaxial muscles (Fig. 6l). Neither hypaxial nor interhyoideus muscle defects were observed in controls (n = 30).
Discussion
Neurotransmitters are typically studied within the context of the CNS, where they modulate neuronal activity and mediate the conversion of specific spiking regimes to transcriptional and epigenetic changes. However, classical neurotransmitters also act as instructive chemical signals that guide cell behavior during embryonic development. This is not entirely unsurprising, as a number of developmental events are likely driven by changes in resting potential (Levin, 2012, 2014; Tseng & Levin, 2013). The movement of serotonin and subsequent serotonergic signaling as a function of cell resting potential is known to transduce bioelectrical gradients into cascades of gene expression (Fukumoto et al. 2005b; Levin et al. 2006; Blackiston et al. 2015), and it is tempting to speculate that neurotransmitters could play a conserved role as a layer of chemical signaling mediating between endogenous bioelectric gradients and downstream transcriptional cascades that regulate cell behavior and thus anatomy.
Several families of neurotransmitter are known to participate in the early development (i.e. cleavage and gastrulation) of invertebrates such as the sea urchin (Levin et al. 2006; Buznikov et al. 2008) and Drosophila (Colas et al. 1999a,b). In vertebrates, several developmental roles for serotonin have been outlined, most notably craniofacial development (Reisoli et al. 2010) and patterning of the left–right axis (Fukumoto et al. 2005a,b; Carneiro et al. 2011; Beyer et al. 2012; Vandenberg et al. 2012, 2014). However, the developmental roles of other neurotransmitter families in the vertebrate embryo are relatively unknown. To begin to characterize the possible patterning roles of other neurotransmitter groups, an investigatory pharmacological screen was conducted in Xenopus laevis embryos, using compounds targeting the glutamatergic, adrenergic and dopaminergic pathways. Compounds modulating each of these pathways were capable of inducing a variety of craniofacial, eye, muscle and pigmentation abnormalities.
Glutamatergic drugs
To test possible roles for glutamate neurotransmission in development, the glutamatergic pathway was probed in three different ways: inhibiting glutamate release with riluzole; antagonizing the NMDA receptor with norketamine; and antagonism of mGlu receptors with BAY 36‐7620 (BAY). All three compounds induced craniofacial defects, implicating the glutamatergic system in craniofacial development. This is consistent with studies showing that misregulation of mGlu1 receptor signaling is implicated in the pathology of Fragile X syndrome, a developmental disorder characterized by craniofacial deformities as well as aberrant synapse morphology and mental retardation (Tucker et al. 2006). Likewise, the ability of norketamine to induce cyclopia and other eye defects is in accordance with many clinical and toxicological studies on other drugs acting at the NMDA receptor. In mouse embryonic stem cell embryoid bodies, norketamine's parent compound ketamine impaired differentiation of the neuroectoderm, from which neural crest and retina are derived. In addition, ketamine downregulated Otx2, which is necessary for RPE development (Beby & Lamonerie, 2013; Akeju et al. 2014). Like ketamine, ethanol also works primarily through NMDA receptors (Silvestre de Ferron et al. 2015), and fetal alcohol syndrome is associated with craniofacial and ocular abnormalities in humans. Ethanol treatment has also been shown to induce eye defects in a variety of animals, including cyclopia in zebrafish (Blader & Strahle, 1998; Tufan et al. 2007; Yelin et al. 2007).
It was unexpected that riluzole treatment induced hyperpigmentation. As riluzole inhibits glutamate release, it should decrease the amount of signaling occurring at mGlu1 receptor. In mouse and human, mGlu1 receptor hyperactivity is one possible mechanism of oncogenic transformation of melanocytes into melanoma, and both riluzole and mGlu1 antagonist BAY reduce melanoma proliferation and invasion (Teh & Chen, 2012). The effect observed here was in the opposite direction. In Xenopus, hyperpigmentation results from over‐proliferation of melanocytes and invasion into inappropriate (ectopic) areas, not involving a cell fate switch of other cell types into melanocytes or excess melanin production per cell (Blackiston et al. 2011; Lobikin et al. 2015). The increased number of melanocytes in treated embryos confirms that here, as in prior studies, hyperpigmentation is due to excess cells, not explainable by excess pigment production per cell. In this study, changes in cell fate cannot be ruled out, although the melanocyte phenotype was extremely similar to that previously described for disruption of serotonergic signaling (Blackiston et al. 2011; Lobikin et al. 2012, 2015), including the induction of 1.5‐ to twofold excess melanocytes in ectopic locations and their abnormally arborized morphology. It is possible that riluzole's GABA‐ergic activity was responsible for the hyperpigmentation phenotype. Riluzole increases GABA‐ergic signaling by inhibiting GABA uptake. GABAA is an ion channel, whose depolarizing activity in frog embryos would be similar to the glycine‐gated chloride channel that readily induces melanocyte conversion (Blackiston et al. 2011); consistent with this, it has been observed that treatment with the GABAA agonist muscimol induces the same type of hyperpigmentation in Xenopus embryos (data not shown).
Catecholamines
Drugs targeting both the adrenergic and dopaminergic pathways were screened. The α‐adrenoreceptor (α‐AR) was antagonized with nicergoline, the β‐adrenoreceptor (β‐AR) antagonized with propranolol, and the β‐AR agonized with cimaterol. Finally, the dopaminergic D1‐receptor was antagonized with SCH 23390. Both adrenergic antagonists induced the development of square‐shaped heads with undersized craniofacial skeletons, while the agonist caused deformities of the jaw and nasal cartilages. These results are consistent with mammalian studies implicating adrenergic signaling in craniofacial development. In the mouse, α2A‐AR mRNA is expressed in the maxillary and hyoid arch at 10.5–13.5 days post coitum. In addition, the mRNA can be found in the nasal cavity, where its expression pattern changes spatially and temporally to correlate with the folding and expansion of the cavity (Wang & Limbird, 1997). Similarly, β‐ARs can be found in fetal palate tissues (Garbarino & Greene, 1984). In addition, biochemical assays show that both adrenaline and noradrenaline are capable of activating the adenylyl cyclase thought to be necessary for palatal fusion (Waterman et al. 1976; Garbarino & Greene, 1984). Adrenergic agonists and antagonists also have been shown to modulate proliferation of mouse embryonic palate mesenchymal cells in vitro (Pisano et al. 1986). As dopamine is also present in the mouse embryonic palate and capable (albeit to a lesser extent than adrenaline and noradrenaline) of activating adenylyl cyclase, it is reasonable that D1‐antagonist SCH 23390 induced craniofacial skeletal defects (Pisano et al. 1986). Interestingly, thioridazine, an antipsychotic with D2‐blocking activity, and A412997, a D4 agonist, were able to induce similar, but subtler craniofacial anomalies (unpublished data). The current results in Xenopus provide in vivo evidence of a phenomenon only described in vitro in mammals: that catecholamines modulate the development of craniofacial cartilages. In addition, the ability of adrenergic antagonists to induce RPE defects, and the ability of both adrenergic and dopaminergic modulators to induce muscle mispatterning, suggest novel roles for catecholamines in development. It was also observed that propranolol was capable of inducing hyperpigmentation. Wnorowski et al. (2015) demonstrated that treatment with a strong β‐agonist was capable of decreasing migration, proliferation and invasiveness of three human melanoma cell lines. This is consistent with the finding that antagonizing the β‐receptor in Xenopus is capable of encouraging a neoplastic‐like phenotype, as was previously shown for serotonergic signaling (Blackiston et al. 2011; Lobikin et al. 2012, 2015).
Each class of phenotype can be induced via multiple pathways
Interestingly, it was difficult to cleanly segregate the different phenotypes based exclusively on the drug family used (Figure 7), although the phenotypes observed here were distinct and discrete patterning abnormalities (not just generalized toxicity, which in Xenopus is recognized by gastrulation defects, open neural tubes, and appearance of necrotic cells and debris during hatching). For example, craniofacial and eye defects could be induced by drugs targeting the α‐AR, β‐AR, D1R, NMDAR and mGlu1R. Gut miscoiling was also induced by a diverse array of drugs targeting the glutamatergic, adrenergic and dopaminergic pathways. Hyperpigmentation was induced by inhibition of glutamate release via riluzole, as well as antagonism of the β‐AR via propranolol. The one exception was tail defects, which were only caused by glutamatergic drugs in the current screen. Truncation of the tail was induced by NMDA antagonist norketamine, while severe curvature of the tail axis was induced by mGlu1 antagonist BAY. A much more exhaustive screen is required to conclusively state whether glutamatergic drugs are more likely to cause tail defects than those targeting other neurotransmitter pathways. The general lack of correlation between target class and resultant phenotype is not entirely surprising. In the brain, complex cognitive functions such as attention, behavioral flexibility and memory are mediated by several different neurotransmitter pathways. In addition, one neurotransmitter pathway can be involved in a diverse array of cognitive functions (Figure 7). Therefore, it makes sense that embryonic developmental events, such as spreading of pigmentation or craniofacial patterning, can be regulated by several different neurotransmitters, and that one type of neurotransmitter can aid in patterning multiple parts of the body. This suggests that the evolution of patterning mechanisms opportunistically utilized specific chemical messengers without much regard for the family to which it belongs.
Figure 7.

Developmental defects can be induced by drugs of varying neurotransmitter targets and clinical/experimental functions. Drugs are grouped according to their clinical and experimental functions, and lines are drawn to their targets, as well as the classes of phenotype they are capable of inducing. Nicergoline and riluzole prevent neuronal death (Caraci et al. 2005; Nagoshi et al. 2015) and age‐related cognitive decline (McArthur et al. 1997; Pereira et al. 2014). Riluzole and propranolol aid fear extinction in animal models (Fitzgerald et al. 2015; Sugiyama et al. 2015), and are being investigated as potential treatments for human anxiety disorders (Pittenger et al. 2008; Nandhra et al. 2013). Propranolol, SCH 23390 and BAY 36‐7620 impede learning and memory in rodents. While no literature exists on the cognitive effects of norketamine, it was listed in both the anxiolytic and learning/memory categories as other non‐competitive NMDA agonists have these properties (Rapanelli et al. 2013; Zhang et al. 2015). Cimaterol is alone in the ‘physiological effects’ category, as it has no known psychoactive effects, but is known to play a role in lean body mass acquisition (Hu et al. 1988).
Novel time points in eye organogenesis
With respect to the finding that norketamine‐treated embryos developed malformed eyes, the timing of effective exposure revealed an unexpected surprise. Embryos whose norketamine treatment started at cleavage developed a host of ocular abnormalities, while those whose treatment began at early gastrulation (Stages 10–11) developed completely normal eyes. This is striking, because the optic vesicle, from which the RPE is derived, does not evaginate from the brain until the period immediately following neurulation (Fuhrmann, 2010). In addition, the eye field is not specified until the time between gastrulation and neurulation (Stage 12.5), at which point all necessary eye field transcription factors are expressed in the anterior neural ectoderm (Zuber et al. 2003). No eye‐relevant events are known to be occurring in the embryo between cleavage and gastrulation, and the lack of phenotypes from slightly later exposure argues that persistence of drug within tissues after the washout cannot explain this effect (i.e. it is not due to exposure of later stages to remnant compound). One possibility is that earlier norketamine treatment interferes with genes acting upstream of eye field specification. However, the lack of overall neural (head specification) disruption hints at a novel, eye‐specific process that occurs prior to the known steps of eye induction that remains to be discovered. This unexpected finding underscores the importance of timing studies in pharmacological screens, and serves as a reminder for developmental toxicology studies that teratogenic effects can be caused by disruption of developmental processes ongoing long before the morphogenesis of a specific targeted organ. Future molecular analysis of the very early processes targeted by norketamine will elucidate this fascinating new element of development.
Implications for teratogenesis
The results of this screen suggest that perturbation of neurotransmission by clinical/recreational drug use is one possible mechanism by which birth defects could be induced. Therefore, this study highlights the need for conducting in‐depth developmental toxicology studies for any neuroactive drug that may be used during pregnancy. Various studies have shown that maternal use of many commonly used drugs regulating neurotransmitter signaling, such as anticonvulsants and selective serotonin reuptake inhibitors, are associated with gross morphological defects as well as behavioral teratogenicity, behavioral and learning defects resulting from abnormal brain development (Salisbury et al. 2009; Hernandez‐Diaz & Levin, 2014; Huybrechts et al. 2014). As observed in the current screen, modulation of glutamatergic and catecholamine pathways has been shown to alter proper development in clinical and mammalian studies. Many anticonvulsants, such as valproic acid, lamotrigine and topiramate have some level of glutamate‐blocking activity. Valproic acid is a well‐established teratogen that causes neural tube defects. Use of both lamotrigine and topiramate during pregnancy is correlated with increased risk of oral clefts in the offspring (Hernandez‐Diaz & Levin, 2014). In addition, ketamine is well known to induce behavioral teratogenicity. In mice, prenatal and neonatal ketamine exposure induces neuronal death, and leads to learning and behavioral defects that last into adulthood (Scallet et al. 2004; Viberg et al. 2008; Dong & Anand, 2013).
Like glutamatergic drugs, many compounds modulating the catecholamine pathways are also capable of inducing developmental malformations. Recreationally used psychostimulants such as cocaine and methamphetamine work by increasing the synaptic levels of monoamines, including noradrenaline and dopamine. Both cocaine and methamphetamine are behavioral teratogens, and mouse studies have shown that prenatal exposure to methamphetamine can induce morphological abnormalities such as cleft lip, eye defects and rib defects (Salisbury et al. 2009). In addition, a meta‐analysis conducted by Yakoob et al. (2013) found that maternal use of beta blockers, including propranolol, is correlated with the occurrence of organ‐specific malformations in the offspring, including cardiac defects, neural tube defects and cleft palate.
Future directions
This screen implicates glutamatergic, adrenergic and dopaminergic signaling as important regulators of several different aspects of vertebrate embryonic development, including craniofacial, body axis and pigmentation development. Other neurotransmitter systems, such as the cholinergic and cannabinoid pathways, present additional interesting targets for pharmacological screening. In addition, further experimentation is required in order to dissect the mechanistic developmental roles of the neurotransmitter pathways implicated in the current screen. Although embryos in this screen displayed no overt toxicity, it is possible that some of their defects may have been due to a drug's off‐target effects. A number of drugs in this screen are pleiotropic, affecting ion channels as well as other neurotransmitter receptors. For example, both propranolol and riluzole have the ability to block voltage‐gated Na+ channels (Wang et al. 2008, 2010), and SCH 23390 can block inwardly‐rectifying K+ channels (Kuzhikandathil & Oxford, 2002). In addition, norketamine has been shown to block nicotinic acetylcholine channels (Moaddel et al. 2013), and SCH 23390 can act as an agonist at serotonin 1C and 2C receptors (Briggs et al. 1991; Millan et al. 2001). Future pharmacological experiments could test whether a drug‐induced phenotype can be rescued by co‐application of a drug with an opposing function (i.e. seeing if a phenotype induced by a D1 antagonist can be prevented by co‐administration of a D1 agonist). Overall, however, this pharmacological survey represents the first tier of an inverse drug screen designed to implicate targets for future molecular testing using gene‐specific knockdown and overexpression. Therefore, the next step will consist of testing drugs with greater target specificity (i.e. β1‐AR vs. all β‐ARs) to narrow down the list of candidates and home in on the optimal receptor subtypes for gain‐ and loss‐of‐function studies using transgenesis, CRISPR, morpholino knockdown, and expression of dominant negative or constitutively active mutants of each target. Future studies will also characterize the endogenous expression patterns of important developmental markers as well as endogenous physiological gradients, in embryos in which specific neurotransmitter pathways have been perturbed. This screen reported here represents a necessary first step, and specifically suggests focusing attention on new developmental roles of catecholamines and glutamate. It is imperative to study early and other non‐neural roles of neurotransmitter signaling, as a layer of regulation perhaps mediating between bioelectric signaling and cell behavior. This will shed light on novel developmental controls, contribute to the understanding of the etiology of various birth defects and the teratogenic potential of cognitive modulators in medical use, and reveal new aspects of the evolutionary origins and roles of neurotransmitters (Buznikov & Shmukler, 1981; Buznikov et al. 1996; Levin et al. 2006). Such knowledge will enable use of the constantly increasing pantheon of neurotransmitter pharmacological agents as a powerful toolkit for augmenting control over growth and form.
Disclosure
M. L. has served as a paid consultant on the topic of embryonic functions of molecular pathways, and the potential influence of pharmacological and genetic perturbations on development.
Author contributions
Kelly Sullivan was responsible for choosing reagents for the drug screen, conducting drug exposure experiments, imaging and preparing figures, interpreting data, and drafting the manuscript. Dr. Michael Levin was responsible for the conception and overall design of this study, interpreting data, and critical revision of the manuscript.
Supporting information
Fig. S1. Measurements used to quantify craniofacial shape, pigmentation and body length.
Acknowledgements
The authors thank Erin Switzer for animal husbandry, Drs. Dany Adams and Doug Blackiston for assistance with statistical analysis, Dr. Laura Vandenberg for a critical reading of the manuscript, and members of the Levin lab for many useful discussions. M. L. gratefully acknowledges funding from the Templeton World Charity Foundation (TWCF0089/AB55), The G. Harold and Leila Y. Mathers Charitable Foundation, and the NIH (1R01HD081326‐01).
References
- Adams DS, Levin M (2006) Inverse drug screens: a rapid and inexpensive method for implicating molecular targets. Genesis 44, 530–540. [DOI] [PMC free article] [PubMed] [Google Scholar]
- Akeju O, Davis‐Dusenbery BN, Cassel SH, et al. (2014) Ketamine exposure in early development impairs specification of the primary germ cell layers. Neurotoxicol Teratol 43, 59–68. [DOI] [PMC free article] [PubMed] [Google Scholar]
- Alvarez‐Guerra M, Bertholom N, Garay RP (1999) Selective blockade by nicergoline of vascular responses elicited by stimulation of alpha1A‐adrenoceptor subtype in the rat. Fundam Clin Pharmacol 13, 50–58. [DOI] [PubMed] [Google Scholar]
- Alwan S, Reefhuis J, Rasmussen SA, et al. (2007) Use of selective serotonin‐reuptake inhibitors in pregnancy and the risk of birth defects. N Engl J Med 356, 2684–2692. [DOI] [PubMed] [Google Scholar]
- Beby F, Lamonerie T (2013) The homeobox gene Otx2 in development and disease. Exp Eye Res 111, 9–16. [DOI] [PubMed] [Google Scholar]
- Beyer T, Danilchik M, Thumberger T, et al. (2012) Serotonin signaling is required for Wnt‐dependent GRP specification and leftward flow in Xenopus . Curr Biol 22, 33–39. [DOI] [PubMed] [Google Scholar]
- Bhasin N, Kernick E, Luo X, et al. (2004) Differential regulation of chondrogenic differentiation by the serotonin2B receptor and retinoic acid in the embryonic mouse hindlimb. Dev Dyn 230, 201–209. [DOI] [PubMed] [Google Scholar]
- Blackiston D, Adams DS, Lemire JM, et al. (2011) Transmembrane potential of GlyCl‐expressing instructor cells induces a neoplastic‐like conversion of melanocytes via a serotonergic pathway. Dis Model Mech 4, 67–85. [DOI] [PMC free article] [PubMed] [Google Scholar]
- Blackiston DJ, Anderson GM, Rahman N, et al. (2015) A novel method for inducing nerve growth via modulation of host resting potential: gap junction‐mediated and serotonergic signaling mechanisms. Neurotherapeutics 12, 170–184. [DOI] [PMC free article] [PubMed] [Google Scholar]
- Blader P, Strahle U (1998) Ethanol impairs migration of the prechordal plate in the zebrafish embryo. Dev Biol 201, 185–201. [DOI] [PubMed] [Google Scholar]
- Bozic M, Valdivielso JM (2015) The potential of targeting NMDA receptors outside the CNS. Expert Opin Ther Targets 19, 399–413. [DOI] [PubMed] [Google Scholar]
- Briggs CA, Pollock NJ, Frail DE, et al. (1991) Activation of the 5‐HT1C receptor expressed in Xenopus oocytes by the benzazepines SCH 23390 and SKF 38393. Br J Pharmacol 104, 1038–1044. [DOI] [PMC free article] [PubMed] [Google Scholar]
- Buznikov GA, Shmukler YB (1981) Possible role of “prenervous” neurotransmitters in cellular interactions of early embryogenesis: a hypothesis. Neurochem Res 6, 55–68. [DOI] [PubMed] [Google Scholar]
- Buznikov G, Shmukler Y, Lauder J (1996) From oocyte to neuron: do neurotransmitters function in the same way throughout development? Cell Mol Neurobiol 16, 537–559. [DOI] [PMC free article] [PubMed] [Google Scholar]
- Buznikov GA, Nikitina LA, Seidler FJ, et al. (2008) Amyloid precursor protein 96‐110 and beta‐amyloid 1‐42 elicit developmental anomalies in sea urchin embryos and larvae that are alleviated by neurotransmitter analogs for acetylcholine, serotonin and cannabinoids. Neurotoxicol Teratol 30, 503–509. [DOI] [PMC free article] [PubMed] [Google Scholar]
- Caraci F, Chisari M, Frasca G, et al. (2005) Nicergoline, a drug used for age‐dependent cognitive impairment, protects cultured neurons against β‐amyloid toxicity. Brain Res 1047, 30–37. [DOI] [PubMed] [Google Scholar]
- Carneiro K, Donnet C, Rejtar T, et al. (2011) Histone deacetylase activity is necessary for left‐right patterning during vertebrate development. BMC Dev Biol 11, 29. [DOI] [PMC free article] [PubMed] [Google Scholar]
- Carroll FY, Stolle A, Beart PM, et al. (2001) BAY36‐7620: a potent non‐competitive mGlu1 receptor antagonist with inverse agonist activity. Mol Pharmacol 59, 965–973. [PMC free article] [PubMed] [Google Scholar]
- Choi DS, Ward SJ, Messaddeq N, et al. (1997) 5‐HT2B receptor‐mediated serotonin morphogenetic functions in mouse cranial neural crest and myocardiac cells. Development 124, 1745–1755. [DOI] [PubMed] [Google Scholar]
- Choi MR, Kouyoumdzian NM, Rukavina Mikusic NL, et al. (2015) Renal dopaminergic system: pathophysiological implications and clinical perspectives. World J Nephrol 4, 196–212. [DOI] [PMC free article] [PubMed] [Google Scholar]
- Cifra A, Mazzone GL, Nistri A (2013) Riluzole: what it does to spinal and brainstem neurons and how it does it. Neuroscientist 19, 137–144. [DOI] [PubMed] [Google Scholar]
- Colas J, Launay J, Maroteaux L (1999a) Maternal and zygotic control of serotonin biosynthesis are both necessary for Drosophila germband extension. Mech Dev 87, 67–76. [DOI] [PubMed] [Google Scholar]
- Colas JF, Launay JM, Vonesch JL, et al. (1999b) Serotonin synchronises convergent extension of ectoderm with morphogenetic gastrulation movements in Drosophila . Mech Dev 87, 77–91. [DOI] [PubMed] [Google Scholar]
- Colvin L, Slack‐Smith L, Stanley FJ, et al. (2011) Dispensing patterns and pregnancy outcomes for women dispensed selective serotonin reuptake inhibitors in pregnancy. Birth Defects Res A Clin Mol Teratol 91, 142–152. [DOI] [PubMed] [Google Scholar]
- Cray JJ Jr, Weinberg SM, Parsons TE, et al. (2014) Selective serotonin reuptake inhibitor exposure alters osteoblast gene expression and craniofacial development in mice. Birth Defects Res A Clin Mol Teratol 100, 912–923. [DOI] [PubMed] [Google Scholar]
- Dong C, Anand KJS (2013) Developmental neurotoxicity of ketamine in pediatric clinical use. Toxicol Lett 220, 53–60. [DOI] [PubMed] [Google Scholar]
- Dube F, Amireault P (2007) Local serotonergic signaling in mammalian follicles, oocytes and early embryos. Life Sci 81, 1627–1637. [DOI] [PubMed] [Google Scholar]
- Ducy P, Karsenty G (2010) The two faces of serotonin in bone biology. J Cell Biol 191, 7–13. [DOI] [PMC free article] [PubMed] [Google Scholar]
- Ebert B, Mikkelsen S, Thorkildsen C, et al. (1997b) Norketamine, the main metabolite of ketamine, is a non‐competitive NMDA receptor antagonist in the rat cortex and spinal cord. Eur J Pharmacol 333, 99–104. [DOI] [PubMed] [Google Scholar]
- Entschladen F, Lang K, Drell TL, et al. (2002) Neurotransmitters are regulators for the migration of tumor cells and leukocytes. Cancer Immunol Immunother 51, 467–482. [DOI] [PMC free article] [PubMed] [Google Scholar]
- Fitzgerald PJ, Giustino TF, Seemann JR, et al. (2015) Noradrenergic blockade stabilizes prefrontal activity and enables fear extinction under stress. Proc Natl Acad Sci USA 112, E3729–E3737. [DOI] [PMC free article] [PubMed] [Google Scholar]
- Fort DJ, Rayburn JR, Bantle JA (1992) Evaluation of acetaminophen‐induced developmental toxicity using FETAX. Drug Chem Toxicol 15, 329–350. [DOI] [PubMed] [Google Scholar]
- Fuhrmann S (2010) Chapter three – eye morphogenesis and patterning of the optic vesicle In: Current Topics in Developmental Biology. (eds Ross LC, Thomas AR.), pp. 61–84. Cambridge, MA: Academic Press. [DOI] [PMC free article] [PubMed] [Google Scholar]
- Fukumoto T, Blakely R, Levin M (2005a) Serotonin transporter function is an early step in left‐right patterning in chick and frog embryos. Dev Neurosci 27, 349–363. [DOI] [PubMed] [Google Scholar]
- Fukumoto T, Kema IP, Levin M (2005b) Serotonin signaling is a very early step in patterning of the left‐right axis in chick and frog embryos. Curr Biol 15, 794–803. [DOI] [PubMed] [Google Scholar]
- Garbarino MP, Greene RM (1984) Identification of adenylate cyclase‐coupled beta‐adrenergic receptors in the developing mammalian palate. Biochem Biophys Res Commun 119, 193–202. [DOI] [PubMed] [Google Scholar]
- Grando SA, Pittelkow MR, Schallreuter KU (2006) Adrenergic and cholinergic control in the biology of epidermis: physiological and clinical significance. J Invest Dermatol 126, 1948–1965. [DOI] [PubMed] [Google Scholar]
- Hernandez‐Diaz S, Levin M (2014) Alteration of bioelectrically‐controlled processes in the embryo: a teratogenic mechanism for anticonvulsants. Reprod Toxicol 47, 111–114. [DOI] [PMC free article] [PubMed] [Google Scholar]
- Horiuchi Y, Kimura R, Kato N, et al. (2003) Evolutional study on acetylcholine expression. Life Sci 72, 1745–1756. [DOI] [PubMed] [Google Scholar]
- Hu CY, Suryawan A, Forsberg NE, et al. (1988) Effect of cimaterol on sheep adipose tissue lipid metabolism. J Anim Sci 66, 1393–1400. [DOI] [PubMed] [Google Scholar]
- Hurault‐Delarue C, Montastruc JL, Beau AB, et al. (2014) Pregnancy outcome in women exposed to dopamine agonists during pregnancy: a pharmacoepidemiology study in EFEMERIS database. Arch Gynecol Obstet 290, 263–270. [DOI] [PubMed] [Google Scholar]
- Huybrechts KF, Palmsten K, Avorn J, et al. (2014) Antidepressant use in pregnancy and the risk of cardiac defects. N Engl J Med 370, 2397–2407. [DOI] [PMC free article] [PubMed] [Google Scholar]
- Kaltenbrun E, Tandon P, Amin NM, et al. (2011) Xenopus: an emerging model for studying congenital heart disease. Birth Defects Res A Clin Mol Teratol 91, 495–510. [DOI] [PMC free article] [PubMed] [Google Scholar]
- King MW, Neff AW, Mescher AL (2012) The developing Xenopus limb as a model for studies on the balance between inflammation and regeneration. Anat Rec 295, 1552–1561. [DOI] [PubMed] [Google Scholar]
- Kintner CR, Brockes JP (1984) Monoclonal antibodies identify blastemal cells derived from dedifferentiating limb regeneration. Nature 308, 67–69. [DOI] [PubMed] [Google Scholar]
- Kusano K, Miledi R, Stinnakre J (1982) Cholinergic and catecholaminergic receptors in the Xenopus oocyte membrane. J Physiol 328, 143–170. [DOI] [PMC free article] [PubMed] [Google Scholar]
- Kuzhikandathil EV, Oxford GS (2002) Classic D1 dopamine receptor antagonist R‐(+)‐7‐chloro‐8‐hydroxy‐3‐methyl‐1‐phenyl‐2,3,4,5‐tetrahydro‐1H‐3‐benzazepine hydrochloride (SCH23390) directly inhibits G protein‐coupled inwardly rectifying potassium channels. Mol Pharmacol 62, 119–126. [DOI] [PubMed] [Google Scholar]
- Lauder JM (1988) Neurotransmitters as morphogens. Prog Brain Res 73, 365–387. [DOI] [PubMed] [Google Scholar]
- Leconte I, Mouche I (2013) Frog embryo teratogenesis assay on Xenopus and predictivity compared with in vivo mammalian studies. Methods Mol Biol 947, 403–421. [DOI] [PubMed] [Google Scholar]
- Levin M (2012) Molecular bioelectricity in developmental biology: new tools and recent discoveries: control of cell behavior and pattern formation by transmembrane potential gradients. BioEssays 34, 205–217. [DOI] [PMC free article] [PubMed] [Google Scholar]
- Levin M (2014) Molecular bioelectricity: how endogenous voltage potentials control cell behavior and instruct pattern regulation in vivo . Mol Biol Cell 25, 3835–3850. [DOI] [PMC free article] [PubMed] [Google Scholar]
- Levin M, Buznikov GA, Lauder JM (2006) Of minds and embryos: left‐right asymmetry and the serotonergic controls of pre‐neural morphogenesis. Dev Neurosci 28, 171–185. [DOI] [PubMed] [Google Scholar]
- Lobikin M, Chernet B, Lobo D, et al. (2012) Resting potential, oncogene‐induced tumorigenesis, and metastasis: the bioelectric basis of cancer in vivo . Phys Biol 9, 065002. [DOI] [PMC free article] [PubMed] [Google Scholar]
- Lobikin M, Lobo D, Blackiston DJ, et al. (2015) Serotonergic regulation of melanocyte conversion: a bioelectrically regulated network for stochastic all‐or‐none hyperpigmentation. Sci Signal 8, ra99 (in press). [DOI] [PubMed] [Google Scholar]
- Louik C, Lin AE, Werler MM, et al. (2007) First‐trimester use of selective serotonin‐reuptake inhibitors and the risk of birth defects. N Engl J Med 356, 2675–2683. [DOI] [PubMed] [Google Scholar]
- McArthur RA, Carfagna N, Banfi L, et al. (1997) Effects of nicergoline on age‐related decrements in radial maze performance and acetylcholine levels. Brain Res Bull 43, 305–311. [DOI] [PubMed] [Google Scholar]
- Millan MJ, Newman‐Tancredi A, Quentric Y, et al. (2001) The “selective” dopamine D‐1 receptor antagonist, SCH23390, is a potent and high efficacy agonist at cloned human serotonin (2C) receptors. Psychopharmacology 156, 58–62. [DOI] [PubMed] [Google Scholar]
- Moaddel R, Abdrakhmanova G, Kozak J, et al. (2013) Sub‐anesthetic concentrations of (R, S)‐ketamine metabolites inhibit acetylcholine‐evoked currents in alpha7 nicotinic acetylcholine receptors. Eur J Pharmacol 698, 228–234. [DOI] [PMC free article] [PubMed] [Google Scholar]
- Moiseiwitsch JR, Lauder JM (1995) Serotonin regulates mouse cranial neural crest migration. Proc Natl Acad Sci USA 92, 7182–7186. [DOI] [PMC free article] [PubMed] [Google Scholar]
- Moiseiwitsch JR, Lauder JM (1996) Stimulation of murine tooth development in organotypic culture by the neurotransmitter serotonin. Arch Oral Biol 41, 161–165. [DOI] [PubMed] [Google Scholar]
- Morokuma J, Blackiston D, Adams DS, et al. (2008) Modulation of potassium channel function confers a hyperproliferative invasive phenotype on embryonic stem cells. Proc Natl Acad Sci USA 105, 16 608–16 613. [DOI] [PMC free article] [PubMed] [Google Scholar]
- Mouche I, Malesic L, Gillardeaux O (2011) FETAX assay for evaluation of developmental toxicity. Methods Mol Biol 691, 257–269. [DOI] [PubMed] [Google Scholar]
- Myles N, Newall H, Ward H, et al. (2013) Systematic meta‐analysis of individual selective serotonin reuptake inhibitor medications and congenital malformations. Aust N Z J Psychiatry 47, 1002–1012. [DOI] [PubMed] [Google Scholar]
- Nagoshi N, Nakashima H, Fehlings MG (2015) Riluzole as a neuroprotective drug for spinal cord injury: from bench to bedside. Molecules 20, 7775–7789. [DOI] [PMC free article] [PubMed] [Google Scholar]
- Nandhra HS, Murphy CL, Sule A (2013) Novel pharmacological agents targeting memory and cognition in the treatment of anxiety disorders. Hum Psychopharmacol 28, 538–543. [DOI] [PubMed] [Google Scholar]
- Nguyen L, Rigo JM, Rocher V, et al. (2001) Neurotransmitters as early signals for central nervous system development. Cell Tissue Res 305, 187–202. [DOI] [PubMed] [Google Scholar]
- Nieuwkoop PD, Faber J (1994) Normal Table of Xenopus Laevis. 1st edn Garland Science: New York. [Google Scholar]
- Ori M, De‐Lucchini S, Marras G, et al. (2013) Unraveling new roles for serotonin receptor 2B in development: key findings from Xenopus . Int J Dev Biol 57, 707–714. [DOI] [PubMed] [Google Scholar]
- Pan WK, Li P, Guo ZT, et al. (2015) Propranolol induces regression of hemangioma cells via the down‐regulation of the PI3K/Akt/eNOS/VEGF pathway. Pediatr Blood Cancer 62, 1414–1420. [DOI] [PubMed] [Google Scholar]
- Pasqualetti M, Ori M, Nardi I, et al. (2000) Ectopic Hoxa2 induction after neural crest migration results in homeosis of jaw elements in Xenopus . Development 127, 5367–5378. [DOI] [PubMed] [Google Scholar]
- Pelagio‐Flores R, Ortiz‐Castro R, Mendez‐Bravo A, et al. (2011) Serotonin, a tryptophan‐derived signal conserved in plants and animals, regulates root system architecture probably acting as a natural auxin inhibitor in Arabidopsis thaliana . Plant Cell Physiol 52, 490–508. [DOI] [PubMed] [Google Scholar]
- Pereira AC, Lambert HK, Grossman YS, et al. (2014) Glutamatergic regulation prevents hippocampal‐dependent age‐related cognitive decline through dendritic spine clustering. Proc Natl Acad Sci USA 111, 18 733–18 738. [DOI] [PMC free article] [PubMed] [Google Scholar]
- Pisano MM, Schneiderman MH, Greene RM (1986) Catecholamine modulation of embryonic palate mesenchymal cell DNA synthesis. J Cell Physiol 126, 84–92. [DOI] [PubMed] [Google Scholar]
- Pittenger C, Coric V, Banasr M, et al. (2008) Riluzole in the treatment of mood and anxiety disorders. CNS Drugs 22, 761–786. [DOI] [PubMed] [Google Scholar]
- Pratt KG, Khakhalin AS (2013) Modeling human neurodevelopmental disorders in the Xenopus tadpole: from mechanisms to therapeutic targets. Dis Model Mech 6, 1057–1065. [DOI] [PMC free article] [PubMed] [Google Scholar]
- Rapanelli M, Frick LR, Bernardez‐Vidal M, et al. (2013) Different MK‐801 administration schedules induce mild to severe learning impairments in an operant conditioning task: role of buspirone and risperidone in ameliorating these cognitive deficits. Behav Brain Res 257, 156–165. [DOI] [PubMed] [Google Scholar]
- Reisoli E, De Lucchini S, Anelli T, et al. (2008) Overexpression of 5‐HT2B receptor results in retinal dysplasia and defective ocular morphogenesis in Xenopus embryos. Brain Res 1244, 32–39. [DOI] [PubMed] [Google Scholar]
- Reisoli E, De Lucchini S, Nardi I, et al. (2010) Serotonin 2B receptor signaling is required for craniofacial morphogenesis and jaw joint formation in Xenopus . Development 137, 2927–2937. [DOI] [PubMed] [Google Scholar]
- Salisbury AL, Ponder KL, Padbury JF, et al. (2009) Fetal effects of psychoactive drugs. Clin Perinatol 36, 595–619. [DOI] [PMC free article] [PubMed] [Google Scholar]
- Scallet AC, Schmued LC, Slikker W Jr, et al. (2004) Developmental neurotoxicity of ketamine: morphometric confirmation, exposure parameters, and multiple fluorescent labeling of apoptotic neurons. Toxicol Sci 81, 364–370. [DOI] [PubMed] [Google Scholar]
- Schmitt SM, Gull M, Brandli AW (2014) Engineering Xenopus embryos for phenotypic drug discovery screening. Adv Drug Deliv Rev 69–70, 225–246. [DOI] [PubMed] [Google Scholar]
- Silvestre de Ferron B, Bennouar KE, Kervern M, et al. (2015) Two binges of ethanol a day keep the memory away in adolescent rats: key role for GLUN2B subunit. Int J Neuropsychopharmacol 19, pyv087. [DOI] [PMC free article] [PubMed] [Google Scholar]
- Sive HL, Grainger RM, Harland RM (2000) Early Development of Xenopus Laevis: A Laboratory Manual. Cold Spring Harbor Laboratory Press: Cold Spring Harbor. [Google Scholar]
- Slominski A, Pisarchik A, Zbytek B, et al. (2003) Functional activity of serotoninergic and melatoninergic systems expressed in the skin. J Cell Physiol 196, 144–153. [DOI] [PubMed] [Google Scholar]
- Slominski A, Wortsman J, Tobin DJ (2005) The cutaneous serotoninergic/melatoninergic system: securing a place under the sun. FASEB J 19, 176–194. [DOI] [PubMed] [Google Scholar]
- Smith DJ (1998) The pharmacokinetics, metabolism, and tissue residues of beta‐adrenergic agonists in livestock. J Anim Sci 76, 173–194. [DOI] [PubMed] [Google Scholar]
- Speeckaert R, Van Gele M, Speeckaert MM, et al. (2014) The biology of hyperpigmentation syndromes. Pigment Cell Melanoma Res 27, 512–524. [DOI] [PubMed] [Google Scholar]
- Sugiyama A, Saitoh A, Inagaki M, et al. (2015) Systemic administration of riluzole enhances recognition memory and facilitates extinction of fear memory in rats. Neuropharmacology 97, 322–328. [DOI] [PubMed] [Google Scholar]
- Sunderman FW Jr, Plowman MC, Hopfer SM (1991) Embryotoxicity and teratogenicity of cadmium chloride in Xenopus laevis, assayed by the FETAX procedure. Ann Clin Lab Sci 21, 381–391. [PubMed] [Google Scholar]
- Sunderman FW Jr, Plowman MC, Hopfer SM (1992) Teratogenicity of cadmium chloride in the South African frog, Xenopus laevis . IARC Sci Publ 118, 249–256. [PubMed] [Google Scholar]
- Szulczyk B, Książek A, Ładno W, et al. (2012) Effect of dopamine receptor stimulation on voltage‐dependent fast‐inactivating Na(+) currents in medial prefrontal cortex (mPFC) pyramidal neurons in adult rats. Acta Neurobiol Exp 72, 351–364. [DOI] [PubMed] [Google Scholar]
- Tank AW, Lee Wong D (2015) Peripheral and central effects of circulating catecholamines. Compr Physiol 5, 1–15. [DOI] [PubMed] [Google Scholar]
- Teh J, Chen S (2012) mGlu receptors and cancerous growth. Wiley Interdiscip Rev Membr Transp Signal 1, 211–220. [DOI] [PMC free article] [PubMed] [Google Scholar]
- Tseng A, Levin M (2013) Cracking the bioelectric code: probing endogenous ionic controls of pattern formation. Commun Integr Biol 6, 1–8. [DOI] [PMC free article] [PubMed] [Google Scholar]
- Tucker B, Richards RI, Lardelli M (2006) Contribution of mGluR and Fmr1 functional pathways to neurite morphogenesis, craniofacial development and fragile X syndrome. Hum Mol Genet 15, 3446–3458. [DOI] [PubMed] [Google Scholar]
- Tufan AC, Abban G, Akdogan I, et al. (2007) The effect of in ovo ethanol exposure on retina and optic nerve in a chick embryo model system. Reprod Toxicol 23, 75–82. [DOI] [PubMed] [Google Scholar]
- Vandenberg LN, Lemire JM, Levin M (2012) Serotonin has early, cilia‐independent roles in Xenopus left‐right patterning. Dis Model Mech 6, 261–268. [DOI] [PMC free article] [PubMed] [Google Scholar]
- Vandenberg LN, Blackiston DJ, Rea AC, et al. (2014) Left‐right patterning in Xenopus conjoined twin embryos requires serotonin signaling and gap junctions. Int J Dev Biol 58, 799–809. [DOI] [PMC free article] [PubMed] [Google Scholar]
- Viberg H, Ponten E, Eriksson P, et al. (2008) Neonatal ketamine exposure results in changes in biochemical substrates of neuronal growth and synaptogenesis, and alters adult behavior irreversibly. Toxicology 249, 153–159. [DOI] [PubMed] [Google Scholar]
- Wang RX, Limbird LE (1997) Distribution of mRNA encoding three alpha 2‐adrenergic receptor subtypes in the developing mouse embryo suggests a role for the alpha 2A subtype in apoptosis. Mol Pharmacol 52, 1071–1080. [DOI] [PubMed] [Google Scholar]
- Wang YJ, Lin MW, Lin AA, et al. (2008) Riluzole‐induced block of voltage‐gated Na+ current and activation of BKCa channels in cultured differentiated human skeletal muscle cells. Life Sci 82, 11–20. [DOI] [PubMed] [Google Scholar]
- Wang DW, Mistry AM, Kahlig KM, et al. (2010) Propranolol blocks cardiac and neuronal voltage‐gated sodium channels. Front Pharmacol 1, 144. [DOI] [PMC free article] [PubMed] [Google Scholar]
- Waterman RE, Palmer GC, Palmer SJ, et al. (1976) Catecholamine‐sensitive adenylate cyclase in the developing golden hamster palate. Anat Rec 185, 125–137. [DOI] [PubMed] [Google Scholar]
- Wessler I, Kirkpatrick CJ (2008) Acetylcholine beyond neurons: the non‐neuronal cholinergic system in humans. Br J Pharmacol 154, 1558–1571. [DOI] [PMC free article] [PubMed] [Google Scholar]
- Westphalen RI, Hemmings HC Jr (2003) Selective depression by general anesthetics of glutamate versus GABA release from isolated cortical nerve terminals. J Pharmacol Exp Ther 304, 1188–1196. [DOI] [PubMed] [Google Scholar]
- Wnorowski A, Sadowska M, Paul RK, et al. (2015) Activation of beta2‐adrenergic receptor by (R, R′)‐4′‐methoxy‐1‐naphthylfenoterol inhibits proliferation and motility of melanoma cells. Cell Signal 27, 997–1007. [DOI] [PMC free article] [PubMed] [Google Scholar]
- Wolter JK, Wolter NE, Blanch A, et al. (2014) Anti‐tumor activity of the beta‐adrenergic receptor antagonist propranolol in neuroblastoma. Oncotarget 5, 161–172. [DOI] [PMC free article] [PubMed] [Google Scholar]
- Yakoob MY, Bateman BT, Ho E, et al. (2013) The risk of congenital malformations associated with exposure to beta‐blockers early in pregnancy: a meta‐analysis. Hypertension 62, 375–381. [DOI] [PMC free article] [PubMed] [Google Scholar]
- Yazdy MM, Mitchell AA, Louik C, et al. (2014) Use of selective serotonin‐reuptake inhibitors during pregnancy and the risk of clubfoot. Epidemiology 25, 859–865. [DOI] [PMC free article] [PubMed] [Google Scholar]
- Yelin R, Kot H, Yelin D, et al. (2007) Early molecular effects of ethanol during vertebrate embryogenesis. Differentiation 75, 393–403. [DOI] [PubMed] [Google Scholar]
- Zhang LM, Zhou WW, Ji YJ, et al. (2015) Anxiolytic effects of ketamine in animal models of posttraumatic stress disorder. Psychopharmacology 232, 663–672. [DOI] [PubMed] [Google Scholar]
- Zuber ME, Gestri G, Viczian AS, et al. (2003) Specification of the vertebrate eye by a network of eye field transcription factors. Development 130, 5155–5167. [DOI] [PubMed] [Google Scholar]
Associated Data
This section collects any data citations, data availability statements, or supplementary materials included in this article.
Supplementary Materials
Fig. S1. Measurements used to quantify craniofacial shape, pigmentation and body length.