

We have developed an experimental protocol that allows us reliably to induce and monitor spreading depolarization (SD) in the brain of the fruit fly, opening the way for a wide range of powerful molecular genetic techniques to target specific processes in specific tissues. With the use of our fly model, we provide evidence that the protein kinase G pathway, which has been conserved through evolution, is a potential molecular target to reduce brain susceptibility to SD.
Keywords: anoxic depolarization, Drosophila, extracellular potassium, PKG, spreading depolarization
Abstract
Spreading depolarization (SD) is characterized by a massive redistribution of ions accompanied by an arrest in electrical activity that slowly propagates through neural tissue. It has been implicated in numerous human pathologies, including migraine, stroke, and traumatic brain injury, and thus the elucidation of control mechanisms underlying the phenomenon could have many health benefits. Here, we demonstrate the occurrence of SD in the brain of Drosophila melanogaster, providing a model system, whereby cellular mechanisms can be dissected using molecular genetic approaches. Propagating waves of SD were reliably induced by disrupting the extracellular potassium concentration ([K+]o), either directly or by inhibition of the Na+/K+-ATPase with ouabain. The disturbance was monitored by recording the characteristic surges in [K+]o using K+-sensitive microelectrodes or by monitoring brain activity by measuring direct current potential. With the use of wild-type flies, we show that young adults are more resistant to SD compared with older adults, evidenced by shorter bouts of SD activity and attenuated [K+]o disturbances. Furthermore, we show that the susceptibility to SD differs between wild-type flies and w1118 mutants, demonstrating that our ouabain model is influenced by genetic strain. Lastly, flies with low levels of protein kinase G (PKG) had increased latencies to onset of both ouabain-induced SD and anoxic depolarization compared with flies with higher levels. Our findings implicate the PKG pathway as a modulator of SD in the fly brain, and given the conserved nature of the signaling pathway, it could likely play a similar role during SD in the mammalian central nervous system.
NEW & NOTEWORTHY
We have developed an experimental protocol that allows us reliably to induce and monitor spreading depolarization (SD) in the brain of the fruit fly, opening the way for a wide range of powerful molecular genetic techniques to target specific processes in specific tissues. With the use of our fly model, we provide evidence that the protein kinase G pathway, which has been conserved through evolution, is a potential molecular target to reduce brain susceptibility to SD.
spreading depolarization (SD) occurs as a slowly propagating wave of neural inactivity that is caused by massive cellular depolarization (Leão 1944; Somjen 2001). At the core, SD is an ionic disturbance associated with large changes in extracellular ion concentrations. In the uncompromised brain, SD is temporary and benign; however, it is thought to underlie migraine aura and thus migraine pain (Dreier and Reiffurth 2015). Although SD is nondamaging in healthy neural tissue, SD occurring in the metabolically compromised brain is associated with prolonged recovery times or permanent brain damage, depending on the severity of disturbance (Dreier 2011; Dreier and Reiffurth 2015; Pietrobon and Moskowitz 2014). Following stroke or traumatic brain injury, peri-infarct depolarizations or “spontaneous SD” repeatedly occur in the penumbra surrounding the dead tissue. These events are detrimental, as they increase the final infarct volume (Fabricius et al. 2006).
SD-like disturbances are not limited to mammalian systems but occur in the invertebrate central nervous system (CNS) as well. For instance, when insects enter a coma to survive an acute environmental stress (e.g., anoxia, hyperthermia, and hypothermia), their CNS shuts down abruptly with a loss of ion gradients and a prominent surge of extracellular K+ (Armstrong et al. 2011, 2012; Rodgers et al. 2007, 2010; Rodriguez and Robertson 2012). In most cases, ion homeostasis and neural function recover completely once animals are returned to normal conditions. These events, which are considered adaptive in insects to conserve energy during stress, share many characteristics of SD in mammals (Rodgers et al. 2010). One difference is that insect comas are thought to represent a global response with depolarization occurring rapidly throughout the entire CNS and are only reversible once the stress is removed. On the other hand, SD is often observed as a more restricted disturbance that originates at a focal point before slowly spreading into surrounding tissue.
Although the precise mechanisms underlying SD are still not fully understood, initiation can occur when the extracellular K+ concentration ([K+]o) exceeds a critical threshold level, and thus waves of SD can be triggered by disrupting K+ homeostasis. For example, experimental SD is commonly induced using high KCl solutions or by blockade of the Na+/K+-ATPase with ouabain. With the exposure of the locust, Locusta migratoria, CNS to ouabain triggers repetitive SD events that resemble cortical peri-infarct depolarizations in mammals (Rodgers et al. 2009, 2010). Nevertheless, despite much research effort, many important questions relating to the initiation and propagation of SD remain. To date, many of the results have been based on pharmacological studies that could be a key obstacle hindering our mechanistic understanding of the phenomenon (Pietrobon and Moskowitz 2014). For instance, not only do the different phases associated with SD differ in their pharmacology, but also, the response to pharmacological agents can be different depending on the SD-inducing stimuli (Pietrobon and Moskowitz 2014). To move forward, new experimental models of SD are required.
Pharmacological manipulations require careful interpretation of results, and thus the use of genetic model systems has obvious advantages. Our goal was to develop an experimental protocol to induce and monitor SD in the brain of the genetically tractable model system, Drosophila melanogaster. Additionally, we wanted to investigate how SD susceptibility is affected by genetic background and physiological traits, such as age. Lastly, we were interested in determining how different levels of protein kinase G (PKG) activity influence fly tolerance to SD and related disturbances. Pharmacological inhibition of the PKG pathway in locusts suppresses SD (Armstrong et al. 2009), and adult Drosophila with naturally lower PKG levels are more resistant to anoxia (Dawson-Scully et al. 2010). We predicted that this would be mimicked for SD in the fly brain, confirmation of which, due to the highly conserved nature of the pathway, would indicate potential molecular targets to mitigate SD in the mammalian brain.
MATERIALS AND METHODS
Animals.
All experiments were performed using adult male D. melanogaster Meigen flies, aged 4–9 days old (young flies), except for age experiments when 35- to 40-day-old flies (old flies) were also used. Four fly strains were used in this study as follows: Canton-S (CS; wild-type), w1118 (with a null mutation of the white gene), rover (forR; high PKG activity), and the sitter mutant (fors2; low PKG activity). Rover (forR) flies are a natural strain, having the rover allele at the foraging locus and with high PKG activity, whereas the sitter mutant (fors2) is a mutant strain, previously generated, that shares the same genetic background as rover flies but has lower PKG activity than those found in the naturally occurring sitter (fors) strain (Osborne et al. 1997). All flies were reared under a 12:12-h light:dark cycle in the Biosciences Complex at Queen's University (Kingston, ON, Canada). Flies were raised on a standard medium containing the following: 0.01% molasses, 8.20% cornmeal, 3.40% killed yeast, 0.94% agar, 0.18% benzoic acid, 0.66% propionic acid, and 86.61% water (supplied by the Laurent Seroude laboratory, Queen's University).
Experimental preparation.
Before experimentation, flies were held with a fine-tipped aspirator and immobilized on a small wax block using minuten pins. No anesthesia of any kind was used throughout the dissection. A small hole was cut behind the ocelli to allow access of electrodes to the brain. In experiments where flies were administered injections, an additional minuten pin was used to pull the antennae forward to create easier access for the insertion of the injection needle. To ground the preparation, a chlorided silver wire was inserted into the abdomen between the fourth and fifth terga. Small volumes of either KCl (∼2 nl) or ouabain (∼5–6 nl) were pressure injected directly into the fly head using a PicoSpritzer III (Intracel, Abbotsbury Engineering, Cambs, UK). Solutions were made by dissolving KCl (150 mM) or ouabain (2 × 10⁻⁴ or 5 × 10⁻⁴ M) into a saline consisting of the following (in mM): 147 NaCl, 10 KCl, 4 CaCl, 3 NaOH, and 10 HEPES buffer (pH 7.2; all chemicals were obtained from Sigma-Aldrich, St. Louis, MO). To induce anoxic depolarization, flies were exposed to N2 for 1 min, administered at a flow rate of 5 l/min.
Extracellular K+ recordings.
The extracellular K+ voltage was continuously monitored within the fly brain using K+-sensitive microelectrodes prepared using 1 mm-diameter unfilamented glass capillary tubes. Capillary tubes were cleaned using methanol (99.9%) and subsequently dried on a hot plate for 1 h. Microelectrodes were pulled to form low-resistance tips of ∼5–7 MΩ when filled with potassium ionophore. The microelectrodes were then silanized for 1 h on a hot plate (100°C) by exposure to dichlorodimethylsilane (99%; Sigma-Aldrich) vapor. Following silanization, the tips of the microelectrodes were filled with Potassium Ionophore I–Cocktail B (5% valinomycin; Sigma-Aldrich) and back filled with 500 mM KCl. Filled microelectrodes were stored in the dark with tips suspended in distilled water until needed for experimentation. Reference microelectrodes were prepared using 1 mm-diameter filamented glass capillary tubes pulled to form tips of ∼5–7 MΩ when filled with KCl solution. Just before experimentation, reference microelectrodes were filled with 500 mM KCl. A K+-sensitive and reference microelectrode pair was connected to a DUO773 two-channel intracellular/extracellular amplifier (World Precision Instruments, Sarasota, FL) and calibrated using 15 mM KCl + 135 mM NaCl and 150 mM KCl solutions to obtain the voltage difference from a 10-fold change in [K+]. The microelectrodes were then inserted into the fly brain in close proximity to one another. Following experimentation, the K+ voltage recordings were converted to [K+]o (millimolar) using the Nernst equation [for details, see Rodgers et al. (2007)].
Direct current potential recordings.
Low-resistance microelectrodes (5–7 MΩ) were prepared using 1 mm-diameter filamented glass capillary tubes and subsequently filled with a 500-mM KCl solution before experimentation. Single microelectrodes were connected to a DUO773 two-channel intracellular/extracellular amplifier (World Precision Instruments) and inserted into the fly brain. In propagation experiments, a second electrode connected to a Neuroprobe amplifier (A-M Systems, Carlsborg, WA) was also inserted into the brain at a different distance away from the injection site. The distance between recording electrodes (millimeters) was measured using a micrometer. The occurrence of SD and anoxic depolarization can be monitored by recording direct current (DC) field potential, as the massive cellular depolarizations that take place during these events result in abrupt negative deflections in the field potential (Somjen 2001).
Analyses of spreading depolarization.
The propagation rate (millimeters/minute) of KCl-induced SD was calculated by measuring the distance between recording electrodes and the time delay between the negative shifts in the DC potential at half-maximum amplitude. The latency to onset (minutes) was measured from the time of the first ouabain injection to the upward inflection point (when measuring [K+]o) or the downward inflection point (when monitoring the DC potential) of the first SD event. A minimum latency of 40 min was assigned to preparations, where no SD was induced within the 40-min experimental period. The duration of SD activity (minutes) was measured from the inflection point of the first SD event to the time of recovery following the last SD event. Baseline [K+]o values (millimolar) represent nonsurge [K+]o levels, which were measured before ouabain injections and every 5 min thereafter. If time points coincided with a [K+]o surge, then the closest nonsurge value was taken. The overall change in [K+]o was calculated by measuring the [K+]o at the end of the 40-min treatment period and comparing it with initial levels before ouabain injections.
Analysis of anoxic depolarization.
The time to descend half-amplitude (seconds) was measured from the beginning of N2 exposure to the point at half-maximum amplitude of the abrupt negative shift in DC potential. The descending slope (millivolts/second) represents the rate of descent from 10% to 90% of the negative shift. The time to recover half-amplitude (seconds) represents the time from when N2 exposure ended to the time point at half-maximum amplitude on the upward slope. Recovery slope reflects the rate of recovery from 90% to 10% of the DC potential shift.
Statistical analyses.
All data were analyzed and plotted using SigmaPlot 12.5 (Systat Software, San Jose, CA). Data are reported as means and SE, or the median (Mdn) and interquartile range (IQR) are stated. Data were tested for normality and equal variance to determine whether to use parametric or nonparametric analyses. Significant differences were determined using either t-tests (normally distributed data) or Mann-Whitney's rank sum tests (non-normally distributed data; P < 0.05).
RESULTS
Characterization of spreading depolarization in the brain of D. melanogaster.
Repetitive SD could be induced by injecting small volumes of ouabain directly into the head of adult flies and was monitored by recording the [K+]o within the brain (Fig. 1A). Once initiated, the Mdn duration of SD activity was 10.72 min (IQR = 6.04, 16.43; n = 16). The [K+]o surge amplitudes of the first ouabain-induced event were in the range of 10–70 mM, with a Mdn surge amplitude of 24.05 mM (IQR = 19.08, 37.82; n = 16). Repetitive SD could also be induced by injections of high KCl (150 mM) solutions and monitored by recording the DC field potential within the brain (Fig. 1B). Out of 10 preparations injected with KCl, 7 were associated with repetitive events, with a Mdn duration lasting 6.75 min (IQR = 5.26, 11.39), whereas 3 injections produced single events. The Mdn amplitude of the abrupt negative shift was −25.42 mV (IQR = −28.85, −16.52; n = 10). With the measurement of DC potential from two locations at different distances away from the injection site, it is possible to get a measure of SD propagation velocity (Fig. 1C). The mean propagation rate of KCl-induced SD was 3.0 ± 0.7 mm/min (n = 5) in CS flies.
Fig. 1.

Characterization of spreading depolarization (SD) in the fly brain. A: representative recording of [K+]o dynamics during ouabain-induced SD. Small volumes (∼0.5–0.6 nl) of ouabain (2 × 10⁻⁴ M) were injected into the fly head every 5 min until the onset of SD. Arrows denote timing of injections. B: representative recording of the DC field potential during KCl-induced SD. Arrow denotes the time of KCl head injection (∼0.2 nl of 150 mM KCl solution). C: representative recording demonstrating the propagation of KCl-induced SD. DC field potential was measured from 2 locations at different distances away from the injection site. The electrode closest to the injection site [Electrode (a)] responds first and is followed by the more distanced electrode [Electrode (b)]. Propagation rate was calculated by estimating the distance between recording electrodes and by measuring the time delay at half-maximum amplitude of the abrupt shift in DC potential.
Age affects susceptibility to ouabain-induced spreading depolarization.
The [K+]o was continuously monitored within the brain of young (Fig. 2A) and old (Fig. 2B) flies, and ouabain was injected every 2 min, up to 20 min, or until the onset of SD. In some preparations, before ouabain treatment, spontaneous SD was observed (Fig. 2C) and was recorded for 5 min before terminating the experiment. Spontaneous SD was observed in three old preparations, and surging activity occurred during the entire 5 min. On the other hand, spontaneous SD was only observed once in a young preparation and only resulted in one event during the 5-min period. Ouabain reliably induced at least one event in 44% (4/9 preparations) and 88% (7/8 preparations) of young and old flies, respectively (Table 1). Old flies (n = 8) had shorter latencies to onset of the first ouabain-induced event compared with young ones (n = 9); however, the difference between groups was not statistically significant [Table 1; two-tailed t-test, t(15) = 1.777, P = 0.096]. The number of individual events exhibited within the 40-min treatment period (Mann-Whitney U statistic = 15.000, P = 0.043) and the duration of surging (Mann-Whitney U statistic = 15.500, P = 0.049) were significantly greater in the old flies (n = 8) compared with the young (n = 9; Table 1). Additionally, in old flies, there appeared to be a greater disturbance in [K+]o regulation, evidenced by a progressive increase in [K+]o over the treatment period (Fig. 2D); however, the overall change in [K+]o was not statistically different between groups (Table 1; Mann-Whitney U statistic = 20.000, P = 0.244).
Fig. 2.

The effect of age on ouabain-induced SD. A and B: representative recordings of [K+]o dynamics during ouabain-induced SD in 4- to 9-day-old (young; A) and 35- to 40-day-old (old; B) flies. Downward arrows denote the time of ouabain application. C: representative recording of spontaneous SD recorded from within the brain of an old fly. D: baseline [K+]o levels (millimolar) recorded throughout the 40-min treatment period with ouabain in young (black circles) and old (gray circles) flies. Baseline [K+]o was measured before ouabain injections (Time = 0) and every 5 min thereafter. Data are plotted as means ± SE.
Table 1.
Summary of SD parameters
| Comparison Group | % | Latency, min | # of Events | Duration, min | Delta [K+]o, mM |
|---|---|---|---|---|---|
| CS young | 44 | Mdn = 40.0 | Mdn = 0.0 | Mdn = 0.0 | Mdn = 15.04 |
| IQR = 8.89, 40.0 | IQR = 0.0, 1.50 | IQR = 0.0, 2.89 | IQR = 11.39, 34.05 | ||
| CS old | 88 | Mdn = 7.46 | Mdn = 3.0 | Mdn = 5.42 | Mdn = 40.92 |
| IQR = 2.57, 31.50 | IQR = 1.25, 4.75* | IQR = 3.19, 7.96* | IQR = 12.71, 144.39 | ||
| CS | 67 | Mdn = 13.98 | Mdn = 1.0 | Mdn = 1.65 | Mdn = 29.28 |
| IQR = 7.46, 40.0 | IQR = 0.0, 4.0 | IQR = 0.0, 11.22 | IQR = 14.28, 46.45 | ||
| w1118 | 100 | Mdn = 3.23 | Mdn = 6.50 | Mdn = 16.66 | Mdn = 37.86 |
| IQR = 0.70, 10.84* | IQR = 3.75, 9.0* | IQR = 8.25, 27.52* | IQR = 24.31, 65.41 | ||
| forR | 100 | Mdn = 5.67 | Mdn = 4.50 | Mdn = 12.96 | Mdn = 45.72 |
| IQR = 2.67, 9.30 | IQR = 3.0, 7.0 | IQR = 7.22, 20.65 | IQR = 28.23, 109.63 | ||
| fors2 | 74 | Mdn = 17.89 | Mdn = 4.0 | Mdn = 5.74 | Mdn = 24.04 |
| IQR = 7.46, 32.90* | IQR = 1.0, 7.0 | IQR = 1.06, 10.26* | IQR = 18.63, 27.77* |
Quantification of SD parameters for all flies tested. Three experimental comparisons were made: 1) young Canton S (CS; 4–5 days old) compared with old CS flies (35–40 days old); 2) CS flies compared with w1118 mutants; 3) forR (high PKG activity) compared with fors2 (low levels of PKG activity) flies. Percent (%), percent of preparations that exhibited SD in each group. Latency was measured from the time point of ouabain application to the inflection point of the first ouabain-induced event. Duration of SD activity was measured from the inflection point of the first SD event to the time of recovery following the last SD event. Delta [K+]o, overall change in [K+]o, calculated by measuring the [K+]o at the end of the 40-min treatment period and comparing it with initial levels before ouabain injections.
Significant differences between the corresponding flies within the comparison group. Details of the statistical tests performed and individual P values are reported in results.
Susceptibility to spreading depolarization differs between wild-type and w1118 fly strains.
[K+]o was continuously monitored within the brain of CS (wild-type) flies (Fig. 3A) and w1118 mutants (Fig. 3B), and ouabain was injected every 2 or 5 min, up to 20 min, or until the onset of SD. Ouabain-induced SD was observed in 67% (10/15 preparations) and 100% (14/14 preparations) of CS and w1118 mutants, respectively (Table 1). The latency to onset of the first ouabain-induced event was significantly shorter in w1118 (n = 14) mutants compared with CS (n = 15) flies (Table 1; Mann-Whitney U statistic = 44.000, P = 0.008). Furthermore, the number of events within the treatment period was greater (Mann-Whitney U statistic = 23.500, P = <0.001), and the duration of SD activity was longer (Mann-Whitney U statistic = 25.000, P = < 0.001) in w1118 flies (n = 14) compared with CS (n = 15; Table 1). A progressive increase in baseline levels was observed throughout the treatment period, but the magnitude and rate of increase were similar between CS (those that exhibited SD) and w1118 flies (Fig. 3C). The overall change in [K+]o was not statistically different between w1118 (n = 14) and CS (n = 15) preparations (Table 1; Mann-Whitney U statistic = 87.000, P = 0.445).
Fig. 3.
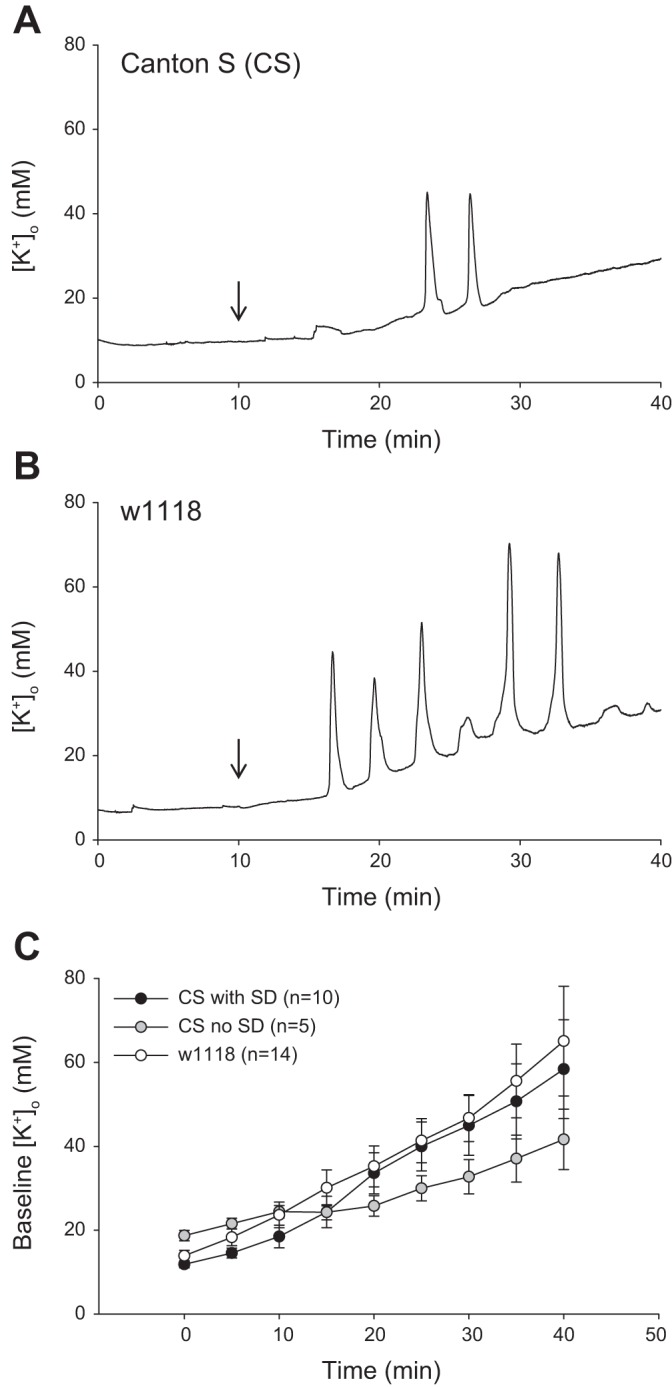
Ouabain-induced SD in wild-type CS flies and w1118 mutants. A and B: representative recordings of [K+]o dynamics during ouabain-induced SD in CS (A) and w1118 (B). Downward arrows denote the time of ouabain application. C: baseline [K+]o levels (millimolar) recorded throughout the 40-min treatment period with ouabain in CS (flies that exhibited SD: black circles; no SD: gray circles) and w1118 (white circles). Baseline [K+]o was measured before ouabain injections (Time = 0) and every 5 min thereafter. Data are plotted as means ± SE.
Flies with higher levels of PKG activity are more susceptible to ouabain-induced spreading depression.
The DC potential (Fig. 4, A and B) or [K+]o (Fig. 4, C and D) was continuously monitored within the brains of forR (high levels of PKG) flies and fors2 mutants (low levels of PKG), and ouabain was injected every 2 min, up to 20 min, or until the onset of SD. Ouabain reliably induced at least one event in 100% (20/20 preparations) and 74% (14/19 preparations) of forR and fors2 preparations, respectively (Table 1). The latency to onset of the first event was significantly shorter in forR flies (n = 20) (Mann-Whitney U statistic = 64.000, P = <0.001) compared with fors2 flies (n = 19; Table 1). There was no significant difference in the number of events observed within the treatment period (Mann-Whitney U statistic = 146.000, P = 0.219); however, the duration of SD activity was significantly longer in forR (n = 20) compared with fors2 (n = 19) preparations [Table 1; two-tailed t-test, t(37) = 3.279, P = 0.002]. The increase in baseline [K+]o levels over the treatment period was greater in forR flies compared with fors2 mutants (Fig. 4E). The overall change in baseline [K+]o was significantly greater in forR flies (n = 7) compared with fors2 flies (n = 7; Table 1; Mann-Whitney U statistic = 7.000, P = 0.026).
Fig. 4.

Ouabain-induced SD and the foraging gene. A and B: representative recordings of DC potential during ouabain-induced SD in forR (A) and fors2 (B) fly strains. C and D: representative recordings of [K+]o dynamics during ouabain-induced SD in forR (C) and fors2 (D) fly strains. E: baseline [K+]o levels (millimolar) recorded throughout the 40-min treatment period with ouabain in forR (gray circles) and fors2 (flies that exhibited SD: black circles; no SD: white circles). Baseline [K+]o was measured before ouabain injections (Time = 0) and every 5 min thereafter. Data are plotted as means ± SE.
Sitter mutants maintain brain activity longer in an anoxic environment.
Flies with higher levels of PKG activity enter anoxic comas, characterized by a loss of locomoter activity, faster compared to flies with lower levels (Dawson-Scully et al. 2010). Furthermore, anoxic depolarization, previously described for flies (Armstrong et al. 2011), is considered an event with the SD continuum (Dreier and Reiffurth 2015). Thus we extended our investigation to determine if brain activity in an anoxic environment differs between forR and fors2 flies. The DC potential was continuously monitored within the brain of forR flies and fors2 mutants during N2 exposure. N2 was applied for 1 min and induced an anoxic coma, characterized by an abrupt negative shift in DC potential (anoxic depolarization) in 100% of forR (n = 10) and fors2 flies (n = 10; Fig. 5A). Just before the large, downward shift, a relatively modest, positive deflection in DC potential was often observed (indicated in Fig. 5A), which we refer to as preanoxic positivity (PAP), and similarly, just before recovery (N2 off), a small, negative deflection in DC potential was recorded (indicated in Fig. 5A), which is referred to as postanoxic negativity (PAN). The time it took to descend to half-amplitude from the onset of the N2 pulse was significantly shorter in forR flies compared with fors2 flies (forR: Mdn = 8.15 s, IQR = 6.20, 9.74; fors2: Mdn = 13.44 s, IQR = 12.57, 15.68; Mann-Whitney U statistic = 5.000, P = <0.001); however, the rate of descent was not statistically different between fly strains [forR: −6.92 ± 0.1.43 mV/s; fors2: −5.27 ± 1.10 mV/s; two-tailed t-test, t(18) = 0.913, P = 0.373]. There was no significant difference in the time to recover half-amplitude [forR: 11.76 ± 1.21 s; fors2: 16.13 ± 2.10 s; two-tailed t-test, t(18) = 1.803, P = 0.088] or in recovery rate (forR: Mdn = 0.63 mV/s, IQR = 0.23, 1.99; fors2: Mdn = 1.02 mV/s, IQR = 0.37, 2.60; Mann-Whitney U statistic = 41.000, P = 0.521) between fly strains. The characteristic PAP was clearly observed in 90% of fors2 flies and in only 30% of forR flies, whereas the PAN was present in 80% and 70% of fors2 and forR flies, respectively (Fig. 5B). The amplitude of both the PAP [two-tailed t-test, t(10) = −2.542, P = 0.029] and PAN [two-tailed t-test, t(13) = 2.942, P = 0.011] shift was significantly greater in fors2 mutants compared with forR flies (Fig. 5C).
Fig. 5.

Anoxia and the foraging gene. A: representative recordings of the DC potential measured from within the brain of a forR and fors2 fly during exposure to N2. To induce an anoxic coma, N2 was applied for 1 min, represented by the black bar located under the traces. Just before the abrupt negative deflection in DC potential (anoxic depolarization), a small, positive deflection [preanoxic positivity (PAP)] in potential was often observed (i). A small, negative deflection [postanoxic negativity (PAN); ii] was often observed at the end of N2 treatment just before recovery. B: percent of preparations that exhibited the characteristic PAP and PAN shifts in DC potential. C: the amplitude of both the PAP [two-tailed t-test, t(10) = −2.542, P = 0.029] and PAN [two-tailed t-test, t(13) = 2.942, P = 0.011] shifts was significantly reduced in forR flies compared with fors2 flies. Significant differences are indicated by asterisks. Data are plotted as means ± SE.
DISCUSSION
SD is an interesting and complex phenomenon occurring in both the vertebrate and invertebrate CNS. It is also a phenomenon of considerable importance for human brain pathologies (Dreier and Reiffurth 2015), accentuating the need to discover cellular mechanisms capable of modulating such events. We have described an experimental protocol, whereby repetitive SD can be reliably induced within the brain of D. melanogaster. The demonstration of SD in the fly brain is notable, because it opens the way for sophisticated molecular genetic experiments to dissect mechanisms of SD and their tissue specificity. With the comparison of flies of different genetic backgrounds, we have shown that our fly model of SD is susceptible to genetic manipulations. We have also demonstrated that the PKG pathway plays an important role during SD in the fly brain (encompassing benign, repetitive events and anoxic depolarization), suggesting that it may be a molecular target to help mitigate the clinical manifestations of SD.
In both the vertebrate and invertebrate CNS, manipulating [K+]o directly, with high KCl solutions or by inhibition of the Na+/K+-ATPase with ouabain, triggers propagating waves of SD (Balestrino et al. 1999; Rodgers et al. 2007). Here, we demonstrate that SD events can be induced in the fly brain using the same inducing stimuli, and importantly, the characteristic surges in [K+]o (in the range of 10–70 mM) and abrupt drops in DC potential (∼25 mV) were of similar magnitude to what is recorded during mammalian SD. For instance, [K+]o rises from ∼3 mM to levels, such as 50–60 mM, during mammalian SD, whereas DC shifts are in the range of 5–30 mV in amplitude (Marshall 1959; Muller and Somjen 2000; Somjen 2001; Vyskocil et al. 1972). The fact that SD starts as a localized disturbance before spreading to affect the surrounding tissue is one of the hallmarks of the phenomenon, hence the name, “spreading depolarization.” Thus it was important to us to confirm that the events induced with our experimental protocol did, in fact, represent an SD. With the recording of DC potential from two locations simultaneously, we clearly demonstrated that the disturbance propagated throughout the brain and did so at velocities (∼3 mm/min) strikingly similar to what has been reported in both the mammalian cortex (2–5 mm/min) and locust CNS (∼2 mm/min) (Grafstein 1956; Leão 1944; Pietrobon and Moskowitz 2014; Rodgers et al. 2007).
An age dependence of SD has been demonstrated previously in mammalian models. In young rats, hypoxic SD is associated with longer latencies to onset and higher K+ thresholds compared with older animals (Hansen 1977; Isagai et al. 1999; Mares et al. 1976). Our experiments support a similar age dependence of SD in the fly brain. Old flies exhibited significantly greater numbers of individual events and longer bouts of SD activity compared with young flies and were more prone to develop spontaneous SD of unknown trigger. The reasons for the diminished resistance to SD with age are not clear but could involve changes in cytoarchitecture as the nervous system matures (Somjen 2001). Indeed, cell swelling and a reduction in the volume of the extracellular compartment have been shown to exacerbate SD in both the vertebrate and invertebrate CNS (Chebabo et al. 1995; Payne et al. 1996; Spong et al. 2015). Nevertheless, the knowledge of why a certain tissue is more resistant to SD could enable the identification of potential targets to suppress the occurrence in more vulnerable tissue.
We chose to compare SD between CS flies and w1118 mutants, because both fly strains are commonly used in the fly community, and thus differences between them would be of general interest. Additionally, many transgenic fly lines are generated using the w1118 genetic background, and thus w1118 serves as a control for many experimental paradigms, again warranting the current investigation. SD was not only easier to elicit in w1118 mutants but was also associated with shorter latencies to onset and longer bouts of surging activity compared with the wild-type strain, demonstrating that the mutants were more responsive to ouabain. The disturbance in baseline [K+]o was similar between the two fly strains, indicating that the increased vulnerability of w1118 mutants was not due to differences in the efficiency of K+ homeostatic mechanisms, as disruptions to those are known to cause greater disturbances in [K+]o levels (Spong and Robertson 2013; Spong et al. 2014). Physiological differences between wild-type flies and w1118 mutants are known. For example, w1118 flies show deficiencies in memory performance (Sitaraman et al. 2008), behave differently in confined spaces (Xiao and Robertson 2015), and are less vulnerable to volatile general anesthetics (Campbell and Nash 2001). Notably, the lack of the white gene in w1118 mutants is responsible for delayed recovery following whole-animal anoxic coma (Xiao and Robertson 2016). Thus although the current experiments do not directly show that the white gene generates the differences observed, it is a likely explanation, and nonetheless, the results are important, as they provide evidence that ouabain-induced SD in the fly brain can be influenced by genetic background. Furthermore, they demonstrate that physiological differences exist between the two strains that need to be taken into account when choosing appropriate controls.
We show that flies with lower levels of PKG activity are less susceptible to ouabain-induced SD compared with flies with higher levels and have longer latencies to SD onset. Pharmacological inhibition of the PKG pathway attenuates ouabain-induced SD and is capable of fully abolishing the phenomenon in 70% of locust preparations (Armstrong et al. 2009). Mechanistic models of locust SD suggest that SD initiation is triggered by stimuli that either promote the accumulation of extracellular K+ ions (Spong et al. 2016) or that reduce K+ clearance mechanisms (Armstrong et al. 2009; Rodgers et al. 2010). In the current experiments, flies with higher levels of PKG exhibited a greater disturbance in baseline [K+]o during the ouabain treatment. Thus the increased susceptibility in flies containing higher PKG activity (forR) could, in part, be due to greater K+ conductance and ultimately, increased rates of K+ accumulation. Indeed, voltage-clamp experiments have demonstrated that forR neurons are associated with greater peak and steady-state, voltage-activated K+ currents compared with fors2 neurons (Renger et al. 1999). Additionally, pharmacological inhibition of the PKG pathway in the locust was associated with lower levels of [K+]o compared with controls following ouabain exposure (Armstrong et al. 2009). PKG-mediated K+ conductances have been described in mammalian systems (Chai and Lin 2008; Kang et al. 2007); however, to the best of our knowledge, the role that the PKG pathway plays during mammalian SD is an area completely unexplored.
Our ouabain experiments clearly demonstrate that flies with higher levels of PKG activity are more susceptible to SD than flies with lower levels. Interestingly, PKG activity in these flies has also been shown to be associated with anoxia tolerance (Dawson-Scully et al. 2010). Unlike mammals, D. melanogaster are known to be anoxia tolerant, surviving hours in low-oxygen environments (Haddad 2006; Wingrove and O'Farrell 1999). In response to anoxic stress, intact insects enter a coma that is reversible upon return to normoxia (Dawson-Scully et al. 2010; Haddad 2006). It has been demonstrated that lower levels of PKG activity in sitter (fors) and sitter mutant (fors2) flies are associated with longer latencies to onset of the anoxic coma (locomotion failure) compared with flies with higher levels of PKG activity (forR) (Dawson-Scully et al. 2010). Recordings from the fly brain have shown that such anoxic coma is associated with SD-like disturbances (abrupt increases in [K+]o and drop in DC potential) that recover once the stress is removed (Armstrong et al. 2011; Rodriguez and Robertson 2012). Thus since anoxic depolarization is part of the SD continuum, we extended our investigation to find out if brain activity in an anoxic environment differs between forR and fors2 flies. We found that fors2 flies were able to maintain brain activity longer in the anoxic environment compared with forR flies, suggesting that they were more resistant to acute anoxic stress. Our results are thus consistent with the whole-animal experiments mentioned above (Dawson-Scully et al. 2010). Additionally, we observed modest, but very characteristic, shifts in DC potential before and following the massive anoxic-negative shift that we termed PAP and PAN, respectively. An interesting observation is that the PAP and PAN shifts occurred more commonly and were of greater magnitude in fors2 flies compared with forR flies. A similar phenomenon—posthypoxic hyperpolarization—has been described previously in mammalian systems and is thought to be a result of enhanced Na+/K+-ATPase activity, as it can be diminished by pump blockers (Krnjevic 2008; Leblond and Krnjevic 1989; Xie et al. 2008). It may be that the PAP and PAN shifts described here reflect electrogenic activity of the pump turning off and on, respectively. If this is the case, then our results suggest that fors2 flies may have stronger or increased pump activity compared with forR flies, which could also help account for the increased latency to onset of the anoxic depolarization observed in these flies.
In conclusion, we have shown that waves of SD can be reliably triggered and monitored within the CNS of Drosophila and demonstrated that susceptibility to the phenomenon differs among genetic fly strains. Essentially, this provides a model system on which molecular-genetic and tissue-specific experiments can be performed to address critical mechanistic questions without the challenges and/or inconsistencies associated with pharmacological studies. Results from our PKG experiments were particularly intriguing, and thus we propose that the PKG pathway's role during mammalian SD merits future investigation.
GRANTS
Funding for this work was provided by a Discovery Grant from the Natural Sciences and Engineering Research Council of Canada.
DISCLOSURES
The authors declare no competing financial interests.
AUTHOR CONTRIBUTIONS
K.E.S., E.C.R., and R.M.R. conception and design of research; K.E.S. performed experiments; K.E.S. analyzed data; K.E.S. and R.M.R. interpreted results of experiments; K.E.S. prepared figures; K.E.S. drafted manuscript; K.E.S. and R.M.R. edited and revised manuscript; K.E.S., E.C.R., and R.M.R. approved final version of manuscript.
ACKNOWLEDGMENTS
The authors thank Dr. Marla B. Sokolowski (University of Toronto) for the rover and sitter fly lines.
REFERENCES
- Armstrong GA, Rodgers CI, Money TG, Robertson RM. Suppression of spreading depression-like events in locusts by inhibition of the NO/cGMP/PKG pathway. J Neurosci 29: 8225–8235, 2009. [DOI] [PMC free article] [PubMed] [Google Scholar]
- Armstrong GA, Rodriguez EC, Meldrum RR. Cold hardening modulates K+ homeostasis in the brain of Drosophila melanogaster during chill coma. J Insect Physiol 58: 1511–1516, 2012. [DOI] [PubMed] [Google Scholar]
- Armstrong GA, Xiao C, Krill JL, Seroude L, Dawson-Scully K, Robertson RM. Glial Hsp70 protects K+ homeostasis in the Drosophila brain during repetitive anoxic depolarization. PLoS One 6: e28994, 2011. [DOI] [PMC free article] [PubMed] [Google Scholar]
- Balestrino M, Young J, Aitken P. Block of (Na+,K+)ATPase with ouabain induces spreading depression-like depolarization in hippocampal slices. Brain Res 838: 37–44, 1999. [DOI] [PubMed] [Google Scholar]
- Campbell JL, Nash HA. Volatile general anesthetics reveal a neurobiological role for the white and brown genes of Drosophila melanogaster. J Neurobiol 49: 339–349, 2001. [DOI] [PubMed] [Google Scholar]
- Chai Y, Lin YF. Dual regulation of the ATP-sensitive potassium channel by activation of cGMP-dependent protein kinase. Pflugers Arch 456: 897–915, 2008. [DOI] [PubMed] [Google Scholar]
- Chebabo SR, Hester MA, Aitken PG, Somjen GG. Hypotonic exposure enhances synaptic transmission and triggers spreading depression in rat hippocampal tissue slices. Brain Res 695: 203–216, 1995. [DOI] [PubMed] [Google Scholar]
- Dawson-Scully K, Bukvic D, Chakaborty-Chatterjee M, Ferreira R, Milton SL, Sokolowski MB. Controlling anoxic tolerance in adult Drosophila via the cGMP-PKG pathway. J Exp Biol 213: 2410–2416, 2010. [DOI] [PMC free article] [PubMed] [Google Scholar]
- Dreier JP. The role of spreading depression, spreading depolarization and spreading ischemia in neurological disease. Nat Med 17: 439–447, 2011. [DOI] [PubMed] [Google Scholar]
- Dreier JP, Reiffurth C. The stroke-migraine depolarization continuum. Neuron 86: 902–922, 2015. [DOI] [PubMed] [Google Scholar]
- Fabricius M, Fuhr S, Bhatia R, Boutelle M, Hashemi P, Strong AJ, Lauritzen M. Cortical spreading depression and peri-infarct depolarization in acutely injured human cerebral cortex. Brain 129: 778–790, 2006. [DOI] [PubMed] [Google Scholar]
- Grafstein B. Mechanism of spreading cortical depression. J Neurophysiol 19: 154–171, 1956. [DOI] [PubMed] [Google Scholar]
- Haddad GG. Tolerance to low O2: lessons from invertebrate genetic models. Exp Physiol 91: 277–282, 2006. [DOI] [PubMed] [Google Scholar]
- Hansen AJ. Extracellular potassium concentration in juvenile and adult rat brain cortex during anoxia. Acta Physiol Scand 99: 412–420, 1977. [DOI] [PubMed] [Google Scholar]
- Isagai T, Fujimura N, Tanaka E, Yamamoto S, Higashi H. Membrane dysfunction induced by in vitro ischemia in immature rat hippocampal CA1 neurons. J Neurophysiol 81: 1866–1871, 1999. [DOI] [PubMed] [Google Scholar]
- Kang Y, Dempo Y, Ohashi A, Saito M, Toyoda H, Sato H, Koshino H, Maeda Y, Hirai T. Nitric oxide activates leak K+ currents in the presumed cholinergic neuron of basal forebrain. J Neurophysiol 98: 3397–3410, 2007. [DOI] [PubMed] [Google Scholar]
- Krnjevic K. Electrophysiology of cerebral ischemia. Neuropharmacology 55: 319–333, 2008. [DOI] [PubMed] [Google Scholar]
- Leão AA. Spreading depression of activity in the cerebral cortex. J Neurophysiol 7: 359–390, 1944. [DOI] [PubMed] [Google Scholar]
- Leblond J, Krnjevic K. Hypoxic changes in hippocampal neurons. J Neurophysiol 62: 1–14, 1989. [DOI] [PubMed] [Google Scholar]
- Mares P, Kriz N, Brozek G, Bures J. Anoxic changes of extracellular potassium concentration in the cerebral cortex of young rats. Exp Neurol 53: 12–20, 1976. [DOI] [PubMed] [Google Scholar]
- Marshall WH. Spreading cortical depression of Leao. Physiol Rev 39: 239–279, 1959. [DOI] [PubMed] [Google Scholar]
- Muller M, Somjen GG. Na+ and K+ concentrations, extra- and intracellular voltages, and the effect of TTX in hypoxic rat hippocampal slices. J Neurophysiol 83: 735–745, 2000. [DOI] [PubMed] [Google Scholar]
- Osborne KA, Robichon A, Burgess E, Butland S, Shaw RA, Coulthard A, Pereira HS, Greenspan RJ, Sokolowski MB. Natural behavior polymorphism due to a cGMP-dependent protein kinase of Drosophila. Science 277: 834–836, 1997. [DOI] [PubMed] [Google Scholar]
- Payne RS, Schurr A, Rigor BM. Cell swelling exacerbates hypoxic neuronal damage in rat hippocampal slices. Brain Res 723: 210–213, 1996. [DOI] [PubMed] [Google Scholar]
- Pietrobon D, Moskowitz MA. Chaos and commotion in the wake of cortical spreading depression and spreading depolarizations. Nat Rev Neurosci 15: 379–393, 2014. [DOI] [PubMed] [Google Scholar]
- Renger JJ, Yao WD, Sokolowski MB, Wu CF. Neuronal polymorphism among natural alleles of a cGMP-dependent kinase gene, foraging, in Drosophila. J Neurosci 19: RC28, 1999. [DOI] [PMC free article] [PubMed] [Google Scholar]
- Rodgers CI, Armstrong GA, Robertson RM. Coma in response to environmental stress in the locust: a model for cortical spreading depression. J Insect Physiol 56: 980–990, 2010. [DOI] [PubMed] [Google Scholar]
- Rodgers CI, Armstrong GA, Shoemaker KL, LaBrie JD, Moyes CD, Robertson RM. Stress preconditioning of spreading depression in the locust CNS. PLoS One 2: e1366, 2007. [DOI] [PMC free article] [PubMed] [Google Scholar]
- Rodgers CI, Labrie JD, Robertson RM. K+ homeostasis and central pattern generation in the metathoracic ganglion of the locust. J Insect Physiol 55: 599–607, 2009. [DOI] [PubMed] [Google Scholar]
- Rodriguez EC, Robertson RM. Protective effect of hypothermia on brain potassium homeostasis during repetitive anoxia in Drosophila melanogaster. J Exp Biol 215: 4157–4165, 2012. [DOI] [PubMed] [Google Scholar]
- Sitaraman D, Zars M, Laferriere H, Chen YC, Sable-Smith A, Kitamoto T, Rottinghaus GE, Zars T. Serotonin is necessary for place memory in Drosophila. Proc Natl Acad Sci USA 105: 5579–5584, 2008. [DOI] [PMC free article] [PubMed] [Google Scholar]
- Somjen GG. Mechanisms of spreading depression and hypoxic spreading depression-like depolarization. Physiol Rev 81: 1065–1096, 2001. [DOI] [PubMed] [Google Scholar]
- Spong KE, Chin B, Witiuk KL, Robertson RM. Cell swelling increases the severity of spreading depression in Locusta migratoria. J Neurophysiol 114: 3111–3120, 2015. [DOI] [PMC free article] [PubMed] [Google Scholar]
- Spong KE, Mazzetti TR, Robertson RM. Activity dependence of spreading depression in the locust CNS. J Exp Biol 219: 626–630, 2016. [DOI] [PubMed] [Google Scholar]
- Spong KE, Robertson RM. Pharmacological blockade of gap junctions induces repetitive surging of extracellular potassium within the locust CNS. J Insect Physiol 59: 1031–1040, 2013. [DOI] [PubMed] [Google Scholar]
- Spong KE, Rochon-Terry G, Money TG, Robertson RM. Disruption of the blood-brain barrier exacerbates spreading depression in the locust CNS. J Insect Physiol 66: 1–9, 2014. [DOI] [PubMed] [Google Scholar]
- Vyskocil F, Kritz N, Bures J. Potassium-selective microelectrodes used for measuring the extracellular brain potassium during spreading depression and anoxic depolarization in rats. Brain Res 39: 255–259, 1972. [DOI] [PubMed] [Google Scholar]
- Wingrove JA, O'Farrell PH. Nitric oxide contributes to behavioral, cellular, and developmental responses to low oxygen in Drosophila. Cell 98: 105–114, 1999. [DOI] [PMC free article] [PubMed] [Google Scholar]
- Xiao C, Robertson RM. Locomotion induced by spatial restriction in adult Drosophila. PLoS One 10: e0135825, 2015. [DOI] [PMC free article] [PubMed] [Google Scholar]
- Xiao C, Robertson RM. Timing of locomotor recovery from anoxia modulated by the white gene in Drosophila. Genetics 203: 787–797, 2016. [DOI] [PMC free article] [PubMed] [Google Scholar]
- Xie M, Wang W, Kimelberg HK, Zhou M. Oxygen and glucose deprivation-induced changes in astrocyte membrane potential and their underlying mechanisms in acute rat hippocampal slices. J Cereb Blood Flow Metab 28: 456–467, 2008. [DOI] [PubMed] [Google Scholar]