In this study, we explored the capability of inferior colliculus neurons to detect amplitude-modulated cochlear implant stimulation with current focusing stimulation compared with monopolar stimulation. To our knowledge, the data presented represent the first report of electrophysiological modulation detection using focused multipolar and tripolar stimulation.
Keywords: cochlear implant, multipolar stimulation, current focusing, modulation detection, inferior colliculus
Abstract
In multichannel cochlear implants (CIs), current is delivered to specific electrodes along the cochlea in the form of amplitude-modulated pulse trains, to convey temporal and spectral cues. Our previous studies have shown that focused multipolar (FMP) and tripolar (TP) stimulation produce more restricted neural activation and reduced channel interactions in the inferior colliculus (IC) compared with traditional monopolar (MP) stimulation, suggesting that focusing of stimulation could produce better transmission of spectral information. The present study explored the capability of IC neurons to detect modulated CI stimulation with FMP and TP stimulation compared with MP stimulation. The study examined multiunit responses of IC neurons in acutely deafened guinea pigs by systematically varying the stimulation configuration, modulation depth, and stimulation level. Stimuli were sinusoidal amplitude-modulated pulse trains (carrier rate of 120 pulses/s). Modulation sensitivity was quantified by measuring modulation detection thresholds (MDTs), defined as the lowest modulation depth required to differentiate the response of a modulated stimulus from an unmodulated one. Whereas MP stimulation showed significantly lower MDTs than FMP and TP stimulation (P values <0.05) at stimulation ≤2 dB above threshold, all stimulation configurations were found to have similar modulation sensitivities at 4 dB above threshold. There was no difference found in modulation sensitivity between FMP and TP stimulation. The present study demonstrates that current focusing techniques such as FMP and TP can adequately convey amplitude modulation and are comparable to MP stimulation, especially at higher stimulation levels, although there may be some trade-off between spectral and temporal fidelity with current focusing stimulation.
NEW & NOTEWORTHY
In this study, we explored the capability of inferior colliculus neurons to detect amplitude-modulated cochlear implant stimulation with current focusing stimulation compared with monopolar stimulation. To our knowledge, the data presented represent the first report of electrophysiological modulation detection using focused multipolar and tripolar stimulation.
along with improved speech processor hardware and electrode designs, developments in stimulation strategies, such as the use of amplitude-modulated interleaved electrical pulse trains, have resulted in remarkable speech understanding in multichannel cochlear implant (CI) users (Dorman 1993; McDermott et al. 1992; Skinner et al. 1994; Wilson et al. 1991). In most modern stimulation strategies, the slow-varying temporal envelopes of bandpass-filtered components of sound are conveyed in the modulation waveforms and the spectral information is transmitted by activation of electrodes at appropriate cochlear places. The electrodes are stimulated typically in a monopolar (MP) configuration, where stimuli are presented to single intracochlear electrodes with reference to a remote extracochlear electrode. In contrast to the generally good speech comprehension in most CI users in quiet conditions, there is a great deal of difficulty when speech is presented in noise (Fu et al. 1998). Many patients report poor perception of sounds such as music and tonal languages that are rich in temporal and spectral information (Skinner et al. 1994; Sucher and McDermott 2007).
CI users are generally provided with limited spectral and temporal information compared with normal-hearing listeners (Friesen et al. 2001; Won et al. 2015). The importance of both temporal and spectral resolution for good speech reception has been reported in normal-hearing listeners (Souza et al. 2015; Xu et al. 2005; Xu and Pfingst 2008) and in recipients of auditory prostheses (Cazals et al. 1994; Colletti and Shannon 2005; Donaldson and Nelson 2000; Fu 2002; Fu et al. 2004; Nie et al. 2006; Shannon 1992). For example, higher speech perception scores are correlated to better temporal processing capabilities, as measured by amplitude modulation detection thresholds (MDTs) (Cazals et al. 1994 De Ruiter et al. 2015; Fu 2002; Gnansia et al. 2014; Won et al. 2011).
One of the underlying causes of the limited spectral and temporal resolution in CIs could be the large current spread from MP stimulation. Methods to increase the number of truly independent channels available for stimulation and improve spectral resolution by current focusing have become of great interest in CI research. Psychophysical and electrophysiological studies have shown that bipolar (BP) and tripolar (TP) stimulation produce sharper excitation patterns and decreased perceptual interactions among simultaneously stimulated channels compared with MP stimulation (Bierer and Middlebrooks 2002, 2004; Chatterjee et al. 2006; Kral et al. 1998; Snyder et al. 1990; Srinivasan et al. 2010; van den Honert and Stypulkowski 1987). However, studies of speech perception have generally shown that CI users tend to perform as well with MP stimulation as with BP and TP stimulation (Berenstein et al. 2008; Fielden et al. 2015; Mens and Berenstein 2005; Pfingst et al. 1997, 2001; Zwolan et al. 1996). An electrophysiological study by Middlebrooks (2008b) reported that narrow BP stimulation resulted in higher MDT compared with MP stimulation, suggesting a possible reason for the lack of speech perception benefit with BP stimulation over MP stimulation. Middlebrooks also reported that responses to narrow BP stimuli tended to show increased trial-by-trial variations in first-spike latencies (i.e., temporal jitter) compared with MP stimulation. These results suggest that there may be a link between these two measures of the temporal processing.
Focused multipolar (FMP) stimulation (also referred to as phased-array stimulation) has also been used as a method to spatially restrict neural activation in CIs (Kalkman et al. 2015; Marozeau et al. 2015; Smith et al. 2013; van den Honert and Kelsall 2007). Our previous electrophysiological studies in both acute and long-term deafened animals showed that FMP and TP stimulation can produce a narrower spread of activation in the inferior colliculus (IC) and reduced channel interactions compared with MP stimulation, with no significant differences observed between FMP and TP stimulation (George et al. 2014, 2015a, 2015b). FMP stimulation was also shown to significantly improve subjects' ability to discriminate spectral features and detect dynamic modulations in sound stimuli (Smith et al. 2013). These results indicate that current focusing stimulation (i.e., FMP and TP stimulation) can improve spectral resolution. An important question then arises as to how current focusing stimulation would compare against traditional MP stimulation when conveying amplitude modulation information.
The present study examined IC neural responses to amplitude-modulated electrical pulse trains using FMP and TP stimulation, compared with MP stimulation, in acutely deafened guinea pigs. We tested modulation depths from −42 dB (i.e., 0.78% modulation) up to 0 dB (i.e., 100% modulation) and compared responses to unmodulated pulse trains. Measures of modulation sensitivity based on phase locking (vector strengths) and spike count of IC neurons while the modulation frequency and stimulus level were varied were compared across stimulation configurations.
MATERIALS AND METHODS
Experimental animals.
Data were obtained from five young adult pigmented guinea pigs (300–600 g) of either sex. All procedures were in accordance with the Australian Code of Practice for the Care and Use of Animals for Scientific Purposes and with the U.S. National Institutes of Health guidelines regarding the care and use of animals for experimental procedures, and were approved by the Bionics Institute Animal Research Ethics Committee. The hearing status of each animal was pre-assessed on the day of the experiment by measuring the auditory brain stem response to acoustic stimuli delivered to each ear using standard techniques (Coco et al. 2007).
Anesthesia, surgery, and recording procedure.
Animals were premedicated with atropine sulfate (0.1 mg/kg im). Anesthesia was induced and maintained by administration (via face mask) of isoflurane (3% for induction and 1–1.5% for maintenance) with oxygen (1 l/min). A heating pad was used to maintain the core body temperature at 37.0 ± 1°C. The respiration rate (normal levels: 10–20 breaths/min) and end-tidal CO2 (normal levels: 1–3%) were monitored over the duration of the experiment (15–17 h).
Before the surgery, animals were placed in a stereotaxic frame (David Kopf Instruments). Local anesthesia (lignocaine, 20 mg/ml sc) was applied before an incision was made above the left pinna. The temporalis muscle was retracted to expose the left tympanic bulla. The bulla was opened, malleoincudal ossicle was removed, and the round and oval windows were punctured. The left cochlea was deafened by infusing neomycin sulfate (10% wt/vol solution) into the round window and aspirating the solution at the oval window to ensure the access of the drug to all regions of the cochlea (Hardie and Shepherd 1999). This was done to ensure that the electrophysiological responses were not contaminated by electrophonic activity arising from stimulation of hair cells (Black et al. 1983; Sato et al. 2016). Animals were implanted with a Hybrid L8 array consisting of eight intracochlear half-band platinum electrodes on a silicon carrier (Shepherd et al. 2011). The electrodes were 0.3 mm in length, spaced ∼0.75 mm center to center. The electrode array tapered in diameter from 0.37 to 0.3 mm from the most basal to the most apical electrode. The electrode array was inserted ∼6.75 mm through the round window into the scala tympani and was fixed in place throughout the experiment. Note that the uncoiled length of a guinea pig cochlea is ∼18–19 mm (Fernández 1952), and thus our electrodes were located in mid- to high-frequency regions.
A craniotomy of the parietal bone was performed on the right dorsolateral portion of the skull, and the cerebral cortex was aspirated to expose the IC contralateral to the implanted cochlea. Multiunit neural activity was recorded using a single-shank silicon-substrate recording array (NeuroNexus Technologies) inserted along the cochleotopic axis of the central nucleus of the IC. The array consisted of 32 iridium recording sites spaced at intervals of 100 μm (center to center), each having a circular surface area of 413 μm2. The array was mounted on a microdrive positioner (David Kopf Instruments), positioned at the surface of the IC and advanced ∼100 μm/s along the dorsolateral-to-ventromedial extent of the IC, at a 45° angle from the sagittal plane, along the main cochleotopic gradient of the IC (Landry et al. 2013; Snyder et al. 1990). The depth of penetration (∼3.5 mm) was chosen by visually monitoring responses of neurons at the tip recording site to electrical stimulation. Multiunit spike activity from the recording sites was amplified, filtered, and digitized at a sampling rate of 30 kHz using a Cerebus data acquisition system (Blackrock Microsystems). At the conclusion of the experiment, the animal was euthanized with an intraperitoneal injection of Lethabarb (0.5 mg/kg).
Stimulus generation and data acquisition.
Stimulus waveforms were generated by an in-house purpose-built multichannel stimulator consisting of multiple Howland current sources driven by a 12-bit digital-to-analog converter (DAC; National Instruments). The stimulator was controlled using custom software implemented in Igor Pro (Wavemetrics). Electrical stimuli consisted of 1-s modulated/unmodulated trains of biphasic pulses. Individual pulses were charge balanced, cathodic first, 400 μs per phase, with an interphase gap of 50 μs for all tested configurations. A longer phase duration than typically used clinically (25–200 μs) was used because of the greater charge required for FMP and TP configurations to evoke neural activity (George et al. 2014). The carrier pulse rate was 120 pulses/s (pps), and pulse trains were presented at a repetition rate of 0.5 Hz. Although clinical CIs stimulate at higher rates, the carrier pulse rate in this study was limited to 120 pps to ensure that stimulus artifacts did not contaminate the multiunit recordings. The peak amplitude of the stimulus waveform was programmed in clinical current level (CL) units defined by Cochlear, ranging between 0 and 255, where current (in μA) = 17.5 × 100(CL/255).
Stimuli were presented in MP, TP, and FMP stimulation configurations. With MP stimulation, only one current source was used and current pulses were delivered to a single intracochlear electrode. With TP stimulation, three current sources were used and current pulses were delivered to a central intracochlear electrode with two adjacent intracochlear electrodes, each carrying half the current in the opposite phase. With FMP stimulation, eight current sources were used to deliver weighted positive and negative current pulses simultaneously to all intracochlear electrodes (George et al. 2014; van den Honert and Kelsall 2007). Note that FMP stimulation can also be achieved using a single current source (Senn 2014).
A “channel” in this study refers to a set of cochlear electrodes used to deliver current in a particular stimulation configuration. Channels were numbered increasing from base to apex, in accordance with the convention used in clinical CIs. The number of its center electrode indicated each FMP and TP channel. For each FMP channel, the weight vector was constructed on the basis of the strategy adapted from van den Honert and Kelsall (2007). A transimpedance matrix was measured for all intracochlear electrodes, with each column of the inverse of this matrix used to calculate the numerical weights that determined the current from each electrode to produce a single FMP stimulation channel.
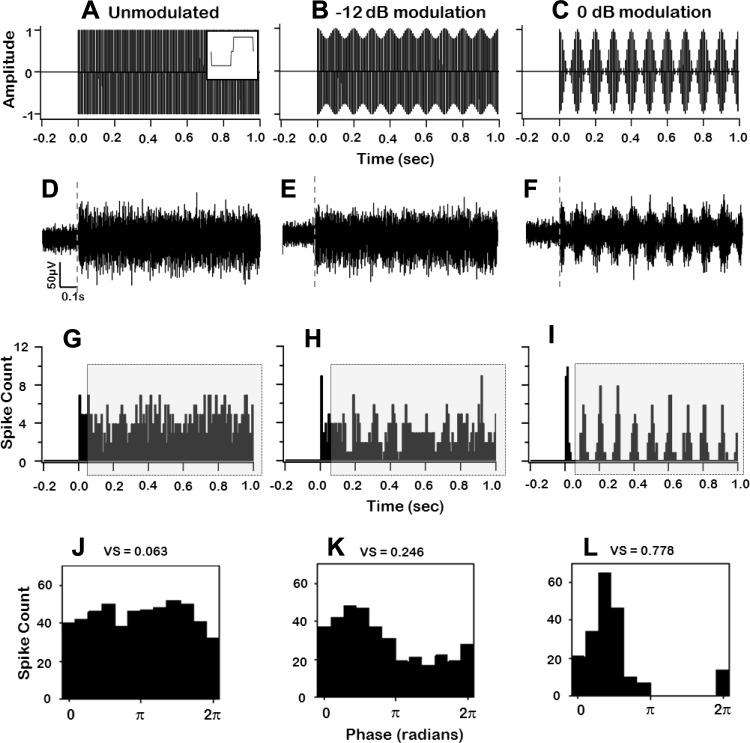
A cochlear channel corresponded to one cochlear location in one animal, and at that point all three stimulation configurations were tested. Cochlear channels that had at least one adjacent or “flanker” electrode on each side using both FMP and TP were stimulated with unmodulated and modulated pulse trains using FMP, TP, and MP stimulation. Amplitude-modulated stimuli were sinusoidal modulated pulse trains (Fig. 1). Pulse trains were modulated by the function
Fig. 1.
Electrical stimulus waveforms and IC neural responses. A–C: amplitude vs. time plots of an unmodulated biphasic pulse train (A) and pulse trains modulated at −12 dB (B) and 0 dB (C). Individual pulses were charge balanced, cathodic first, 400 μs per phase, with an interphase gap of 50 μs (shown in inset in A). Carrier pulse rate was 120 pulses/s (pps), modulation frequency was 10 Hz, and stimulus duration was 1 s. D–F: traces of multiunit responses (including 200-ms prestimulus) from a recording site in the IC following electrical stimulation of a CI channel using FMP stimulation at the modulation depths shown in A–C. Each panel of spike responses (D–F) demonstrates locking to the envelope of the stimulus depicted in the panel (A–C) above. Dotted lines indicate the start of the stimulus. Data are presented after stimulus artifact removal. G–I: peristimulus time histogram (bin width = 8.3 ms) for the responses to unmodulated and modulated pulse trains (shown in D–F above) including prestimulus activity. Analysis was performed after responses between 0 and 50 ms poststimulus were excluded (shown in shaded rectangle). J–L: modulation cycle histograms (bin width = π/6) generated from the spike responses across 5 trials of the stimuli shown in A–C, demonstrating the extent of phase locking of IC spike activity. The mean vector strength computed for different modulation depths is indicated in the corresponding panel. VS, vector strength.
where m is the modulation depth (defined as the ratio between the minimum and peak current levels, adapted from Perry 2012) and fm is the modulation frequency (in Hz). Modulation frequencies used were 10, 20, 30, and 40 Hz. Modulation depths when represented in decibels as 20 log10(m) ranged from 0 to −42 dB in 6-dB steps (i.e., 100, 50, 25, 12.5, 6.25, 3.125, 1.5625, 0.78125, and 0% modulation; Fig. 1). The peak current level of the modulated/unmodulated pulse train was fixed at 2 dB above the threshold of the unmodulated pulse train. A subset of CI channels were also tested at 1 and 4 dB above the threshold. Combinations of stimulation configuration, modulation frequency, modulation depth, and peak current level were presented at random with each repeated five times.
Data analysis.
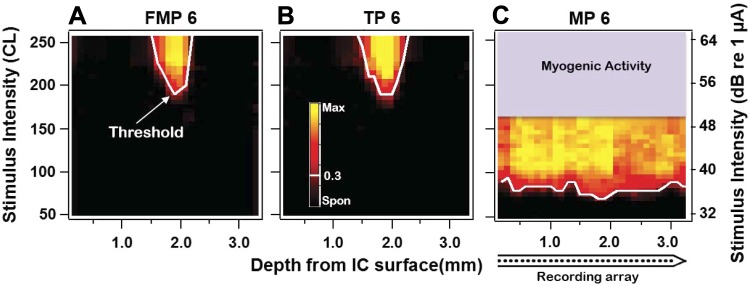
Single-unit and multiunit recordings were processed offline, using customized spike detection scripts in Igor Pro (Wavemetrics). The signal was bandpass filtered (0.3–5 kHz), and stimulus artifacts were removed using techniques detailed by Heffer and Fallon (2008). Spikes were detected when the signal exceeded four times root mean square for each recording channel (Fallon et al. 2009). Analysis was performed on a window from 50 to 1,050 ms after onset of the pulse train (Fig. 1); responses preceding 50 ms were excluded to avoid any effects that may have occurred due to the onset of the stimulus. For each stimulus condition, spike counts were averaged across five trials and normalized between the spontaneous activity rate (average rate in a window from 33 to 3 ms prestimulus) and maximum response across stimulation configurations on a particular recording site as detailed by Landry et al. (2013). Thresholds were estimated from “IC response images” in which normalized spike rates were displayed with the stimulus intensity on the y-axis and the depth of the recording site on the x-axis (see Fig. 3); this analysis is detailed in our previous study (George et al. 2014). The lowest current that elicited a normalized spike rate of 0.3 using an unmodulated pulse train was defined as the IC threshold (Landry et al. 2013) for each cochlear channel. A minimum of 0.3 was chosen for threshold so that spike rates on the best recording site and those adjacent to it were higher than 2 SD of the mean spontaneous rate. IC threshold and the best recording site (i.e., the recording site that yielded the lowest threshold) were computed for each CI channel when presented with unmodulated pulse trains. We also calculated the first spike latency and the standard deviation of the first spike latency across trials (i.e., temporal jitter) for each best recording site.
Fig. 3.
Response images across the cochleotopic axis of the IC to electrical stimulation using an unmodulated pulse train in FMP (A), TP (B), and MP stimulation configurations (C) in an acutely deafened guinea pig. Each response image was labeled according to configuration and channel number (shown for stimulating channel 6). The tip of each response image corresponded to the recording site that is most sensitive to that particular stimulation configuration.
IC neural responses to a modulated stimuli were characterized by 1) averaged spike rate across the duration of stimulation and 2) the vector strength of IC neuronal phase locking at the modulation frequency. The extent of phase locking of IC spikes to the modulator waveform was quantified by computing the vector strength (Goldberg and Brown 1969; Krishna and Semple 2000; Middlebrooks 2008a). Vector strength was calculated only for trials that resulted in activity of more than 4 spikes over the 1-s recording period to avoid erroneously high vector strengths for channels without very good driven activity (Middlebrooks 2008b). Each spike was expressed as a unit vector, with the phase (θ) obtained by expressing the spike time relative to the stimulus period. The mean vector strength was determined by averaging the resulting vector (across n spikes over the duration of stimulation). Vector strength could vary from a minimum of 0 (no phase locking) to a maximum of 1 (all spikes occur at the same unique phase). The statistical significance of the vector strength was assessed by applying the Rayleigh's test of circular uniformity at the level of P < 0.01 (Stephens 1969).
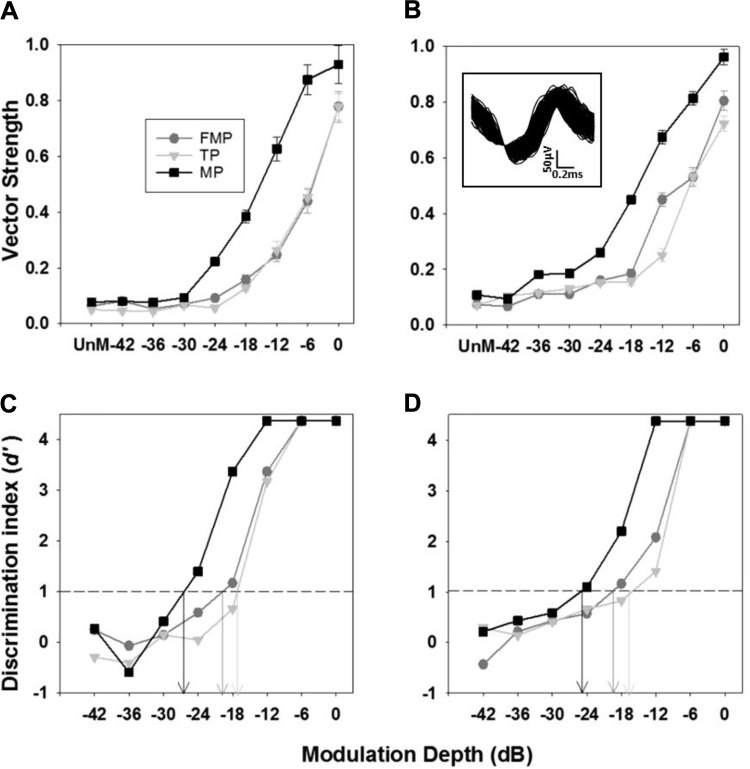
The change in vector strength with modulation depth (Fig. 2, A and B) at each recording site was quantified by the discrimination index d′, computed by a procedure derived from signal detection theory (Green and Swets 1966; Macmillan and Creelman 2005). A receiver operator characteristic curve was formed based on vector strengths elicited for five trials when the stimulus was modulated and unmodulated, by varying the vector strength criterion from 0 to 1. The area under the receiver operator characteristic curve was expressed as a standard deviate, and the resulting z score was multiplied by 2 to obtain d′. For the best recording site (i.e., the recording site that was most sensitive to a particular stimulation configuration) of each stimulating channel, the value of d′ was computed across modulation depths of −42 to 0 dB in steps of 6 dB. The lowest interpolated modulation depth that yielded a d′ of 1 was chosen as the MDT (Fig. 2, C and D), an adaption of the methodology described by Middlebrooks (2008b). Additionally, for all best recording sites in the IC, plots of average spike rate across five trials (in the window from 50 to 1,050 ms after the onset of the pulse train) vs. stimulation level (rate-level curves; see Fig. 4) were generated using responses to unmodulated pulse trains. From these plots, the slopes around 1, 2, and 4 dB above the threshold (i.e., the increase in spike rate from 5 CL below to 5 CL above) were computed and compared across the different stimulation configurations. This was done to assess if the rate-level curve would be related to the modulation sensitivity for different stimulation configurations.
Fig. 2.
Overview of the calculation of modulation detection thresholds (MDTs). A and B: vector strength (mean ± SE) vs. modulation depth plots are shown for FMP, TP, and MP stimulation configurations, demonstrating the trend of vector strength with modulation depth of multiunit activity from an individual IC site (A) and a single unit (B; shown in inset), across 5 trials. The vector strength computed for unmodulated stimulation in each configuration is also shown. C and D: values of d′ are plotted as a function of modulation depth corresponding to A and B above for the 3 stimulation configurations. Each value of d′ was computed from the area of the receiver operator characteristics curve formed, based on vector strengths calculated for 5 trials when the stimulus was unmodulated and modulated at a particular depth. The modulation depth when each interpolated plot crosses d′of 1 was chosen as the MDT (arrows in C and D). The modulated and unmodulated pulse trains are presented at 2 dB above the threshold of an unmodulated pulse train.
Fig. 4.
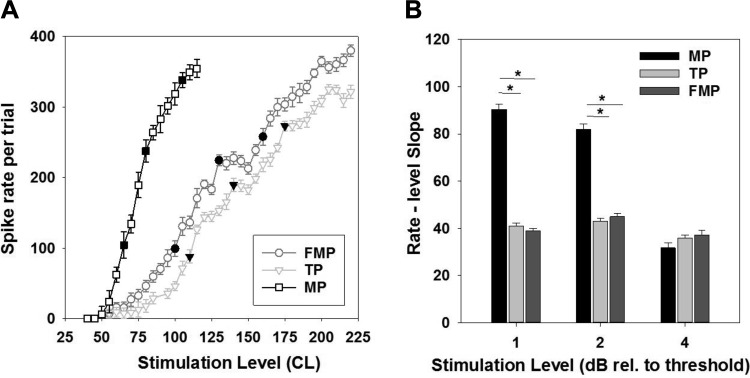
A: mean spike rate (±SE) across 5 trials vs. stimulation level function of the best recording site for an unmodulated pulse presented in different stimulation configurations. Threshold level and levels of 2 and 4 dB above the threshold are indicated (filled symbols). B: group mean (±SE; n = 12 recording sites) for rate-level slope (i.e., the change in spike rate in 10 CL) for MP, TP, and FMP stimulation configurations for different stimulation levels tested. *P < 0.05.
Statistical analysis.
All statistical analyses were performed using SigmaPlot version 13.5 (Systat). The data were pooled over all stimulated channels. Comparisons of IC threshold, spike rate, and temporal jitter between MP, TP, and FMP stimulation were performed using one-way repeated-measures analysis of variance (RM ANOVA), with Tukey's corrected post hoc testing of individual comparisons where appropriate. A two-way RM ANOVA was performed to compare the effects of two stimulus parameters on MDTs. Simple linear regression was used as a measure of correlation between two variables.
RESULTS
Across five animals, we tested four cochlear channels each in four animals and one cochlear channel in the final animal, thus totaling 17 cochlear channels. We obtained measurements of IC neural responses from 160 recording sites based on 5 recording array placements. We extracted 10 single units, which showed patterns of responses similar to the multiunit activity (as shown in Fig. 2). However, because of the limited number, these units were not analyzed further separately. The main analyses were done on multiunit activity from the 17 best recording sites (i.e., the recording site that was most sensitive to each CI channel). The best recording sites for FMP, TP, and MP stimulation of a particular CI channel were not always the same, as observed in our previous studies.
IC response images were generated for electrical stimulation with MP, FMP, and TP stimulation configurations using unmodulated pulse trains. Figure 3 illustrates IC response images and the spatial tuning curves (STCs) from one animal following electrical stimulation of cochlear channel 6 (in the apical third of the array) using the three different stimulation configurations. STCs were generated for each response image (shown by the white line) by joining the stimulus intensities that yielded a normalized spike rate of 0.3 on each recording site. Consistent with our previous results in cats (George et al. 2014, 2015b), the width of the STC increased with increasing stimulus intensity above threshold. MP stimulation resulted in very broad STCs, generally spreading across the entire recording array and resulting in significant myogenic activity at higher intensities, whereas FMP and TP STCs were similarly narrow at low intensities.
Average spike rate.
For each cochlear channel, the spike rate in the window from 50 to 1,050 ms after the onset of the pulse train was derived for the best recording site. There was a monotonic increase in spike rate with increasing stimulation level found in the rate-level curves (Fig. 4A). Consistent with our previous animal studies using single pulses (George et al. 2014, 2015b), thresholds for IC activation using single pulses and unmodulated pulse trains were significantly higher (1-way RM ANOVA, P < 0.001) for FMP and TP than for the MP configuration. With the use of single pulses, IC thresholds averaged 37.6 ± 3.4 dB (relative to 1 μA; mean ± SE) for MP, 50.3 ± 7.2 dB for FMP, and 51.9 ± 8.2 dB for TP stimulation. IC thresholds using unmodulated pulse trains averaged 40.1 ± 4.6 dB (relative to 1 μA; mean ± SE) for MP, 52.7 ± 8.7 dB for FMP, and 53.8 ± 8.5 dB for TP stimulation. A paired t-test confirmed no significant difference between IC thresholds using single-pulse and unmodulated pulse trains (P > 0.05).
We analyzed the slope of the rate-level curve for the unmodulated pulse train around 1, 2, and 4 dB above the threshold for a subset of channels (n = 12). Around 1 and 2 dB above the threshold, the rate-level slope was significantly dependent on stimulation configuration (Fig. 4B; 1-way RM ANOVA, P < 0.05), with FMP and TP stimulation having a significantly shallower slope compared with MP stimulation. However, no significant difference was observed between stimulation configurations around 4 dB above the threshold. To determine the effect of stimulation level on the rate-level slope for each stimulation configuration, independent one-way RM ANOVAs were performed. With FMP and TP stimulation, no significant difference was observed between slopes measured at different stimulation levels. However, MP rate-level slopes were shallower around 4 dB than at 1 and 2 dB above the threshold (P values <0.05).
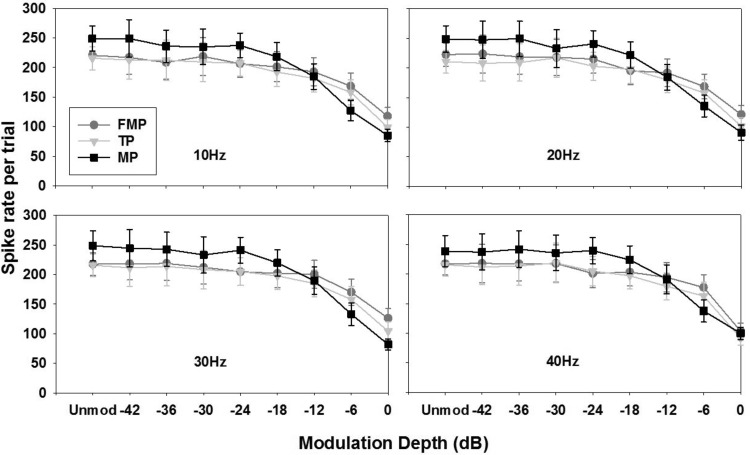
Figure 5 shows the mean spike rate measured for FMP (circles), TP (triangles), and MP stimulation (squares) as a function of modulation depth for various modulation frequencies. Note that the mean spike rate measured for stimulation using an unmodulated pulse train is also shown in each plot.
Fig. 5.
Spike rate (mean ± SE; n = 17 recording sites) in the 50 to 1,050 ms window after the onset of the pulse train, plotted as a function of modulation depth for various stimulation configurations. Each panel represents a particular modulation frequency, as indicated. Spike rate corresponding to the unmodulated pulse train is also included. The modulated and unmodulated pulse trains are presented at 2 dB above the threshold of an unmodulated pulse train.
We observed a general trend of reduction in the overall spike rate with increased modulation depths. In the case of MP stimulation, a significant reduction in the spike rate was observed from −18 to 0 dB (compared with the unmodulated stimulus) at all modulation frequencies (1-way RM ANOVA, P < 0.05). For FMP and TP stimulation, spike rate was significantly reduced at −6 and 0 dB (1-way RM ANOVA, P < 0.05).
Cycle histograms.
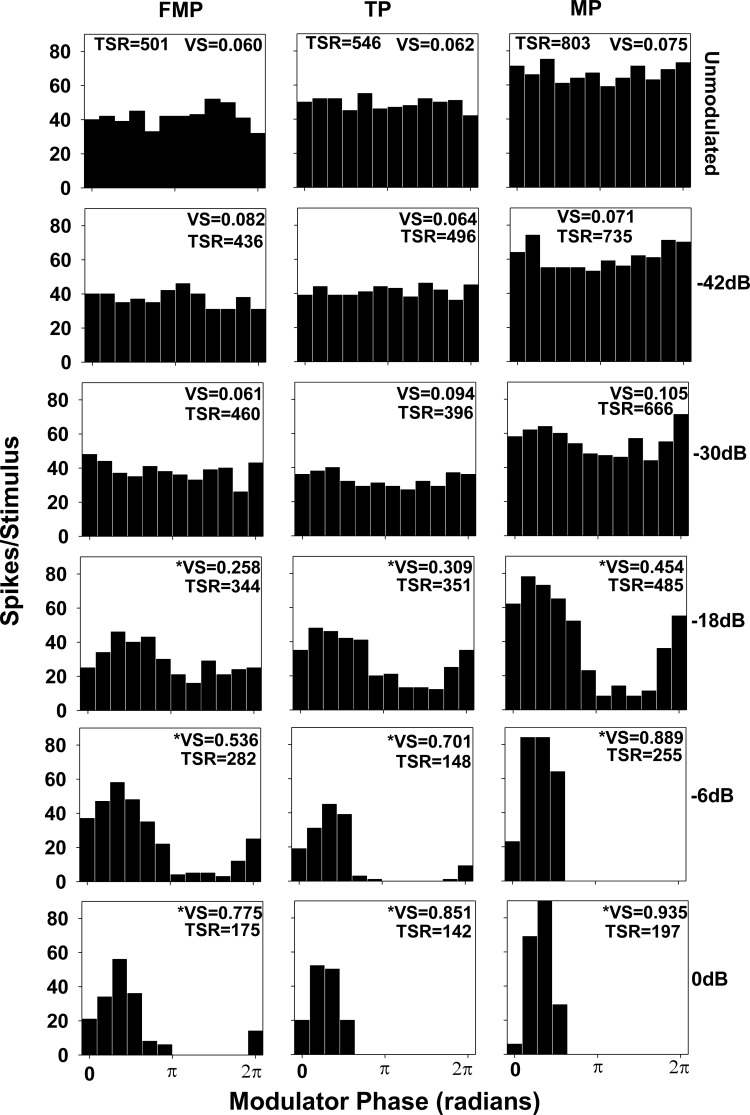
Modulation cycle histograms, which show the distribution of spikes over the phase of the modulating waveform, demonstrated the temporal patterning of IC activity across various stimulation configurations and various modulation depths (Fig. 6). In each panel of Fig. 6, the associated vector strength, which quantifies the phase locked firing of spikes (i.e., the tendency of spikes to occur over a range of phases of the stimulating waveform) is indicated. The top row of panels shows the spike patterns to unmodulated pulse trains, and lower values of vector strength indicate the absence of and/or weaker phase locking. For all stimulation configurations, phase locking was weak at very low modulation depths and strengthened with increasing with modulation depth.
Fig. 6.
Modulation cycle histograms of spikes across 5 trials measured at the best recording site to electrical stimulation of a CI channel in FMP, TP, and MP stimulation configurations. Each column of panels show responses to pulse trains sinusoidally modulated at 10 Hz and at various depths, as indicated. The modulated/unmodulated pulse trains were presented at 2dB above the threshold of the unmodulated pulse train. Spike times occurring 50 to 1,050 ms after onset of the pulse train are binned according to modulator phase, π/6. Total spike rate (TSR) and vector strength (VS; averaged across 5 trials) are indicated in each panel (*P < 0.01 indicates significant vector strength, Rayleigh's test). Note that the best recording site of each stimulation configuration was different.
Peak spike rate.
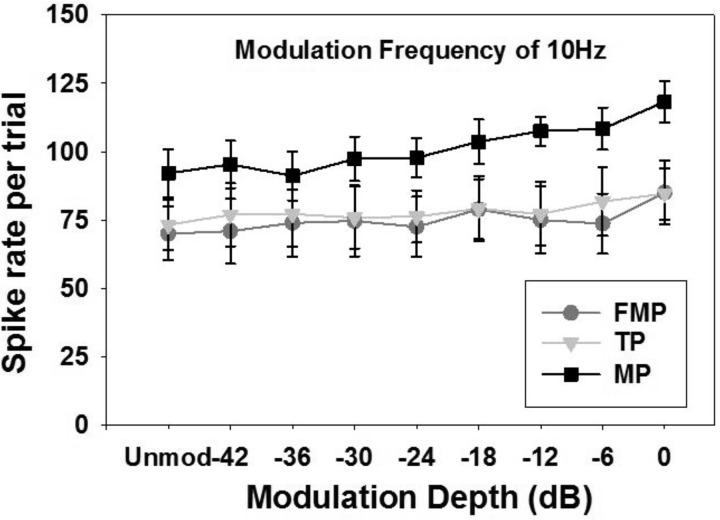
In contrast to the mean spike rate, the peak spike rate (i.e., the maximum of the cycle histogram) showed an increasing trend with increased modulation depths with all three stimulation configurations (Fig. 6). This is because the spikes get clustered more tightly, so the peak rate increases as vector strength increases, whereas the mean spike rate decreases, as shown in Fig. 5. These data are summarized in Fig. 7 and demonstrate that MP stimulation showed a significant increase in peak spike rate (compared with the unmodulated stimulus) when with a depth of −12 to 0 dB, whereas FMP and TP stimulation only showed a significant increase at a depth of 0 dB (1-way RM ANOVAs, P values <0.05). We did not observe a change in the best modulation phase across different stimulation configurations, stimulation channels, or modulation frequencies.
Fig. 7.
Mean spike rate at the peak of the cycle histogram plotted as a function of modulation depth for various stimulation configurations (n = 17 recording sites). Spike rate corresponding to the unmodulated pulse train is also included. The modulated pulse trains were presented at 2dB above the threshold of an unmodulated pulse train and were modulated at 10 Hz.
Vector strength.
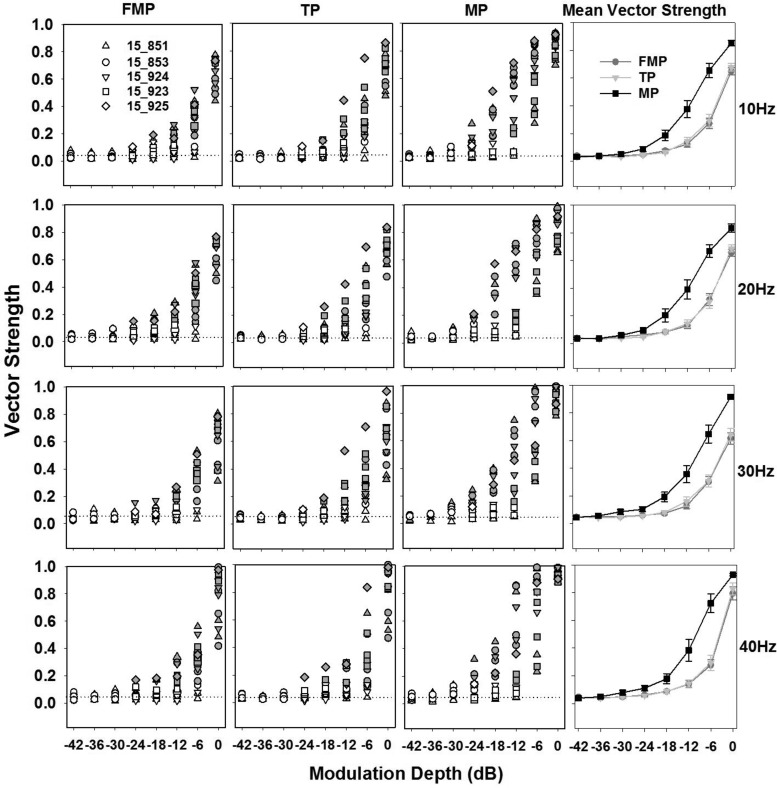
The distributions of vector strength across all best recording sites for FMP, TP, and MP stimulation configurations and for modulation frequencies of 10, 20, 30, and 40 Hz are shown in Fig. 8. These distributions include vector strengths of best recording sites from all animals, represented by different symbols, with closed symbols representing vector strengths that were statistically significant (Rayleigh test, P < 0.01) and open symbols indicating vector strengths that were not significant. The vector strengths computed for IC responses to unmodulated pulse trains presented in three different stimulation configurations are also shown (dotted lines). In every panel, vector strengths increased monotonically with increasing modulation depth. Vector strengths varied amongst stimulation configurations, with 50% of sites showing significant vector strengths with MP stimulation at modulation depths greater than or equal to −24 dB, and with FMP and TP stimulation at modulation depths greater than or equal to −12 dB.
Fig. 8.
Distribution of vector strengths across the best recording sites from all the animals for FMP, TP, and MP stimulation configurations, as indicated. Each row represents vector strengths for modulation frequencies of 10, 20, 30, and 40 Hz. Each individual animal's data are represented with a different symbol. Every vector strength is shown, with closed symbols indicating statistically significant vector strengths (P < 0.01, Rayleigh test) and open symbols indicating those that failed to produce significant phase locking. Dotted lines indicate the average vector strength computed across the best recording sites when stimulated with unmodulated pulse trains in a particular stimulation configuration. The modulated pulse trains are presented at 2dB above the threshold of an unmodulated pulse train. Far right column shows mean vector strength (mean ± SE) vs. modulation depth across different stimulation configurations (n = 17 recording sites across 5 animals).
To ensure that artifact contamination did not affect our vector strengths (because artifacts could vary between stimulation configurations), we implemented additional measures in the analyses that included analysis of single-unit activity (Fig. 2B) and analyses of recording sites away from the best recording site (which would have the same artifacts and background noise but different spiking activity). These distant recording sites did not exhibit any significant vector strengths regardless of the configuration, confirming that the phase locking observed on the best recording sites were indeed from spiking activity, and not from stimulus artifacts.
Modulation detection threshold.
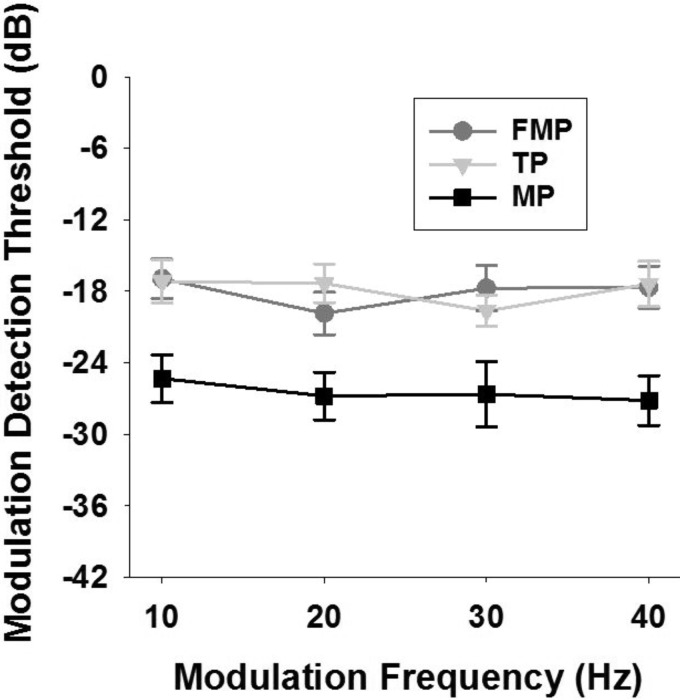
Figure 9 shows MDTs based on vector strength for the best recording sites to electrical stimulation of cochlear channels in different stimulation configurations. A two-way RM ANOVA (stimulation configuration and modulation frequency as factors) showed that MDTs were significantly different between stimulation configurations (P < 0.001) and not between different modulation frequencies (P > 0.05), with no significant interaction between stimulation configuration and modulation frequency (P > 0.05). Post hoc tests indicated that MP stimulation exhibited lower MDTs than FMP and TP stimulation (P values <0.001), and no significant difference was observed between FMP and TP stimulation (P > 0.05). The MDTs measured across all modulation frequencies averaged −18.08 ± 0.87 dB for FMP, −17.62 ± 0.82 dB for TP, and −26.47 ± 1.08 dB for MP stimulation.
Fig. 9.
Modulation transfer functions [i.e., MDT (mean ± SE) vs. modulation frequency (Hz)] based on vector strength of the best recording sites shown for FMP, TP, and MP stimulation configurations (n = 17 recording sites across 5 animals). The modulated pulse trains are presented at 2 dB above the threshold of an unmodulated pulse train.
Temporal jitter.
An independent measure of the temporal characteristics of responses to each stimulation configuration was provided by the first-spike latency and temporal jitter, calculated as the standard deviation of first-spike latency. Both first-spike latency and temporal jitter generally decreased monotonically with increasing current level. At 2 dB above the threshold, the first-spike latency ranged from 3.8 s to 5.9 ms across all three stimulation configurations, with mean value of 4.78 ± 0.34 ms for FMP, 4.70 ± 0.29 ms for TP, and 4.55 ± 0.13 ms for MP stimulation. The jitter values measured at 2 dB above threshold averaged 0.73 ± 0.35, 0.69 ± 0.29, and 0.54 ± 0.26 ms for FMP, TP, and MP stimulation, respectively. Both the first-spike latency and the temporal jitter did not differ significantly between different stimulation configurations (1-way RM ANOVA, P > 0.05, n = 17).
Effect of stimulation level on MDT.
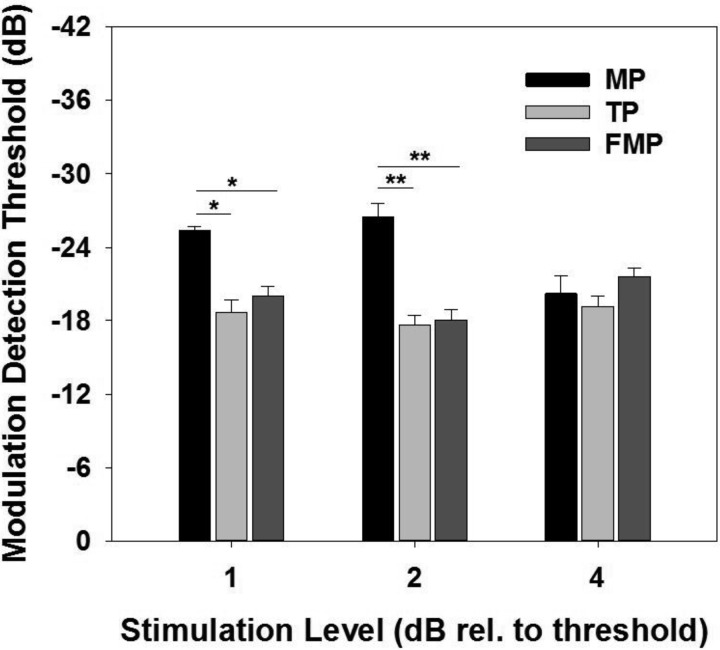
To study the effects of overall stimulation level on MDTs, a subset of CI channels (9 channels across 3 animals) were stimulated at lower (1 dB above the threshold) and higher (4 dB above the threshold) stimulation levels. At l dB above the threshold, configuration effects on MDTs were similar to those observed at 2 dB above the threshold (i.e., MP stimulation exhibited lower MDTs than FMP and TP stimulation; Fig. 10; 1-way RM ANOVA, P values < 0.01) with no significant difference between FMP and TP stimulation (P > 0.05). However, at 4 dB above the threshold, no significant difference was observed between the different stimulation configurations (Fig. 10; 1-way RM ANOVA, P values >0.05).
Fig. 10.
Group means (±SE) for modulation detection thresholds for MP, TP, and FMP stimulation configurations for different stimulation levels tested (n = 17 recording sites for 2 dB and n = 9 recording sites for 1 and 4 dB). *P < 0.01; **P <0.001.
To determine the effect of stimulation level on MDTs for each stimulation configuration, independent one-way RM ANOVAs were performed. In the case of MP stimulation, MDTs measured at higher stimulation level (i.e., at 4 dB) were significantly higher than those measured at lower stimulation levels (P values <0.05). With FMP and TP stimulation, no significant difference was observed between MDTs measured at different stimulation levels.
Effect of stimulation site on MDT.
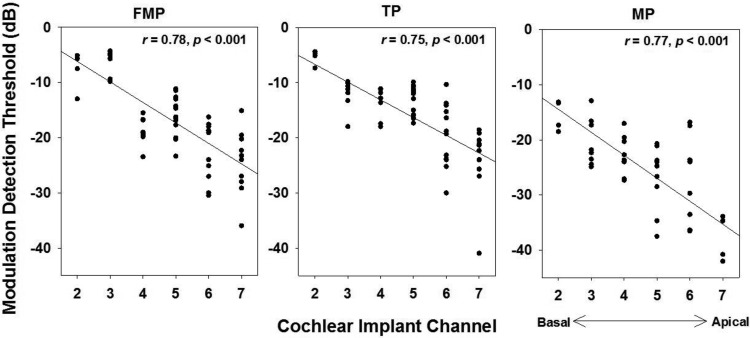
The modulation sensitivity or the strength of phase locking varied according to the site of the CI channel. Figure 11 shows the distribution of MDTs as a function of CI channel number measured across all modulation frequencies for different stimulation configurations. For each stimulation configuration, MDTs exhibited a significant correlation with the stimulation site (P values <0.001). Highest MDTs were recorded for the basal CI channels. This dependency is likely to be the major factor contributing to the wide variations observed in vector strengths in Fig. 8. However, we did not observe significant apical/basal differences of other parameters such as first-spike latency and spike rate.
Fig. 11.
Distribution of MDTs as a function of CI channel for various stimulation configurations. Data are shown for channels stimulated with modulated pulse trains with peak current at 2 dB above the threshold. Data across all tested modulation frequencies are grouped together.
DISCUSSION
In the present study, we evaluated the responses of IC neurons to sinusoidal amplitude-modulated pulse trains using FMP and TP stimulation and compared these to responses obtained with MP stimulation. We also examined the effects of stimulation level and modulation frequency on modulation sensitivity for the different stimulation configurations. The sensitivity of IC neurons to amplitude modulation was characterized on the basis of average spike rate over the duration of the stimulus and the strength of phase locking, represented by the vector strength. To the best of our knowledge, the data presented in this article represent the first report of electrophysiological modulation detection using FMP and TP stimulation.
The main finding of this study was that at lower stimulation levels (1 and 2 dB above threshold), MP stimulation had lower MDTs than FMP or TP stimulation, whereas no significant difference was observed between FMP and TP stimulation. However, at 4 dB above threshold, MDTs did not differ significantly between stimulation configurations, as a result of increased MDTs at higher stimulation levels with MP stimulation. Moreover, we observed a reduction in spike rate with increased modulation depths, with MP stimulation resulting in a significant reduction in spike rate at shallower modulation depths than FMP and TP stimulation. We did not observe any difference between different modulation frequencies tested. Finally, modulation sensitivity was generally poorer when stimulating more basal CI channels.
It is worth noting that in the present study, comparisons of stimulation configuration at particular stimulation levels expressed in decibels relative to threshold may be confounded by the fact that we might have operated at different levels of dynamic range given the previous reports of different dynamic ranges for MP, TP, and FMP (George et al. 2014, 2015b). For example, 2 dB above the threshold might be at different loudness level (i.e., a softer level for FMP and TP stimulation compared with MP stimulation; see Fig. 4, where MP stimulation resulted in higher spike rates compared with FMP and TP stimulation). However, given that MDTs were similar across all stimulation levels (i.e., 1, 2, and 4 dB above threshold) for FMP and TP stimulation, this difference in dynamic range between the stimulation configurations should not affect the main findings.
Relation to other animal studies.
The present study can be compared with the electrophysiological study conducted by Middlebrooks (2008b) in acutely deafened guinea pigs. That study examined phase locking of neurons in the auditory cortex to the envelope of modulated pulse trains presented in MP and narrow BP (i.e., adjacent active and return electrodes) stimulation configurations, with both configurations using the next-to-most apical intracochlear electrode as the active electrode. Middlebrooks reported that modulation detection of MP stimulation was significantly better than narrow BP stimulation for the 254 and 4,096 pps carrier rates. Similarly, for the 120 pps carrier rate, the present study showed that MP stimulation tended to have enhanced modulation sensitivity compared with FMP and TP stimulation. However, the advantage in modulation sensitivity with MP over FMP and TP stimulation was only observed at low stimulation levels. This may be in part explained by the steeper rate-level slopes found when MP stimulation was used with unmodulated pulse trains (Fig. 4), resulting in a larger change in spike rate across the modulation cycle. This in turn would have led to a sharper cycle histogram (Fig. 6), and hence a higher vector strength. However, at higher stimulus levels, we observed that MP rate-level curves were flatter around 4 dB than at 2 dB above threshold, whereas the slopes for focused stimulation were unchanged, which might account for the decrease in modulation sensitivity of MP stimulation at higher stimulation levels.
Even though the stimulation levels in Middlebrooks' study were set to 2, 4, and 6 dB above threshold, data were reported only for the stimulation level that produced the lowest MDT when MP stimulation was compared with BP stimulation. Therefore, it is possible that a similar level effect may have been present in the Middlebrooks study but that it was not evident because of the collapse across stimulation level. Middlebrooks proposed that the better modulation sensitivity seen with MP stimulation was due to the widespread and synchronous neural activation that typically occurs with MP stimulation. This hypothesis was supported by the significantly lower temporal jitter observed in response to MP stimulation compared with BP stimulation. In contrast, there was no significant difference in temporal jitter at 2 dB above threshold in the present study between all three stimulation configurations tested. We observed that IC neurons exhibited mean first spike latencies in the range 3.8 to 5.9 ms across all three stimulation configurations, consistent with previous reports from our laboratory with the use of similar experimental techniques (Landry et al. 2013). Whereas the present study observed a reduction in IC spike rate with increased modulation depth, Middlebrooks' study reported that the spike rate typically increased with modulation depth. The discrepancy between these two results is likely to be related to differences in the modulation waveforms used. The present study used modulated waveforms with the peak amplitude fixed (i.e., maximum downmodulation); thereby, greater modulation depths resulted in reduced number of points where current level exceeded neural threshold (see Fig. 1C). In contrast, the Middlebrooks' study used modulated waveforms with current levels ranging above and below (i.e., mean up- and downmodulation) the mean current in modulated waveform such that the peak amplitude increased with increase in modulation depth, typically resulting in increased spike rates. Finally, Middlebrooks' data showed a considerable increase in the percentage of units that showed no phase locking at any modulation depth with BP stimulation. This effect was, however, not evident with TP or FMP stimulation in the present study. A likely explanation for the failure to find this effect is that the present study analyzed only the best recording sites or the most sensitive units, whereas Middlebrooks reported every unit that was recorded. Moreover, some of the differences found between the two studies might be a consequence of the difference in recording structure (i.e., IC vs. auditory cortex). These structures are known to have different limiting rate, which is much higher in the IC (i.e., ∼120 Hz; Middlebrooks and Snyder 2010) than auditory cortex (i.e., ∼20 Hz; Fallon et al. 2014). Notably, in the present study, even though we excluded responses before 50 ms to avoid onset response, we observed that 100% of best recording sites displayed a significant time-locked response (vector strength ranging from 0.46 to 0.99 when including first response at 50 ms and from 0.48 to 0.99 when excluding response prior to 50 ms) to each pulse in the carrier pulse train employed at 120 pps for all stimulation configurations and all stimulation sites. Finally, there are also differences in the level of spectral integration that occurs in the IC and auditory cortex (Casseday et al. 2002; Irvine 1992; Read et al. 2002), which may contribute to some of the differences between the present study and Middlebrooks' study.
Relation to human studies.
The ability to detect amplitude modulation has been widely used to measure the temporal envelope-processing capability in CI users. Modulation transfer functions, defined as the plot of MDT as a function of modulation frequency, measured in CI subjects generally show low-pass characteristics with a 100- to 150-Hz cutoff frequency (Busby et al. 1993; Shannon 1992). Similarly, for the low modulation rates used in this study (10–40 Hz), there was no change in the modulation sensitivity with modulation frequencies.
Consistent with several reports on the significant variability in MDTs across listeners and also across stimulation sites within listeners (Colletti and Shannon 2005; Fu 2002; Garadat et al. 2012; Pfingst et al. 2008), we observed that vector strengths and MDTs varied widely among stimulation sites for all stimulation configurations. There have been reports of systematic variation in MDTs along the cochlear length in some CI users (Garadat et al. 2012; Pfingst 2011; Pfingst et al. 2007). Consistent with these reports, the present study showed a clear tendency for more apical channels to have enhanced modulation sensitivity. This could be related to the systematic anatomical differences along the cochlear spiral, such as wider cross-sectional diameter of the scala at more basal locations, resulting in current flowing along different pathways. It is also possible that these variations could be induced by differences in the location of the stimulating electrodes relative to the modiolus as a function of cochlear length. There is a dramatic decrease of cross-sectional area after 4–5 mm in the guinea pig cochlea from ∼1.1–1.3 mm to ∼0.3–0.4 mm (Fernández 1952; Thorne et al. 1999; Wada et al. 1998), and hence the most apical contacts were likely to be located very close to the modiolar wall. The present result is also consistent with the results of the study by Middlebrooks and Snyder (2010) in which they showed that low-frequency IC sites had better temporal acuity than high-frequency sites. In the present study, the correlation between MDTs and stimulation site was similar for the broad MP stimulation and the focused stimulation (i.e., FMP and TP). This is attributed to our analysis that was based only on the best recording sites rather than the whole recording array.
There are several caveats to note when comparing the present animal study with human psychophysical data. Among these are a range of species-dependent factors and differences in the experimental methodology, including duration of deafness and electrical stimulation parameters. Additionally, MDTs determined using psychophysical approaches may differ methodologically from the electrophysiologically determined MDTs in the midbrain described in the present study. Stimulation levels in human psychophysical studies are normally set at levels within the dynamic range from threshold to most comfortable level, whereas the present study tested modulation sensitivity at stimulation levels relative to the lowest IC activation threshold. Most human psychophysical studies have found that MDTs generally improve as the stimulation level is increased (although some CI users were reported to show no effect above 30% of their dynamic range; Fu 2002; Galvin and Fu 2009; Shannon 1992). In contrast, we observed that modulation sensitivity of MP stimulation reduced at higher stimulation levels. A similar trend of decrease in modulation sensitivity with increased stimulation level was reported by Middlebrooks (2008b). In 77.7% cases of MP stimulation and 24.6% and 22.5% cases of FMP and TP stimulation, respectively, we observed that IC neurons were driven to saturation at 4 dB above threshold. This might have contributed to the impairment of modulation sensitivity of MP stimulation at high stimulation levels. However, modulation sensitivities of FMP and TP stimulation showed no stimulation level effect, demonstrating the adequate modulation detection capability of FMP and TP stimulation even at high stimulation levels. Moreover, FMP and TP stimulation were found to have similar modulation sensitivity. This is consistent with our previous electrophysiological studies that showed similar performance in spatial selectivity and channel interactions with FMP and TP stimulation (George et al. 2014, 2015a, 2015b).
One of the limitations of the present study is that the carrier rate was limited to 120 pps, lower than typically used clinically (i.e., 250 to ∼ 4,000 pps), to ensure that stimulus artifacts did not contaminate the multiunit recordings. Middlebrooks (2008b) reported a systematic decrease in the modulation sensitivity with increasing carrier rate. However, the result of BP stimulation producing a significant decrease in modulation sensitivity compared with MP stimulation was observed at both low and high carrier rates in that study. Based on these reports by Middlebrooks, it is expected that the differences we observed between FMP, TP, and MP stimulation at the low carrier rate used in this study will be maintained when a higher carrier rate is used. Pfingst et al. (2007) found that in addition to higher MDTs for a 4,000 pps carrier rate compared with a 250 pps carrier rate, there was a significant interaction between carrier rate and stimulation site with lower modulation sensitivity at the apical stimulation site observed when the higher carrier rate was used. Therefore, it is also possible that the apical/basal differences found in our study would be different if a higher carrier rate was used.
In summary, the results from the present study demonstrated elevated MDTs using FMP and TP stimulation compared with MP stimulation at low stimulation levels. However, the current focusing techniques such as FMP and TP stimulation remain capable of conveying amplitude modulation at high stimulation levels, at least within the confines of the present study, which to our knowledge has not been demonstrated previously. Previous results from our laboratory have shown significant improvements in spatial selectivity as well as reduced channel interactions with FMP and TP stimulation compared with MP stimulation, even in cochleae with significant neural degeneration. Associating the present data to our previous studies highlights the possible trade-off between spectral and temporal fidelity with these current focusing techniques. The exact phenomenon that limits the modulation sensitivity of more restricted stimulation techniques is still not clear. Future work needs to be done to explore the mechanism by which phase locking to focused stimulation might impair transmission of modulating waveforms. In addition, it would be interesting to see if speech perception using FMP and TP stimulation would be different in take-home CI experiments with more complex listening tasks, such as listening to speech in background noise.
GRANTS
This study was funded by The Garnett Passe and Rodney Williams Memorial Foundation, Australian Research Council Linkage Project 48 130 100 220; and the National Health and Medical Research Council of Australia. S. S. George was supported by an Australian Postgraduate Award through the Australian Government and by the Bartholomew Reardon PhD Scholarship through the Bionics Institute.
DISCLOSURES
No conflicts of interest, financial or otherwise, are declared by the authors.
AUTHOR CONTRIBUTIONS
S.S.G., M.N.S., and J.B.F. conception and design of research; S.S.G. performed experiments; S.S.G. analyzed data; S.S.G., M.N.S., and J.B.F. interpreted results of experiments; S.S.G. prepared figures; S.S.G. drafted manuscript; S.S.G., M.N.S., and J.B.F. edited and revised manuscript; S.S.G., M.N.S., and J.B.F. approved final version of manuscript.
ACKNOWLEDGMENTS
We thank Dr. Philipp Senn for multi-channel stimulator engineering and support, Helen Feng for electrode manufacture and Dr. Sue Pierce for veterinary advice. The Bionics Institute acknowledges the support it receives from the Victorian Government through its Operational Infrastructure Support Program.
REFERENCES
- Berenstein CK, Mens LH, Mulder JJ, Vanpoucke FJ. Current steering and current focusing in cochlear implants: comparison of monopolar, tripolar, and virtual channel electrode configurations. Ear Hear 29: 250–260, 2008. [DOI] [PubMed] [Google Scholar]
- Bierer JA, Middlebrooks JC. Auditory cortical images of cochlear-implant stimuli: dependence on electrode configuration. J Neurophysiol 87: 478–492, 2002. [DOI] [PubMed] [Google Scholar]
- Bierer JA, Middlebrooks JC. Cortical responses to cochlear implant stimulation: channel interactions. J Assoc Res Otolaryngol 5: 32–48, 2004. [DOI] [PMC free article] [PubMed] [Google Scholar]
- Black RC, Clark GM, O'Leary SJ, Walters C. Intracochlear electrical stimulation of normal and deaf cats investigated using brainstem response audiometry. Acta Otolaryngol Suppl Stockh 399: 5–17, 1983. [DOI] [PubMed] [Google Scholar]
- Busby PA, Tong YC, Clark GM. The perception of temporal modulations by cochlear implant patients. J Acoust Soc Am 94: 124–131, 1993. [DOI] [PubMed] [Google Scholar]
- Casseday JH, Fremouw T, Covey E. The inferior colliculus: a hub for the central auditory system. In: Integrative Functions in the Mammalian Auditory Pathway. Springer Handbook of Auditory Research, edited by Oertel D, Fay R, Popper AN. New York: Springer, 2002, vol. 15, p. 238–318. [Google Scholar]
- Cazals Y, Pelizzone M, Saudan O, Boex C. Low-pass filtering in amplitude modulation detection associated with vowel and consonant identification in subjects with cochlear implants. J Acoust Soc Am 96: 2048–2054, 1994. [DOI] [PubMed] [Google Scholar]
- Chatterjee M, Galvin JJ 3rd, FU QJ, Shannon RV. Effects of stimulation mode, level and location on forward-masked excitation patterns in cochlear implant patients. J Assoc Res Otolaryngol 7: 15–25, 2006. [DOI] [PMC free article] [PubMed] [Google Scholar]
- Coco A, Epp SB, Fallon JB, Xu J, Millard RE, Shepherd RK. Does cochlear implantation and electrical stimulation affect residual hair cells and spiral ganglion neurons? Hear Res 225: 60–70, 2007. [DOI] [PMC free article] [PubMed] [Google Scholar]
- Colletti V, Shannon RV. Open set speech perception with auditory brainstem implant? Laryngoscope 115: 1974–1978, 2005. [DOI] [PubMed] [Google Scholar]
- De Ruiter AM, Debruyne JA, Chenault MN, Francart T, Brokx JP. Amplitude modulation detection and speech recognition in late-implanted prelingually and postlingually deafened cochlear implant users. Ear Hear 36: 557–566, 2015. [DOI] [PubMed] [Google Scholar]
- Donaldson GS, Nelson DA. Place-pitch sensitivity and its relation to consonant recognition by cochlear implant listeners using the MPEAK and SPEAK speech processing strategies. J Acoust Soc Am 107: 1645–1658, 2000. [DOI] [PubMed] [Google Scholar]
- Dorman MF. Speech perception by adults. In: Cochlear Implants: Audiological Foundations, edited by Tyler RS. San Diego, CA: Singular, 1993. [Google Scholar]
- Fallon JB, Irvine DR, Shepherd RK. Cochlear implant use following neonatal deafness influences the cochleotopic organization of the primary auditory cortex in cats. J Comp Neurol 512: 101–114, 2009. [DOI] [PMC free article] [PubMed] [Google Scholar]
- Fallon JB, Shepherd RK, Nayagam DA, Wise AK, Heffer LF, Landry TG, Irvine DR. Effects of deafness and cochlear implant use on temporal response characteristics in cat primary auditory cortex. Hear Res 315: 1–9, 2014. [DOI] [PubMed] [Google Scholar]
- Fernández C. Dimensions of the cochlea (guinea pig). J Acoust Soc Am 24: 519–523, 1952. [Google Scholar]
- Fielden CA, Kluk K, Boyle PJ, McKay CM. The perception of complex pitch in cochlear implants: a comparison of monopolar and tripolar stimulation. J Acoust Soc Am 138: 2524–2536, 2015. [DOI] [PubMed] [Google Scholar]
- Friesen LM, Shannon RV, Baskent D, Wang X. Speech recognition in noise as a function of the number of spectral channels: comparison of acoustic hearing and cochlear implants. J Acoust Soc Am 110: 1150–1163, 2001. [DOI] [PubMed] [Google Scholar]
- Fu QJ. Temporal processing and speech recognition in cochlear implant users. Neuroreport 13: 1635–1639, 2002. [DOI] [PubMed] [Google Scholar]
- Fu QJ, Chinchilla S, Galvin JJ. The role of spectral and temporal cues in voice gender discrimination by normal-hearing listeners and cochlear implant users. J Assoc Res Otolaryngol 5: 253–260, 2004. [DOI] [PMC free article] [PubMed] [Google Scholar]
- Fu QJ, Shannon RV, Wang X. Effects of noise and spectral resolution on vowel and consonant recognition: acoustic and electric hearing. J Acoust Soc Am 104: 3586–3596, 1998. [DOI] [PubMed] [Google Scholar]
- Galvin JJ 3rd, Fu QJ. Influence of stimulation rate and loudness growth on modulation detection and intensity discrimination in cochlear implant users. Hear Res 250: 46–54, 2009. [DOI] [PMC free article] [PubMed] [Google Scholar]
- Garadat SN, Zwolan TA, Pfingst BE. Across-site patterns of modulation detection: relation to speech recognition. J Acoust Soc Am 131: 4030–4041, 2012. [DOI] [PMC free article] [PubMed] [Google Scholar]
- George SS, Shivdasani MN, Wise AK, Shepherd RK, Fallon JB. Electrophysiological channel interactions using focused multipolar stimulation for cochlear implants. J Neural Eng 12: 066005, 2015a. [DOI] [PubMed] [Google Scholar]
- George SS, Wise AK, Fallon JB, Shepherd RK. Evaluation of focused multipolar stimulation for cochlear implants in long-term deafened cats. J Neural Eng 12: 036003, 2015b. [DOI] [PubMed] [Google Scholar]
- George SS, Wise AK, Shivdasani MN, Shepherd RK, Fallon JB. Evaluation of focused multipolar stimulation for cochlear implants in acutely deafened cats. J Neural Eng 11: 065003, 2014. [DOI] [PubMed] [Google Scholar]
- Gnansia D, Lazard DS, Leger AC, Fugain C, Lancelin D, Meyer B, Lorenzi C. Role of slow temporal modulations in speech identification for cochlear implant users. Int J Audiol 53: 48–54, 2014. [DOI] [PubMed] [Google Scholar]
- Goldberg JM, Brown PB. Response of binaural neurons of dog superior olivary complex to dichotic tonal stimuli: some physiological mechanisms of sound localization. J Neurophysiol 32: 613–636, 1969. [DOI] [PubMed] [Google Scholar]
- Green DM, Swets JA. Signal Detection Theory and Psychophysics. New York: Wiley, 1966. [Google Scholar]
- Hardie NA, Shepherd RK. Sensorineural hearing loss during development: morphological and physiological response of the cochlea and auditory brainstem. Hear Res 128: 147–165, 1999. [DOI] [PubMed] [Google Scholar]
- Heffer LF, Fallon JB. A novel stimulus artifact removal technique for high-rate electrical stimulation. J Neurosci Methods 170: 277–284, 2008. [DOI] [PMC free article] [PubMed] [Google Scholar]
- Irvine DR. Physiology of the auditory brainstem. In: The Mammalian Auditory Pathway: Neurophysiology, edited by Popper AN, Fay RR. Berlin: Springer, 1992, vol. 1, p. 153–231. [Google Scholar]
- Kalkman RK, Briaire JJ, Frijns JH. Current focusing in cochlear implants: an analysis of neural recruitment in a computational model. Hear Res 322: 89–98, 2015. [DOI] [PubMed] [Google Scholar]
- Kral A, Hartmann R, Mortazavi D, Klinke R. Spatial resolution of cochlear implants: the electrical field and excitation of auditory afferents. Hear Res 121: 11–28, 1998. [DOI] [PubMed] [Google Scholar]
- Krishna BS, Semple MN. Auditory temporal processing: responses to sinusoidally amplitude-modulated tones in the inferior colliculus. J Neurophysiol 84: 255–273, 2000. [DOI] [PubMed] [Google Scholar]
- Landry TG, Fallon JB, Wise AK, Shepherd RK. Chronic neurotrophin delivery promotes ectopic neurite growth from the spiral ganglion of deafened cochleae without compromising the spatial selectivity of cochlear implants. J Comp Neurol 521: 2818–2832, 2013. [DOI] [PMC free article] [PubMed] [Google Scholar]
- Macmillan NA, Creelman CD. Detection Theory: A User's Guide. Mahwah, NJ: Lawrence Erlbaum, 2005. [Google Scholar]
- Marozeau J, McDermott HJ, Swanson BA, McKay CM. Perceptual interactions between electrodes using focused and monopolar cochlear stimulation. J Assoc Res Otolaryngol 16: 401–412, 2015. [DOI] [PMC free article] [PubMed] [Google Scholar]
- McDermott HJ, McKay CM, Vandali AE. A new portable sound processor for the University of Melbourne/Nucleus Limited multielectrode cochlear implant. J Acoust Soc Am 91: 3367–3371, 1992. [DOI] [PubMed] [Google Scholar]
- Mens LH, Berenstein CK. Speech perception with mono- and quadrupolar electrode configurations: a crossover study. Otol Neurotol 26: 957–964, 2005. [DOI] [PubMed] [Google Scholar]
- Middlebrooks JC. Auditory cortex phase locking to amplitude-modulated cochlear implant pulse trains. J Neurophysiol 100: 76–91, 2008a. [DOI] [PMC free article] [PubMed] [Google Scholar]
- Middlebrooks JC. Cochlear-implant high pulse rate and narrow electrode configuration impair transmission of temporal information to the auditory cortex. J Neurophysiol 100: 92–107, 2008b. [DOI] [PMC free article] [PubMed] [Google Scholar]
- Middlebrooks JC, Snyder RL. Selective electrical stimulation of the auditory nerve activates a pathway specialized for high temporal acuity. J Neurosci 30: 1937–1946, 2010. [DOI] [PMC free article] [PubMed] [Google Scholar]
- Nie K, Barco A, Zeng FG. Spectral and temporal cues in cochlear implant speech perception. Ear Hear 27: 208–217, 2006. [DOI] [PubMed] [Google Scholar]
- Perry DW. Temporal Processing in the Deafened Auditory Cortex (PhD thesis) Melbourne, Australia: The University of Melbourne, 2012. [Google Scholar]
- Pfingst BE. Effects of electrode configuration on cochlear implant modulation detection thresholds. J Acoust Soc Am 129: 3908–3915, 2011. [DOI] [PMC free article] [PubMed] [Google Scholar]
- Pfingst BE, Burkholderjuhasz RA, Xu L, Thompson CS. Across-site patterns of modulation detection in listeners with cochlear implants. J Acoust Soc Am 123: 1054–1062, 2008. [DOI] [PMC free article] [PubMed] [Google Scholar]
- Pfingst BE, Franck KH, Xu L, Bauer EM, Zwolan TA. Effects of electrode configuration and place of stimulation on speech perception with cochlear prostheses. J Assoc Res Otolaryngol 2: 87–103, 2001. [DOI] [PMC free article] [PubMed] [Google Scholar]
- Pfingst BE, Xu L, Thompson CS. Effects of carrier pulse rate and stimulation site on modulation detection by subjects with cochlear implants. J Acoust Soc Am 121: 2236–2246, 2007. [DOI] [PMC free article] [PubMed] [Google Scholar]
- Pfingst BE, Zwolan TA, Holloway LA. Effects of stimulus configuration on psychophysical operating levels and on speech recognition with cochlear implants. Hear Res 112: 247–260, 1997. [DOI] [PubMed] [Google Scholar]
- Read HL, Winer JA, Schreiner CE. Functional architecture of auditory cortex. Curr Opin Neurobiol 12: 433–440, 2002. [DOI] [PubMed] [Google Scholar]
- Sato M, Baumhoff P, Kral A. Cochlear implant stimulation of a hearing ear generates separate electrophonic and electroneural responses. J Neurosci 36: 54–64, 2016. [DOI] [PMC free article] [PubMed] [Google Scholar]
- Senn P. Peripheral Nerve Stimulation for the Treatment of Chronic Neuropathic Pain (PhD thesis) Melbourne, Australia: University of Melbourne, 2014. [Google Scholar]
- Shannon RV. Temporal modulation transfer functions in patients with cochlear implants. J Acoust Soc Am 91: 2156–2164, 1992. [DOI] [PubMed] [Google Scholar]
- Shepherd R, Verhoeven K, Xu J, Risi F, Fallon J, Wise A. An improved cochlear implant electrode array for use in experimental studies. Hear Res 277: 20–27, 2011. [DOI] [PMC free article] [PubMed] [Google Scholar]
- Skinner MW, Clark GM, Whitford LA, Seligman PM, Staller SJ, Shipp DB, Shallop JK, Everingham C, Menapace CM, Arndt PL. Evaluation of a new spectral peak coding strategy for the Nucleus 22 channel cochlear implant system. Otol Neurotol 15: 15–27, 1994. [PubMed] [Google Scholar]
- Smith ZM, Parkinson WS, Long CJ. Multipolar current focusing increases spectral resolution in cochlear implants. Conf Proc IEEE Eng Med Biol Soc 2013: 2796–2799, 2013. [DOI] [PubMed] [Google Scholar]
- Snyder RL, Rebscher SJ, Cao KL, Leake PA, Kelly K. Chronic intracochlear electrical stimulation in the neonatally deafened cat. I: Expansion of central representation. Hear Res 50: 7–33, 1990. [DOI] [PubMed] [Google Scholar]
- Souza PE, Wright RA, Blackburn MC, Tatman R, Gallun FJ. Individual sensitivity to spectral and temporal cues in listeners with hearing impairment. J Speech Lang Hear Res 58: 520–534, 2015. [DOI] [PMC free article] [PubMed] [Google Scholar]
- Srinivasan AG, Landsberger DM, Shannon RV. Current focusing sharpens local peaks of excitation in cochlear implant stimulation. Hear Res 270: 89–100, 2010. [DOI] [PMC free article] [PubMed] [Google Scholar]
- Stephens M. Tests for randomness of directions against two circular alternatives. J Am Stat Assoc 64: 280–289, 1969. [Google Scholar]
- Sucher CM, McDermott HJ. Pitch ranking of complex tones by normally hearing subjects and cochlear implant users. Hear Res 230: 80–87, 2007. [DOI] [PubMed] [Google Scholar]
- Thorne M, Salt AN, DeMott JE, Henson MM, Henson OW Jr, Gewalt SL. Cochlear fluid space dimensions for six species derived from reconstructions of three-dimensional magnetic resonance images. Laryngoscope 109: 1661–1668, 1999. [DOI] [PubMed] [Google Scholar]
- van den Honert C, Kelsall DC. Focused intracochlear electric stimulation with phased array channels. J Acoust Soc Am 121: 3703–3716, 2007. [DOI] [PubMed] [Google Scholar]
- van den Honert C, Stypulkowski PH. Single fiber mapping of spatial excitation patterns in the electrically stimulated auditory nerve. Hear Res 29: 195–206, 1987. [DOI] [PubMed] [Google Scholar]
- Wada H, Sugawara M, Kobayashi T, Hozawa K, Takasaka T. Measurement of guinea pig basilar membrane using computer-aided three-dimensional reconstruction system. Hear Res 120: 1–6, 1998. [DOI] [PubMed] [Google Scholar]
- Wilson BS, Finley CC, Lawson DT, Wolford RD, Eddington DK, Rabinowitz WM. Better speech recognition with cochlear implants. Nature 352: 236–238, 1991. [DOI] [PubMed] [Google Scholar]
- Won JH, Drennan WR, Nie K, Jameyson EM, Rubinstein JT. Acoustic temporal modulation detection and speech perception in cochlear implant listeners. J Acoust Soc Am 130: 376–388, 2011. [DOI] [PMC free article] [PubMed] [Google Scholar]
- Won JH, Moon IJ, Jin S, Park H, Woo J, Cho YS, Chung WH, Hong SH. Spectrotemporal modulation detection and speech perception by cochlear implant users. PLoS One 10: e0140920, 2015. [DOI] [PMC free article] [PubMed] [Google Scholar]
- Xu L, Pfingst BE. Spectral and temporal cues for speech recognition: implications for auditory prostheses. Hear Res 242: 132–140, 2008. [DOI] [PMC free article] [PubMed] [Google Scholar]
- Xu L, Thompson CS, Pfingst BE. Relative contributions of spectral and temporal cues for phoneme recognition. J Acoust Soc Am 117: 3255–3267, 2005. [DOI] [PMC free article] [PubMed] [Google Scholar]
- Zwolan TA, Kileny PR, Ashbaugh C, Telian SA. Patient performance with the Cochlear Corporation “20+ 2” implant: bipolar versus monopolar activation. Otol Neurotol 17: 717–723, 1996. [PubMed] [Google Scholar]


