

Abstract
The brain is critically dependent on the regulation of blood flow to nourish active neurons. One widely held hypothesis of blood flow regulation holds that active neurons stimulate Ca2+ increases in glial cells, triggering glial release of vasodilating agents. This hypothesis has been challenged, as arteriole dilation can occur in the absence of glial Ca2+ signaling. We address this controversy by imaging glial Ca2+ signaling and vessel dilation in the mouse retina. We find that sensory stimulation results in Ca2+ increases in the glial endfeet contacting capillaries, but not arterioles, and that capillary dilations often follow spontaneous Ca2+ signaling. In IP3R2−/− mice, where glial Ca2+ signaling is reduced, light-evoked capillary, but not arteriole, dilation is abolished. The results show that, independent of arterioles, capillaries actively dilate and regulate blood flow. Furthermore, the results demonstrate that glial Ca2+ signaling regulates capillary but not arteriole blood flow.
SIGNIFICANCE STATEMENT We show that a Ca2+-dependent glial cell signaling mechanism is responsible for regulating capillary but not arteriole diameter. This finding resolves a long-standing controversy regarding the role of glial cells in regulating blood flow, demonstrating that glial Ca2+ signaling is both necessary and sufficient to dilate capillaries. While the relative contributions of capillaries and arterioles to blood flow regulation remain unclear, elucidating the mechanisms that regulate capillary blood flow may ultimately lead to the development of therapies for treating diseases where blood flow regulation is disrupted, including Alzheimer's disease, stroke, and diabetic retinopathy. This finding may also aid in revealing the underlying neuronal activity that generates BOLD fMRI signals.
Keywords: blood flow, calcium signaling, capillary, glia, neurovascular coupling, retina
Introduction
Blood flow in the CNS increases in response to local neuronal activity, a phenomenon termed functional hyperemia (Attwell et al., 2010). This response, first described in the late 19th century (Mosso, 2014; Roy and Sherrington, 1890), is essential for CNS function, as it supplies needed oxygen and nutrients to active neurons. Disruption of CNS blood flow is believed to contribute to several CNS pathologies, including stroke (Girouard and Iadecola, 2006; Hamilton et al., 2010), Alzheimer's disease (Girouard and Iadecola, 2006; Nicolakakis and Hamel, 2011), hypertension-induced cognitive deficits (Jennings et al., 2005; Girouard and Iadecola, 2006; Iadecola and Davisson, 2008), and diabetic retinopathy (Garhöfer et al., 2004; Mishra and Newman, 2010). Functional hyperemia is measured when generating BOLD fMRI functional brain images (Attwell and Iadecola, 2002; Logothetis and Wandell, 2004). Interpreting the underlying neuronal activity from blood flow changes detected by BOLD fMRI requires an understanding of how functional hyperemia arises.
Despite its critical importance to brain function, many aspects of functional hyperemia remain controversial (Attwell et al., 2010). In particular, neurovascular coupling mechanisms, the signaling mechanisms linking neuronal activity to the dilation of blood vessels, are poorly understood. One widely held hypothesis of functional hyperemia holds that signaling from active neurons to blood vessels is mediated by astroglial cells, whose endfoot processes envelop vessels. According to this hypothesis, neuronal activity induces a rise in free Ca2+ within astroglia, stimulating the glial synthesis and release of vasodilating arachidonic acid metabolites onto blood vessels (Iadecola and Nedergaard, 2007; Attwell et al., 2010). In support of this hypothesis, several groups have observed that astroglial Ca2+ increases precede vessel dilation (Wang et al., 2006; Lind et al., 2013; Otsu et al., 2015) and that raising astroglial Ca2+ evokes vasodilatations (Metea and Newman, 2006; Takano et al., 2006; Gordon et al., 2008). However, this hypothesis has been challenged by others who have found that arterioles dilate in the absence of astroglial Ca2+ increases (Nizar et al., 2013; Bonder and McCarthy, 2014) and that arteriole dilations remain intact in IP3R2−/− transgenic mice, where astroglial Ca2+ signaling is reduced (Nizar et al., 2013; Bonder and McCarthy, 2014).
A second key question related to functional hyperemia is whether capillaries actively regulate blood flow (Hamilton et al., 2010). Arterioles are surrounded by contractile smooth muscle cells, which relax in response to neuronal activity. Capillaries lack smooth muscle cells but are partially covered by pericytes, which extend processes that surround the vessels (Hamilton et al., 2010). Although previous studies have shown pericytes to be contractile (Schönfelder et al., 1998; Peppiatt et al., 2006) and to actively regulate capillary diameter (Chaigneau et al., 2003; Hall et al., 2014), the role of pericytes in regulating blood flow has been challenged (Fernández-Klett et al., 2010; Hill et al., 2015). Specifically, a recent study concluded that capillary pericytes do not express α-smooth muscle actin, the structural protein required for constriction and relaxation, and thus cannot actively regulate capillary diameter (Hill et al., 2015).
We now address these two key questions central to functional hyperemia: whether neurovascular coupling is mediated by a Ca2+-dependent astroglial signaling mechanism and whether capillaries actively regulate blood flow. Experiments were conducted on the retina, an integral part of the CNS where functional hyperemia is well developed (Riva et al., 2005; Kornfield and Newman, 2014). Astroglial Ca2+ signaling and blood vessel diameter were monitored in response to increased neuronal activity induced by photic stimulation. Our results demonstrate that capillaries actively dilate in response to stimulation and that astroglial Ca2+ signaling is both necessary and sufficient to dilate capillaries. However, arteriole dilation is not dependent on astroglia Ca2+ signaling.
Materials and Methods
Ethics statement.
All experimental procedures were approved by and adhered to the guidelines of the Institutional Animal Care and Use Committee of the University of Minnesota.
Animals.
Male and female mice 13–25 weeks of age were used in all experiments. Animals were housed with a 12 h light/dark cycle, three to five females per cage and two to four males per cage. Transgenic R26-lsl-GCaMP3 mice were crossed with GLAST-CreER mice (The Jackson Laboratory, RRID:IMSR_JAX:012586) to create heterozygotes expressing GCaMP3 in Müller cells. IP3R2+/− mice with the C57BL/6 background were obtained from Dr. J. Chen (University California, San Diego, La Jolla, CA) were bred to create IP3R2−/− and control littermates. IP3R2−/− mice were crossed with GLAST-CreER;R26-lsl-GCaMP3 mice to create GLAST-CreER;R26-lsl-GCaMP3;IP3R2−/− mice. Mice received one intraperitoneal injection per day of 100 mg/kg tamoxifen in sunflower oil for 7 d to induce GCaMP3 expression. Experiments were performed 14–18 d following the final injection. When feasible, animals were pseudorandomly selected by someone other than the experimenter for each experiment. The experimenter was blind to genotype for control and IP3R2−/− comparisons.
Eyecup preparation.
Mice were anesthetized with isoflurane and decapitated. Eyes were removed, bisected, and clamped in a custom perfusion chamber equipped with transretinal electroretinogram (ERG) electrodes (Newman and Bartosch, 1999). Retinas were superfused with oxygenated bicarbonate buffer. For Ca2+ imaging experiments, 95% O2 was used. For experiments imaging vascular responses, 40% O2 was used, which was the lowest O2 concentration that could be used for the eyecup without compromising preparation health (data not shown). ERGs and single-unit recordings from retinal ganglion cells were monitored to determine retinal responses to photic stimulation. Flicker ERGs were monitored periodically during experiments to ensure that the preparation remained healthy.
Light stimulation.
Eyecups were stimulated with a 5 Hz, 10% duty cycle diffuse flickering light, filtered with a 500 nm short-pass filter to prevent imaging artifacts. Light intensity was 300 lux at the eyecup surface.
Calcium imaging in eyecups.
GCaMP3 fluorescence was imaged with confocal microscopy (Olympus, FV1000) through a 20×, 1.00 numerical aperture (NA) water superobjective. Movies were acquired at 13.3 Hz. When measuring Ca2+ intensity, GCaMP3 fluorescence was monitored within regions of interest drawn around Müller cell fine processes or endfeet. A second-order exponential was fitted and subtracted from the signal to remove the decay due to photobleaching. Each movie frame was divided by baseline intensity to obtain ΔF/F images. When identifying individual Ca2+ transients, movies were processed by a custom MATLAB routine that analyzed the variance of each pixel of the movie frames. Images were low-pass filtered with a Gaussian blur function to reduce noise. A Ca2+ increase was considered a discrete transient when the GCaMP3 intensity of a cluster of >35 pixels (2.8 μm diameter) exceeded 3 SDs above baseline noise. Transient duration was determined by the width at half-maximal amplitude of the mean of all traces. Transient frequency per cubic micrometer or per millimeter of vessel length was calculated using the frequency of observed Ca2+ transients in the imaging plane, the depth of field of confocal imaging, and the vessel length per imaged frames. Latency of the averaged GCaMP3 intensity responses was determined as the point where the intensity reached 33% of the peak. Due to the 13.33 Hz acquisition rate and the Gaussian filters used, this latency is an approximation.
Measurement of vessel diameter.
For eyecup experiments, vessels were labeled by perfusion of either rhodamine-dextran [70,000 molecular weight (MW); 0.85%, 2 ml; Sigma, R9379] or FITC-dextran (2,000,000 MW; 0.6%, 2 ml; Sigma, FD2000S) before enucleation. Eyecups were superfused with U46619, a thromboxane A2 receptor agonist, in ethanol (Cayman Chemical, 16450; 200 nm for capillary experiments, 100 nm for arteriole experiments) to generate vessel tone. Vessels were identified by their diameter (>15 μm for arterioles, <10 μm for capillaries), branching pattern, and retinal depth, as described previously (Kornfield and Newman, 2014). Fluorescently labeled vessels were imaged with confocal microscopy, and vessel diameter was measured with a custom MATLAB routine, as described previously (Kornfield and Newman, 2014). For each imaging site, four trials per capillary or arteriole were averaged to reduce noise. Baseline diameter drift was subtracted from the averaged traces. Trials with vessel oscillations or with extensive tissue drift were excluded. The submicron dilations of capillaries were smaller than the diffraction limit. However, averaging repeated trials allows for the accurate measurement of the dilations (Shahram and Milanfar, 2004).
Calcium waves.
Calcium waves propagating through Müller cells were evoked by 20 ms, −3 μA current pulses passed through glass micropipettes (tip diameter, ∼0.5 μm; filled with 3 m KCl) advanced into the intermediate capillary layer, ∼30 μm from the capillary of interest.
ATP responses.
Müller cell Ca2+ responses evoked by ATP were measured in eyecups labeled with the Ca2+ indicator dye Fluo-4 AM. Eyecups were incubated in 60 μm Fluo-4 AM in DMSO (Thermo Fisher Scientific, F14201) and 200 μm pluronic in DMSO (Thermo Fisher Scientific, P6867) for 40 min. Labeled eyecups were perfused at room temperature with 32 mm bicarbonate buffer bubbled with 95% O2, 5% CO2. Müller cell Ca2+ signals were imaged in the inner plexiform layer.
Electrophysiology.
Flicker ERGs were recorded with extracellular electrodes on the vitreal and scleral sides of the eyecup and bandpass filtered at 1–100 Hz. Retinal ganglion cell spike activity was recorded with glass micropipettes (tip diameter, ∼1.5 μm; filled with bicarbonate buffer), bandpass filtered at 300 Hz to 1.8 kHz.
Solutions.
For Ca2+ imaging, eyecups were superfused with 32 mm bicarbonate buffer containing (in mm) 111 NaCl, 3 KCl, 2 CaCl2, 1 MgSO4, 0.5 NaH2PO4, 15 dextrose, and 32 NaHCO3, bubbled with 95% O2, 5% CO2, pH 7.4, and heated to ∼33°C. To maintain vascular health while imaging capillaries or arterioles, eyecups were superfused with a similar 26 mm bicarbonate buffer bubbled with 55% N2, 40% O2, and 5% CO2, pH 7.4, and heated to ∼33°C.
In vivo preparation.
Mice were anesthetized with 2% isoflurane and the femoral artery cannulated for continuous blood pressure monitoring and delivery of anesthetics. Mice were tracheotomized for mechanical ventilation and monitoring of end-expiratory CO2 and placed in a custom stereotaxic holder (Srienc et al., 2012). Atropine sulfate (Falcon Pharmaceuticals, catalog #61314-303-02) was applied to the eye to dilate the pupil and a contact lens placed over the cornea. A heating blanket maintained the animal's body temperature at 37°C. Following surgery, mice were anesthetized with 0.6 mg/ml α-chloralose (Sigma catalog #C8849; 0.1–0.3 ml bolus; 0.30–0.40 ml/hr infusion), and the paralytic gallamine triethiodide (Sigma, catalog #G8124; 20 mg/kg bolus approximately every hour) was administered to reduce eye movements and facilitate mechanical ventilation. Mice were ventilated (SAR-1000; CWE) with 30% O2/70% N2 at 105 breaths/min with a tidal volume of ∼0.12 ml, a 1:2 inspiration/expiration fraction, and a 2 mmHg positive end-expiratory pressure. Arterial O2 saturation (MouseOx, Starr Life Sciences) and end-tidal CO2 (microCapStar, CWE) were monitored continuously, and ventilation parameters adjusted to maintain O2 saturation and expired CO2 within normal limits (sO2, 96.7 ± 0.5%; end-tidal CO2, 37.9 ± 2.2 mmHg). Large tidal volume breaths were given every 15–30 min to maintain lung ventilation. The retina was imaged with confocal microscopy (Olympus FV1000) through the contact lens and a 4×, dry, 0.16 NA objective. Mice were killed at the end of experimentation with intra-arterial injection of potassium chloride (2 mEq/kg). A 5 Hz, diffuse, white flickering light with an intensity of ∼30 klux at the surface of the globe was used to stimulate the retina. Vessels were labeled by femoral artery injection of FITC-dextran (1.5%, 0.15 ml). Vessel imaging and analysis were performed as described for the eyecup preparation.
Immunohistochemistry.
Retinas were fixed for 1 h in 4% paraformaldehyde in PBS at 4°C, washed in PBS, and stored at 4°C. Retinas were blocked in 10% donkey serum (Jackson ImmunoResearch) and 1% Triton X-100 for 2 h at 4°C and incubated in primary antibodies at 4°C for 3 d (mouse-CRALBP, 1:500, Novus Biologicals, catalog #NB100-74392, RRID:AB_2253681; chicken-GFP, 1:1000, Invitrogen, catalog #A10262, RRID:AB_2534023; goat-GFAP, 1:250, Santa Cruz Biotechnology, catalog #sc-6170, RRID:AB_641021; rabbit–NG2, 1:500, Millipore, catalog #AB5320, RRID:AB_91789). After six PBS washes, retinas were incubated in secondary antibodies at 4°C (isolectin GS-IB4-647, 1:75, Invitrogen, catalog #I32450, RRID:SCR_014365; goat anti-mouse subclass 1 specific-647, 1:200, Jackson ImmunoResearch, catalog #115-605-205, RRID:AB_2338916; goat anti-chicken-488, 1:1000, Invitrogen, catalog #A11039, RRID:AB_142924; donkey anti-goat-647, 1:1000, Invitrogen, catalog #A21447, RRID:AB_141844) for 2 d. Retinas were then mounted, sealed with Vectashield mounting media (Vector Laboratories, H-1000) or with Vectashield-DAPI (1.5 μg/ml, Vector Laboratories, H-1200), and imaged with confocal microscopy.
Statistics.
Data reported in the text are expressed as (and error bars in the figures represent) mean ± SEM. p values are from two-sided t tests or paired t tests for parametric data, and Mann–Whitney U tests or Wilcoxon matched pairs signed rank tests for nonparametric data. Two-way ANOVAs were performed for multiple comparisons followed by post hoc Bonferroni's tests. Each data set was tested for normal distribution using the Shapiro–Wilks test. Significance was defined as p < 0.05. Samples sizes were based on effect size and signal-to-noise ratio in preliminary experiments. All analyses were performed in MATLAB R2013b (RRID:SCR_001622) or GraphPad Prism 5 (RRID:SCR_002798).
Data availability.
All relevant data are available from the corresponding author upon request.
Code availability.
MATLAB routines used in data analysis are available from the corresponding author upon request.
Results
GCaMP3 expression in Müller cells
We monitored Ca2+ signaling within Müller cells, the principal astroglial cells of the retina (Newman and Reichenbach, 1996), using the genetically encoded calcium indicator GCaMP3. Recordings were made from the ex vivo eyecup preparation (Newman and Bartosch, 1999), where Ca2+ signaling can be monitored at high spatial resolution with confocal microscopy. GCaMP3 was expressed selectively in Müller cells using the transgenic mouse line GLAST-CreER;R26-lsl-GCaMP3 (Shigetomi et al., 2013; Paukert et al., 2014; Rosa et al., 2015), which drives tamoxifen-dependent expression of GCaMP3 under the GLAST promoter. Müller cells are radial astroglial cells that extend from the vitreal surface at the inner border of the retina to the photoreceptors in the outer retina (Newman and Reichenbach, 1996). Like astrocytes in the brain, Müller cells have fine processes that surround neuronal synapses in plexiform (synaptic) layers of the retina and endfeet that contact arterioles, venules, and capillaries (Newman and Reichenbach, 1996; Fig. 1A). After tamoxifen induction, the transgenic mice expressed GCaMP3 in 93.6 ± 2% (n = 4 eyecups) of Müller cells. No expression was observed in astrocytes in the nerve fiber layer (Fig. 1D), which do not express the GLAST transporter (Harada et al., 1998), or in neurons in the ganglion cell or nuclear layers (Fig. 1B,F). It is unlikely that GCaMP3 is expressed in neuronal somata or processes for several reasons: (1) The GCaMP3 labeling we observed was precisely colocalized with the Müller cell marker CRALBP (Fig. 1B,F) and closely matched Müller cell morphology, including the endfoot processes surrounding blood vessels (see Figs. 4B, 5B). (2) The GCaMP3 Ca2+ transients we observed closely resemble glial Ca2+ transients reported in prior work (Shigetomi et al., 2013; Srinivasan et al., 2015; see Fig. 3). (3) The Ca2+ responses we observed to light stimulation have latencies that are several hundred milliseconds slower than the latencies of neuronal Ca2+ responses in the retina, which are <200 ms (Borghuis et al., 2011).
Figure 1.
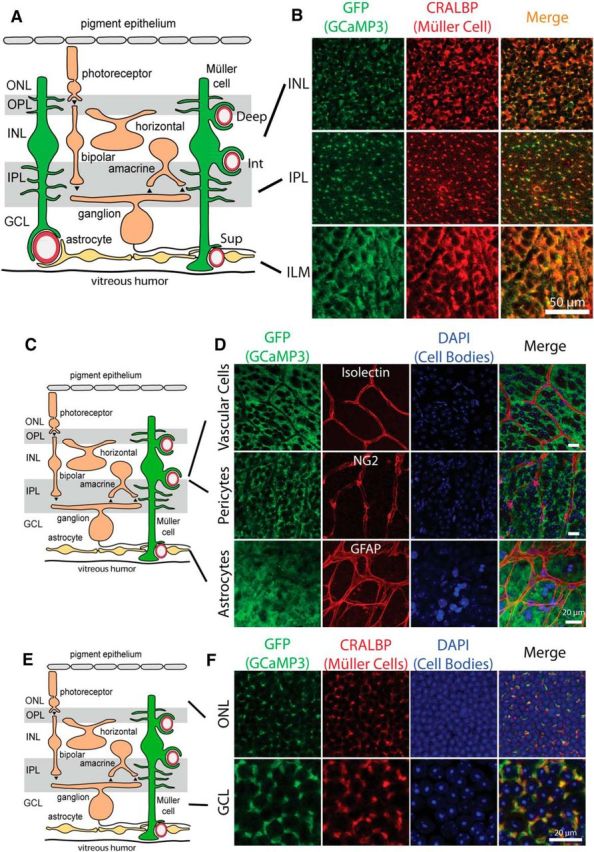
GCaMP3 is exclusively expressed in Müller cells. A, Müller glial cells extend fine processes in the inner plexiform layer (IPL) and the outer plexiform layer (OPL) and endfeet that surround arterioles and capillaries in the three capillary layers: superficial (Sup), intermediate (Int), and deep (Deep). GCL, Ganglion cell layer; INL, inner nuclear layer; ONL, outer nuclear layer. B, Colocalization of GCaMP3 (detected with anti-GFP) and cellular retinaldihyde binding protein (CRALBP), a Müller cell marker, demonstrates that GCaMP3 is exclusively expressed in Müller cells. Similar results were obtained from retinas from four mice. C, Schematic of the retina. D, Colocalization of GCaMP3 with cell markers for vascular cells (Isolectin B4), pericytes (anti-NG2), and astrocytes (anti-GFAP) reveal no GCaMP3 expression in these cell types. Similar results were obtained from 2 other retinas for each cell type. Scale bars, 20 μm. E, Schematic of the retina. F, Neuronal cell bodies in the ganglion cell layer and the outer nuclear layer show no GCaMP3 expression. Müller cell stalks, identified by CRALBP labeling, lie between the neuronal cell bodies. Similar results were obtained from three other retinas.
Figure 4.

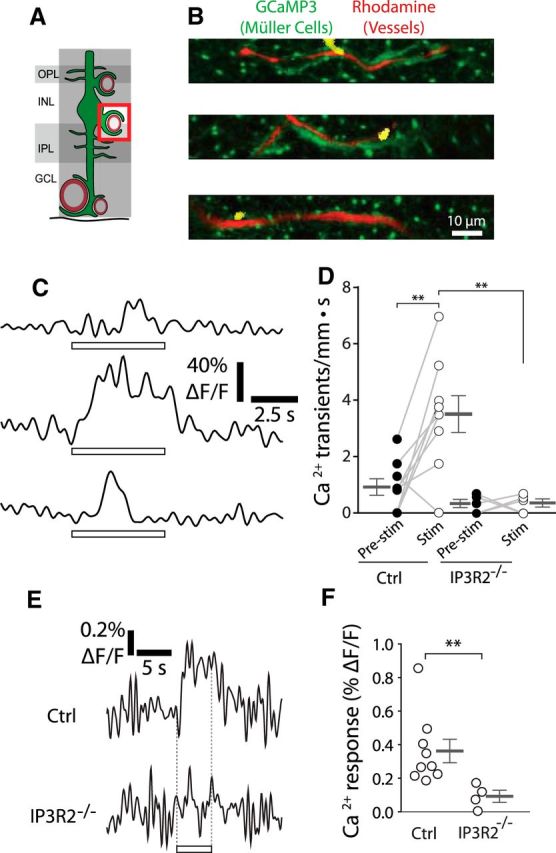
Stimulus-evoked Ca2+ signaling is absent in Müller cell endfeet contacting arterioles. A, Calcium signaling was monitored in Müller cell endfeet contacting arterioles. GCL, Ganglion cell layer; INL, inner nuclear layer; IPL, inner plexiform layer; OPL, outer plexiform layer. B, Example of a spontaneous endfoot Ca2+ transient along an arteriole. Similar images were obtained for 12 other Ca2+ transients from nine eyecups. The locations of the Ca2+ transients (yellow) are overlaid on images of GCaMP3-labeled Müller cells (green) and rhodamine-filled capillaries (red). C, Trace of the Ca2+ transient in B. D, Endfoot transients along arterioles occur at a low spontaneous rate (transients per millimeter of arteriole length per s) and do not increase during stimulation (n = 9 eyecups; Wilcoxon matched pairs signed rank test, p = 0.92; pre-stim, 0.55 ± 0.19 Ca2+ transients/mm · s; stim, 0.45 ± 0.19 Ca2+ transients/mm · s). E, Mean Ca2+ signaling across endfeet contacting arterioles shows no stimulus-evoked Ca2+ increase (n = 9 eyecups; paired t test, p = 0.32; pre-stim, 0.069 ± 0.045% ΔF/F; stim, −0.036 ± 0.088% ΔF/F).
Figure 5.
Stimulus-evoked Ca2+ signaling occurs in Müller cell endfeet contacting intermediate layer capillaries. A, Calcium signaling was monitored in Müller cell endfeet contacting intermediate layer capillaries. GCL, Ganglion cell layer; INL, inner nuclear layer; IPL, inner plexiform layer; OPL, outer plexiform layer. B, Examples of endfoot Ca2+ transients along intermediate layer capillaries. Imaging is the same as in Figure 3B. Similar images were obtained for 45 Ca2+ transients from nine eyecups. C, Traces of the Ca2+ transients in B. D, The frequency of endfoot Ca2+ transients (transients per millimeter of capillary length per s) increased during stimulation in control mice (Ctrl, p = 0.0046). Stimulus-evoked (stim; p = 0.0044) transient frequency was reduced in IP3R2−/− mice (n = 9 control eyecups, 5 IP3R2−/− eyecups; two-way ANOVA with Bonferroni posttest; control pre-stim, 0.91 ± 0.29 Ca2+ transients/mm · s; control stim, 3.5 ± 0.65 Ca2+ transients/mm · s; IP3R2−/− pre-stim, 0.32 ± 0.065 Ca2+ transients/mm · s; IP3R2−/− stim, 0.34 ± 0.069 Ca2+ transients/mm · s). E, Mean stimulus-evoked Ca2+ activity across all endfeet in control and IP3R2−/− mice. F, Amplitude of stimulus-evoked Ca2+ responses in E (n = 9 control eyecups, 4 IP3R2−/− eyecups; Mann–Whitney U test, p = 0.0028; control, 0.36 ± 0.070% ΔF/F; IP3R2−/−, 0.092 ± 0.035% ΔF/F). **p < 0.01.
Figure 3.
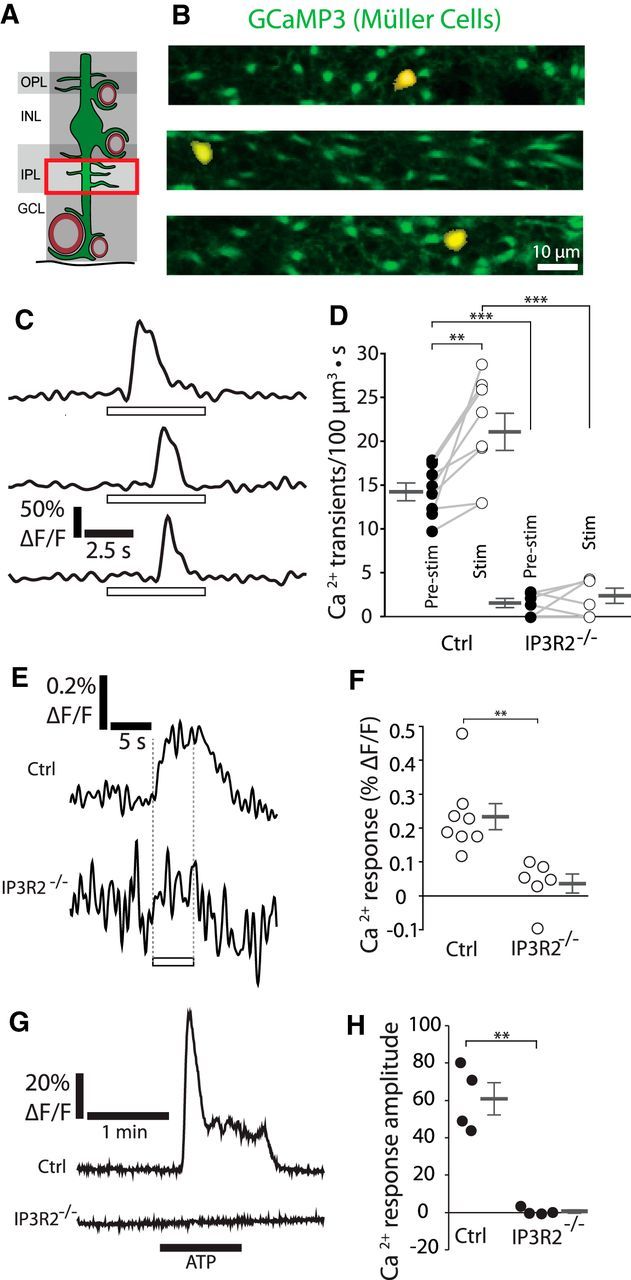
Calcium signaling in the fine processes of Müller cells. A, Calcium signaling was monitored in the fine processes of Müller cells in the inner plexiform layer (IPL). GCL, Ganglion cell layer; INL, inner nuclear layer; OPL, outer plexiform layer. B, Examples of Ca2+ transients in the fine processes of Müller cells. The Ca2+ transients (yellow; where GCaMP3 fluorescence exceeded a threshold) are overlaid on images of GCaMP3-labeled Müller cells (green). Similar images were obtained for 85 Ca2+ transients from eight eyecups. C, Traces of the Ca2+ transients in B. Open rectangles in this and other figures show the time course of the stimulus. D, The frequency of Ca2+ transients increased during stimulation (Stim) in control mice (Ctrl, p = 0.0065). Both spontaneous (Pre-stim, p = 3.6 × 10⁻⁷) and stimulus-evoked transient frequencies (p = 1.0 × 10⁻⁵) were reduced in IP3R2−/− mice (n = 8 control eyecups, 6 IP3R2−/− eyecups; two-way ANOVA with Bonferroni posttest; control pre-stim, 14.2 ± 1.0 Ca2+ transients/100 μm3 · s; control stim, 21.1 ± 2.1 Ca2+ transients/100 μm3 · s; IP3R2−/− pre-stim, 1.5 ± 0.48 Ca2+ transients/100 μm3 · s; stim, IP3R2−/−, 2.4 ± 0.79 Ca2+ transients/100 μm3 · s). E, Mean stimulus-evoked Ca2+ activity across all fine processes in control and IP3R2−/− mice. F, Amplitude of stimulus-evoked Ca2+ responses in E (n = 8 control eyecups, 6 IP3R2−/− eyecups; Mann–Whitney U test, p = 0.0024; control, 0.23 ± 0.036% ΔF/F; IP3R2−/−, 0.036 ± 0.026% ΔF/F). G, Representative Ca2+ responses to bath application of 10 μm ATP onto eyecups from control and IP3R2−/− littermate mice. H, Mean Ca2+ response amplitude to 10 μm ATP, measured in the IPL (n = 4 eyecups per group; unpaired t test, p = 0.0058; Ca2+ response amplitude, control, 60.9 ± 8.7% ΔF/F; IP3R2−/−, 0.5 ± 0.9% ΔF/F). **p < 0.01; ***p < 0.001.
Calcium signaling in Müller cell fine processes
We monitored Ca2+ signaling in the fine processes of Müller cells in the inner plexiform (synaptic) layer with a 488 nm imaging laser to measure GCaMP3 intensity. The intensity, frame rate, and imaging area of the confocal laser were optimized so that the laser illumination only transiently activated retinal neurons when first turned on. Neuronal activity returned to baseline within several seconds as the imaging laser remained on, allowing us to measure Ca2+ signaling while the laser had minimal effect on retinal activity (Fig. 2).
Figure 2.

Retinal neurons respond strongly to flicker stimulation. A, Single-unit recordings from RGCs reveal a transient increase in firing rate when the confocal imaging laser is turned on (filled rectangle at bottom), and a sustained increase in firing during flicker stimulation (open rectangle; mean of 19 cells, 5 eyecups). B, ERG recording shows no response when the confocal imaging laser is turned on (filled rectangle at bottom) and a large response to flicker stimulation (open rectangle).
Localized Ca2+ increases (which we refer to as transients) were generated in the absence of flicker light stimulation in Müller cell fine processes. These spontaneous transients had a mean duration of ∼1.2 s (n = 42 transients from 4 eyecups), had a peak amplitude of 34.5 ± 2.3% ΔF/F (n = 42 transients from 4 eyecups), and covered an area of 25 ± 2 μm2 (n = 40 transients from 4 eyecups). The transients remained localized to the region of generation. They did not propagate into the somata or stalks (the large radial processes) of the Müller cells.
If functional hyperemia is mediated by a Ca2+-dependent astroglial neurovascular coupling mechanism, neuronal activity must evoke rapid Ca2+ signaling in astroglial cells. However, several recent studies have questioned whether such signaling occurs (Nizar et al., 2013; Bonder and McCarthy, 2014). We assessed Müller cell Ca2+ responses to neuronal activity by stimulating eyecups with a 5 Hz diffuse flickering light, which effectively activates neurons in the inner retina (Fig. 2). The frequency of Ca2+ transients in the Müller cell fine processes increased by 49.4 ± 15.0% over the baseline rate in response to this stimulus (Fig. 3B–D). However, the amplitude and area of the Ca2+ transients remained unchanged (data not shown). The onset of the stimulus-evoked Ca2+ signaling, assessed by averaging the GCaMP3 intensity from all Müller cell fine processes in the imaged frames, had a latency of <600 ms (mean of eight eyecups; Fig. 3E), faster than stimulus-evoked vessel dilation (Kornfield and Newman, 2014; see Fig. 8). Because of the relatively low signal-to-noise ratio of the Ca2+ signals, it was not possible to determine an exact latency of the Ca2+ response. As the Ca2+ transients only last ∼1.2 s, the averaged GCaMP3 intensity response consisted of many transients starting and ending during the 5 s flicker stimulus. While most of the transients did not start immediately after the onset of the flicker stimulus, some did, as exemplified by the middle trace in Figure 5C.
Figure 8.

Calcium signaling in Müller cells is necessary to evoke capillary but not arteriole dilation. A, The diameter of intermediate layer capillaries was monitored. GCL, Ganglion cell layer; INL, inner nuclear layer; IPL, inner plexiform layer; OPL, outer plexiform layer. B, C, In eyecups, mean responses from intermediate layer capillaries show that stimulation evoked dilations in control mice (Ctrl) but not in IP3R2−/− littermates (n = 13 vessels from 4 control eyecups, n = 15 vessels from 4 IP3R2−/− eyecups; unpaired t test, p = 0.015; control, 7.6 ± 3.0% vessel dilation; IP3R2−/−, −0.37 ± 1.1% vessel dilation). D, The diameter of arterioles was monitored. E, F, Stimulation also evoked arteriole dilation in control mice. This dilation was not diminished in IP3R2−/− littermates (n = 6 vessels from 3 control eyecups, n = 7 vessels from 3 IP3R2−/− eyecups; unpaired t test, p = 0.72; control, 6.0 ± 1.2% vessel dilation; IP3R2−/−, 6.7 ± 1.2% vessel dilation). G, H, Similar responses were observed in vivo. Mean responses from intermediate layer capillaries show stimulus-evoked dilations in control mice but not in IP3R2−/− littermates (n = 14 vessels from 5 control mice, n = 14 vessels from 5 IP3R2−/− mice; unpaired t test, p = 0.0092; control, 1.1 ± 0.39% vessel dilation; IP3R2−/−, −0.25 ± 0.29% vessel dilation). I, J, Stimulus-evoked arteriole dilation in arterioles of control mice was not diminished in IP3R2−/− littermates (n = 5 vessels from 5 control mice, n = 5 vessels from 5 IP3R2−/− mice; unpaired t test, p = 0.41; control, 6.2 ± 1.9% vessel dilation; IP3R2−/−, 8.1 ± 1.0% vessel dilation). *p < 0.05; **p < 0.01.
The IP3R2 receptor, which is expressed exclusively in glial cells (Sharp et al., 1999), was knocked out by crossing GLAST-CreER;R26-lsl-GCaMP3 mice with IP3R2−/− mice (Li et al., 2005). This knock-out eliminated Ca2+ release from internal stores in Müller cells, as assessed by monitoring Ca2+ responses to bath application of 10 μm ATP (Fig. 3G,H; Lipp et al., 2009). Knock-out of IP3R2 greatly reduced stimulus-evoked Ca2+ signaling in the fine processes of Müller cells (Fig. 3D–F). However, a low level of spontaneous Ca2+ signaling remained in the IP3R2−/− mice (Fig. 3D). This is consistent with recent reports showing that a low level of astrocyte Ca2+ signaling remains in IP3R2−/− mice, particularly in the cell processes (Srinivasan et al., 2015).
Calcium signaling in Müller cell endfeet
If Müller cell Ca2+ increases regulate blood flow, neuronal activity should also evoke Ca2+ signaling in Müller cell endfeet, which directly contact blood vessels. The vasculature of the retina is stratified (Paques et al., 2003; Kornfield and Newman, 2014). Arterioles and venules lie at the vitreal surface of the retina, while capillaries ramify in three layers, the deep, intermediate, and superficial capillary layers (Fig. 1A). The endfeet of Müller cells contact all of these vessels. We showed previously that photic stimulation evokes active dilation, independent of passive stretch due to perfusion pressure increases, of retinal arterioles as well as capillaries in the intermediate capillary layer. However, capillaries in the deep and superficial layers do not actively dilate during photic stimulation (Kornfield and Newman, 2014).
Rapid Ca2+ transients having a mean duration of ∼0.95 ms (mean of 19 transients from 9 eyecups), an amplitude of 14.9 ± 1.7% ΔF/F (n = 19 transients, 9 eyecups), and an area of 16 ± 3 μm2 (n = 13 transients, 9 eyecups) were observed in Müller cell endfeet in the absence of stimulation. Photic stimulation did not alter the frequency of these Ca2+ transients in the endfeet contacting arterioles (Fig. 4B–D). Averaging GCaMP3 intensity from all imaged endfeet along arterioles revealed that there was no Ca2+ response to stimulation (Fig. 4E). In contrast, stimulation increased the frequency of Ca2+ transients by 285 ± 72% (n = 9 eyecups) in the endfeet contacting capillaries in the intermediate capillary layer (Fig. 5B–D). The amplitude and area of the endfoot Ca2+ transients during stimulation did not differ from those before stimulation (data not shown). Averaging GCaMP3 intensity across all intermediate capillary endfeet revealed that stimulus-evoked Ca2+ increases had a latency of <600 ms (Fig. 5E). This is shorter than the latency of stimulus-evoked dilation of intermediate layer capillaries (Kornfield and Newman, 2014; see Fig. 8). Knock-out of IP3R2 greatly reduced the stimulus-evoked increase in Ca2+ transient frequency (Fig. 5D), as well as the rapid change in GCaMP3 intensity in the endfeet contacting capillaries in the intermediate capillary layer (Fig. 5E,F).
Although Ca2+ transients were observed in the Müller cell endfeet contacting deep and superficial layer capillaries in the absence of stimulation, the frequency of these Ca2+ transients did not change in response to stimulation (Fig. 6B,F). Averaging GCaMP3 intensity from endfeet contacting the deep layer capillaries (Fig. 6C) confirmed that there was no Ca2+ response to stimulation. Surprisingly, averaging GCaMP3 intensity from the endfeet contacting the superficial layer capillaries revealed an intensity drop during stimulation (Fig. 6G). The origin of this Ca2+ decrease is unclear, but could be due to the activation of Ca2+ exchangers or ATPases which would lower Ca2+ in the cytosol of the endfeet (Verkhratsky and Kettenmann, 1996). To the best of our knowledge, this is the first report of a neuronally evoked Ca2+ decrease in astroglial cells.
Figure 6.

Stimulation does not increase Ca2+ signaling in Müller cell endfeet terminating on deep or superficial layer capillaries. A, Calcium signaling was monitored in Müller cell endfeet contacting deep layer capillaries. GCL, Ganglion cell layer; INL, inner nuclear layer; IPL, inner plexiform layer; OPL, outer plexiform layer. B, Stimulation does not increase Ca2+ transient frequency in endfeet contacting deep layer capillaries (n = 9 eyecups; Wilcoxon matched pairs signed rank test, p = 0.33; pre-stim, 0.58 ± 0.20 Ca2+ events/mm · s; stim, 0.19 ± 0.19 Ca2+ events/mm · s). C, Mean stimulus-evoked Ca2+ activity across all imaged endfeet contacting deep layer capillaries (n = 9 eyecups; paired t test, p = 0.064; pre-stim, 0.023 ± 0.038% ΔF/F; stim, −0.097 ± 0.053% ΔF/F). D, Mean stimulus-evoked change in diameter of deep layer capillaries (n = 12 vessels from 3 eyecups; paired t test, p = 0.59; pre-stim, 0.0 ± 6.4% change in diameter; stim, −0.7 ± 1.3% change in diameter). E, Calcium signaling was monitored in Müller cell endfeet contacting superficial layer capillaries. F, Stimulation does not increase Ca2+ transient frequency in endfeet contacting superficial layer capillaries (n = 9 eyecups; Wilcoxon matched pairs signed rank test, p = 1; pre-stim, 1.0 ± 0.4 Ca2+ events/mm · s; stim, 1.2 ± 0.6 Ca2+ events/mm · s). G, Mean stimulus-evoked Ca2+ activity across all imaged endfeet contacting superficial layer capillaries shows a decrease in Ca2+ intensity during stimulation (n = 9 eyecups; paired t test, p = 0.019; pre-stim, 0.025 ± 0.048% ΔF/F; stim, −0.34 ± 0.10% ΔF/F). H, Mean stimulus-evoked change in diameter of superficial layer capillaries (n = 11 vessels from 3 eyecups; paired t test, p = 0.94; pre-stim, 0.1 ± 5.9% change in diameter; stim, −0.1 ± 7.22% change in diameter).
We showed previously that flicker stimulation evokes dilation of intermediate layer capillaries, but not deep or superficial layer capillaries in vivo in rats (Kornfield and Newman, 2014). To confirm that similar vascular responses were evoked in our mouse eyecup preparation, we monitored capillary dilation to stimulation by labeling vessel lumens with rhodamine-dextran and measuring their diameters with confocal microscopy. In agreement with previous findings (Kornfield and Newman, 2014), capillaries in the intermediate capillary layer dilated in response to stimulation (see Fig. 8B). This contrasts with capillaries in the deep and superficial capillary layers, which did not dilate (Fig. 6D,H). Thus, the intermediate capillary layer, the only vascular layer where stimulation generates endfoot Ca2+ responses, is the only layer where capillaries dilate.
Müller cell Ca2+ increases evoke capillary dilation
We monitored spontaneous endfoot Ca2+ transients and the diameter of capillaries in the intermediate capillary layer simultaneously, in the absence of stimulation, to determine whether Ca2+ signaling is sufficient to generate capillary dilation. We found that capillaries often dilated after spontaneous Ca2+ transients were generated in nearby Müller cell endfeet (Fig. 7B,C). The correlation between the Ca2+ transients and the subsequent capillary dilations was determined by synchronizing all trials to the rising phase of the Ca2+ transients (Fig. 7D). The mean spontaneous Ca2+ transient had an amplitude of 8.8 ± 0.33% ΔF/F (n = 208 transients, 5 eyecups), while the resulting mean capillary dilation had an amplitude of 0.95 ± 0.8% (p < 0.001). The capillary dilations that followed the Ca2+ transients were slow in developing, having a mean latency of ∼4.0 s following the onset of the Ca2+ transient and peaking at >10 s.
Figure 7.
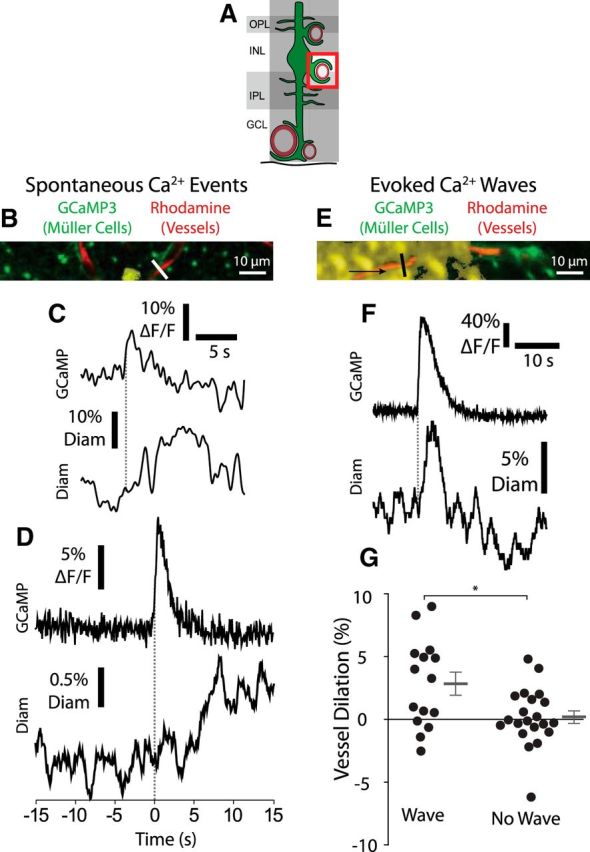
Calcium signaling in Müller cell endfeet is sufficient to evoke capillary dilation. A, Müller cell Ca2+ signaling and capillary diameter were monitored in the intermediate capillary layer. GCL, Ganglion cell layer; INL, inner nuclear layer; IPL, inner plexiform layer; OPL, outer plexiform layer. B, Example of a spontaneous endfoot Ca2+ transient along an intermediate layer capillary. Labeling is the same as in Figure 3B. Similar images were obtained for 207 Ca2+ transients from five eyecups. C, Trace of the Ca2+ transient in B (top), along with the resulting change in capillary diameter (bottom; measured at the white line in B). The onset of the Ca2+ transient is indicated by the dotted line. D, Mean intensity of spontaneous Ca2+ transients along with the mean change in capillary diameter. Capillary diameter increased following Ca2+ transients (n = 208 transients from 5 eyecups; Wilcoxon matched pairs signed rank test, p < 0.001; pre-transient, −0.1 ± 0.8% change in diameter; post-transient, 0.8 ± 0.8% change in diameter). Traces were synchronized to the rising phase of the Ca2+ transients (dotted line). E, Example of a Müller cell Ca2+ wave (yellow), generated by a brief negative current pulse from a glass pipette, propagated in the direction indicated by the arrow. Similar images were obtained for 14 Ca2+ waves from four eyecups. F, Endfoot Ca2+ signaling (top) and capillary diameter (bottom) as the Ca2+ wave in E propagated past the capillary. Endfoot Ca2+ and vessel diameter were measured at the black line in E. G, Mean change in capillary diameter when a Ca2+ wave reached a capillary and when the Ca2+ wave failed to reach the capillary (n = 15 Ca2+ waves and n = 21 trials without Ca2+ waves from 4 eyecups; unpaired t test, p = 0.0095; with Ca2+ wave, 2.8 ± 0.90% vessel dilation; without Ca2+ wave, 0.19 ± 0.50% vessel dilation). *p < 0.05.
In a second test of the effect of Müller cell Ca2+ signaling on capillary diameter, we evoked large, intercellular Müller cell Ca2+ waves (Newman, 2001) in eyecups by electrical stimulation of Müller cells in the inner plexiform layer while monitoring the diameter of intermediate layer capillaries (Fig. 7E–G). When a Ca2+ wave reached an intermediate layer capillary, the capillary dilated (Fig. 7G). When a wave died out before reaching the capillary, or when the stimulus failed to evoke a wave, the capillary did not dilate (Fig. 7G). Together, these findings indicate that Ca2+ signaling in Müller cells is sufficient to generate capillary dilation.
Müller cell Ca2+ signaling is necessary for capillary but not arteriole dilation
Previous studies have demonstrated that arteriole dilations evoked by neuronal activity are not diminished in IP3R2−/− mice, where Müller cell Ca2+ signaling is reduced (Nizar et al., 2013; Bonder and McCarthy, 2014). We tested whether stimulus-evoked dilations of capillaries and arterioles were reduced in IP3R2−/− mice. We confirmed that our IP3R2−/− mice did not generate Ca2+ responses to bath-applied ATP (Fig. 3G,H) and that Ca2+ responses to photic stimulation were greatly reduced (Figs. 3D–F, 5D–F). In the eyecup, stimulus-evoked dilations of intermediate layer capillaries, which were present in control littermates, were abolished in IP3R2−/− mice (Fig. 8B,C). In contrast, stimulus-evoked dilations of arterioles were undiminished in IP3R2−/− mice (Fig. 8E,F).
Similar findings were obtained in vivo, where the retinal vasculature was monitored with confocal microscopy. Stimulus-evoked dilations of intermediate layer capillaries, present in control littermates, were abolished in IP3R2−/− mice (Fig. 8G,H). However, stimulus-evoked arteriole dilations were unaffected in IP3R2−/− mice (Fig. 8I,J). These ex vivo and in vivo findings demonstrate that Müller cell Ca2+ signaling is necessary for capillary but not for arteriole dilation.
Discussion
Our findings demonstrate that Ca2+ signaling in Müller cell endfeet is both necessary and sufficient to dilate capillaries. In contrast, Ca2+ signaling is not necessary for arteriole dilation. Stimulus-evoked neuronal activity triggers rapid Ca2+ increases in Müller cell endfeet contacting capillaries in the intermediate capillary layer, the capillaries that dilate in response to stimulation. This finding is in agreement with a recent report showing rapid Ca2+ increases in astroglial endfeet contacting capillaries in the olfactory bulb (Otsu et al., 2015). However, stimulus-evoked Ca2+ signaling is absent in endfeet contacting deep and superficial layer capillaries, which do not dilate.
Both spontaneous Ca2+ transients and experimentally evoked Ca2+ waves are sufficient to induce dilations in intermediate layer capillaries. It is possible that neuronal activity could have induced the “spontaneous” Ca2+ transients we observed and evoked the capillary dilations. This, however, is not the case for experimentally evoked Ca2+ waves, where Müller cells are stimulated directly. Additionally, neuronal activity alone is unable to generate capillary dilations as the dilations are abolished in the IP3R2−/− mice. These findings strongly support the supposition that glial Ca2+ signaling is sufficient to dilate capillaries.
Calcium increases are absent in endfeet contacting arterioles, indicating that arteriole dilation is not mediated by Ca2+-dependent Müller cell signaling. Reducing Ca2+ signaling in IP3R2−/− mice does not diminish arteriole dilation, in agreement with previous studies (Nizar et al., 2013; Bonder and McCarthy, 2014), but abolishes capillary dilation, an observation not reported previously. (It is possible, but unlikely, that an IP3R2-independent Ca2+ signaling mechanism went undetected in our study and could contribute to arteriole dilations.) Together, these results lend strong support to the hypothesis that Müller cell Ca2+ signaling regulates capillary but not arteriole dilation in the retina.
We and others have shown previously that experimentally imposed glial Ca2+ increases evoke arteriole dilations. For example, photolysis of caged Ca2+ in glial endfeet can trigger arteriole dilations in the ex vivo retina (Metea and Newman, 2006), in brain slices (Gordon et al., 2008), and in in vivo cortical preparations (Takano et al., 2006). These findings were interpreted as evidence that glial Ca2+ signaling is an important mechanism of neurovascular coupling onto arterioles. While glial Ca2+ signaling may be capable of generating arteriole dilations, the findings of the present work and of previous studies (Nizar et al., 2013; Bonder and McCarthy, 2014) clearly demonstrate that this interpretation was incorrect. Glial Ca2+ signaling is not a primary mechanism of neurovascular coupling onto arterioles.
Our findings further demonstrate that capillaries dilate actively in response to neuronal activity and thus contribute to blood flow regulation in the retina. Capillary regulation of blood flow was challenged in a recent report that concluded that capillary pericytes do not express α-smooth muscle actin and thus cannot contract or relax (Hill et al., 2015). Our findings, in agreement with previous studies (Peppiatt et al., 2006; Hall et al., 2014), demonstrate otherwise. We found, both in the eyecup and in vivo, that stimulation evokes dilation of intermediate layer capillaries and that this dilation is abolished in IP3R2−/− mice. The only plausible explanation for this finding is that these capillaries actively dilate in response to neuronal activity, regardless of upstream changes in perfusion pressure. Pressure changes are not a factor in the eyecup, where the vasculature is not perfused, while in vivo, perfusion pressure is not diminished in IP3R2−/− mice because arteriole dilation is not reduced. Although we did not image pericytes directly, they are the only contractile cell associated with capillaries and thus must be responsible for capillary dilation. This finding has important implications for the interpretation of BOLD fMRI signals, which detect changes in blood flow. Our results indicate that components of the BOLD signal may arise from capillary responses, adding an additional layer of complexity to decoding the signals. Control of blood flow by capillaries could theoretically improve the spatial resolution of BOLD fMRI (Hamilton et al., 2010), enabling the monitoring of the activity of small numbers of neurons.
Our findings indicate that different neurovascular coupling mechanisms mediate stimulus-evoked dilation of capillaries and arterioles. The results indicate that capillary dilation is mediated by Müller glia Ca2+ signaling. It is not clear, however, what mechanisms mediate arteriole dilations. Neurons could directly signal to arteriole vascular smooth muscle cells without a glial contribution (Attwell et al., 2010). Possible neurovascular coupling mechanisms include the neuronal release of nitric oxide (Busija et al., 2007), prostaglandins (Attwell et al., 2010), or adenosine (Li and Iadecola, 1994). Alternatively, active neurons may release sufficient levels of K+ to dilate arterioles directly or to mediate dilation via astrocytes (Paulson and Newman, 1987; Filosa et al., 2006). It has been suggested (Hall et al., 2014) that arteriole dilations might be triggered by signals that propagate upstream from dilating capillaries. This mechanism is unlikely to play a major role in the retina, as large arteriole dilations persist in the absence of capillary dilations in our ex vivo and in vivo IP3R2−/− mice.
Different CNS regions may use different mechanisms to regulate blood flow. For example, the cerebellum uses nitric oxide as a dilatory signaling molecule (Yang et al., 2003), while nitric oxide appears to play more of a regulatory role in the retina (Metea and Newman, 2006) and cortex (Lindauer et al., 1999). These differences may be caused by such factors as different neuronal and glial populations, vascular geometry, and metabolic requirements. It is possible that the results obtained in this work are unique to the retina and cannot be generalized to the rest of the CNS. However, due to the functional parallels between Müller cells and brain astrocytes (Newman and Reichenbach, 1996), the consistent pericyte physiology (Hamilton et al., 2010), and the similar nature of astroglial Ca2+ signaling in the retina and the brain (Newman, 2005; Bazargani and Attwell, 2016), we believe that similar neurovascular coupling mechanisms are at work in the brain as in the retina. Additional experiments are needed to test this proposition.
We and others have shown that in vivo, sensory stimulation produces large dilations in arterioles (Iadecola, 2004; Kornfield and Newman, 2014). This has been interpreted as evidence that arteriole dilations play an important role in generating the functional hyperemia response. However, the relative contributions of arterioles and capillaries to blood flow regulation is currently under debate (Attwell et al., 2010). Although capillary dilations tend to be small, capillaries represent a large fraction of the total resistance of the microvasculature (Blinder et al., 2013), indicating that they may have substantial influence over blood flow regulation. In one estimate, a 6% capillary dilation (∼0.32 μm) generates the majority of the total blood flow increase evoked by neuronal activity (Hall et al., 2014). Our results show that Ca2+ signaling in retinal Müller cells can elicit small but significant capillary dilations, demonstrating that Ca2+-dependent Müller cell signaling may be an important contributor to the global functional hyperemia response. However, additional experiments are needed to determine the relative contributions of arteriole and capillary dilations to functional hyperemia.
Disruption of blood flow occurs in a number of CNS pathologies, potentially causing tissue hypoxia that could contribute to disease progression (Girouard and Iadecola, 2006; Attwell et al., 2010). In Alzheimer's disease, deficits in CNS blood flow correlate with cognitive decline (Girouard and Iadecola, 2006; Nicolakakis and Hamel, 2011), while amyloid-β has been shown to disrupt functional hyperemia in animal models of Alzheimer's (Girouard and Iadecola, 2006; Nicolakakis and Hamel, 2011). Pericytes constrict during stroke and can remain constricted after the initial ischemic event, reducing reperfusion into damaged areas (Yemisci et al., 2009; Hall et al., 2014). Pericytes may also constrict and reduce blood flow to the damaged tissue following traumatic brain injury (Dore-Duffy et al., 2011). In diabetic retinopathy, functional hyperemia is substantially reduced, which may contribute to retinal pathology (Garhöfer et al., 2004; Mishra and Newman, 2010). Elucidating the mechanisms that mediate functional hyperemia and regulate capillary blood flow may lead to the development of therapies for treating these diseases.
Footnotes
This work was supported by NIH Grants R01-EY04077 and P30-EY11374 (E.A.N.) and P50-MH084020 and P30-NS050274 (D.E.B.), MinnCReST Predoctoral Training Fellowship T90 DE 022732, and the NIH Predoctoral Training of Neuroscientists Grant T32GMOD8471. We thank David Attwell, Anusha Mishra, Alfonso Araque, and Joanna Kur for helpful discussions, and Heidi Röehrich for immunohistochemistry assistance.
The authors declare no competing financial interests.
References
- Attwell D, Iadecola C. The neural basis of functional brain imaging signals. Trends Neurosci. 2002;25:621–625. doi: 10.1016/S0166-2236(02)02264-6. [DOI] [PubMed] [Google Scholar]
- Attwell D, Buchan AM, Charpak S, Lauritzen M, Macvicar BA, Newman EA. Glial and neuronal control of brain blood flow. Nature. 2010;468:232–243. doi: 10.1038/nature09613. [DOI] [PMC free article] [PubMed] [Google Scholar]
- Bazargani N, Attwell D. Astrocyte calcium signaling: the third wave. Nat Neurosci. 2016;19:182–189. doi: 10.1038/nn.4201. [DOI] [PubMed] [Google Scholar]
- Blinder P, Tsai PS, Kaufhold JP, Knutsen PM, Suhl H, Kleinfeld D. The cortical angiome: an interconnected vascular network with noncolumnar patterns of blood flow. Nat Neurosci. 2013;16:889–897. doi: 10.1038/nn.3426. [DOI] [PMC free article] [PubMed] [Google Scholar]
- Bonder DE, McCarthy KD. Astrocytic Gq-GPCR-linked IP3R-dependent Ca2+ signaling does not mediate neurovascular coupling in mouse visual cortex in vivo. J Neurosci. 2014;34:13139–13150. doi: 10.1523/JNEUROSCI.2591-14.2014. [DOI] [PMC free article] [PubMed] [Google Scholar]
- Borghuis BG, Tian L, Xu Y, Nikonov SS, Vardi N, Zemelman BV, Looger LL. Imaging light responses of targeted neuron populations in the rodent retina. J Neurosci. 2011;31:2855–2867. doi: 10.1523/JNEUROSCI.6064-10.2011. [DOI] [PMC free article] [PubMed] [Google Scholar]
- Busija DW, Bari F, Domoki F, Louis T. Mechanisms involved in the cerebrovascular dilator effects of N-methyl-d-aspartate in cerebral cortex. Brain Res Rev. 2007;56:89–100. doi: 10.1016/j.brainresrev.2007.05.011. [DOI] [PMC free article] [PubMed] [Google Scholar]
- Chaigneau E, Oheim M, Audinat E, Charpak S. Two-photon imaging of capillary blood flow in olfactory bulb glomeruli. Proc Natl Acad Sci U S A. 2003;100:13081–13086. doi: 10.1073/pnas.2133652100. [DOI] [PMC free article] [PubMed] [Google Scholar]
- Dore-Duffy P, Wang S, Mehedi A, Katyshev V, Cleary K, Tapper A, Reynolds C, Ding Y, Zhan P, Rafols J, Kreipke CW. Pericyte-mediated vasoconstriction underlies TBI-induced hypoperfusion. Neurol Res. 2011;33:176–186. doi: 10.1179/016164111X12881719352372. [DOI] [PubMed] [Google Scholar]
- Fernández-Klett F, Offenhauser N, Dirnagl U, Priller J, Lindauer U. Pericytes in capillaries are contractile in vivo, but arterioles mediate functional hyperemia in the mouse brain. Proc Natl Acad Sci U S A. 2010;107:22290–22295. doi: 10.1073/pnas.1011321108. [DOI] [PMC free article] [PubMed] [Google Scholar]
- Filosa JA, Bonev AD, Straub SV, Meredith AL, Wilkerson MK, Aldrich RW, Nelson MT. Local potassium signaling couples neuronal activity to vasodilation in the brain. Nat Neurosci. 2006;9:1397–1403. doi: 10.1038/nn1779. [DOI] [PubMed] [Google Scholar]
- Garhöfer G, Zawinka C, Resch H, Kothy P, Schmetterer L, Dorner GT. Reduced response of retinal vessel diameters to flicker stimulation in patients with diabetes. Br J Ophthalmol. 2004;88:887–891. doi: 10.1136/bjo.2003.033548. [DOI] [PMC free article] [PubMed] [Google Scholar]
- Girouard H, Iadecola C. Neurovascular coupling in the normal brain and in hypertension, stroke, and Alzheimer disease. J Appl Physiol. 2006;100:328–335. doi: 10.1152/japplphysiol.00966.2005. [DOI] [PubMed] [Google Scholar]
- Gordon GR, Choi HB, Rungta RL, Ellis-Davies GC, MacVicar BA. Brain metabolism dictates the polarity of astrocyte control over arterioles. Nature. 2008;456:745–749. doi: 10.1038/nature07525. [DOI] [PMC free article] [PubMed] [Google Scholar]
- Hall CN, Reynell C, Gesslein B, Hamilton NB, Mishra A, Sutherland BA, O'Farrell FM, Buchan AM, Lauritzen M, Attwell D. Capillary pericytes regulate cerebral blood flow in health and disease. Nature. 2014;508:55–60. doi: 10.1038/nature13165. [DOI] [PMC free article] [PubMed] [Google Scholar]
- Hamilton NB, Attwell D, Hall CN. Pericyte-mediated regulation of capillary diameter: a component of neurovascular coupling in health and disease. Front Neuroenergetics. 2010;2:5. doi: 10.3389/fnene.2010.00005. [DOI] [PMC free article] [PubMed] [Google Scholar]
- Harada T, Harada C, Watanabe M, Inoue Y, Sakagawa T, Nakayama N, Sasaki S, Okuyama S, Watase K, Wada K, Tanaka K. Functions of the two glutamate transporters GLAST and GLT-1 in the retina. Proc Natl Acad Sci U S A. 1998;95:4663–4666. doi: 10.1073/pnas.95.8.4663. [DOI] [PMC free article] [PubMed] [Google Scholar]
- Hill RA, Tong L, Yuan P, Murikinati S, Gupta S, Grutzendler J. Regional blood flow in the normal and ischemic brain Is controlled by arteriolar smooth muscle cell contractility and not by capillary pericytes. Neuron. 2015;87:95–110. doi: 10.1016/j.neuron.2015.06.001. [DOI] [PMC free article] [PubMed] [Google Scholar]
- Iadecola C. Neurovascular regulation in the normal brain and in Alzheimer's disease. Nat Rev Neurosci. 2004;5:347–360. doi: 10.1038/nrn1387. [DOI] [PubMed] [Google Scholar]
- Iadecola C, Davisson RL. Hypertension and cerebrovascular dysfunction. Cell Metab. 2008;7:476–484. doi: 10.1016/j.cmet.2008.03.010. [DOI] [PMC free article] [PubMed] [Google Scholar]
- Iadecola C, Nedergaard M. Glial regulation of the cerebral microvasculature. Nat Neurosci. 2007;10:1369–1376. doi: 10.1038/nn2003. [DOI] [PubMed] [Google Scholar]
- Jennings JR, Muldoon MF, Ryan C, Price JC, Greer P, Sutton-Tyrrell K, van der Veen FM, Meltzer CC. Reduced cerebral blood flow response and compensation among patients with untreated hypertension. Neurology. 2005;64:1358–1365. doi: 10.1212/01.WNL.0000158283.28251.3C. [DOI] [PubMed] [Google Scholar]
- Kornfield TE, Newman EA. Regulation of blood flow in the retinal trilaminar vascular network. J Neurosci. 2014;34:11504–11513. doi: 10.1523/JNEUROSCI.1971-14.2014. [DOI] [PMC free article] [PubMed] [Google Scholar]
- Li J, Iadecola C. Nitric oxide and adenosine mediate vasodilation during functional activation in cerebellar cortex. Neuropharmacology. 1994;33:1453–1461. doi: 10.1016/0028-3908(94)90049-3. [DOI] [PubMed] [Google Scholar]
- Li X, Zima AV, Sheikh F, Blatter LA, Chen J. Endothelin-1-induced arrhythmogenic Ca2+ signaling is abolished in atrial myocytes of inositol-1,4,5-trisphosphate(IP3)-receptor type 2-deficient mice. Circ Res. 2005;96:1274–1281. doi: 10.1161/01.RES.0000172556.05576.4c. [DOI] [PubMed] [Google Scholar]
- Lind BL, Brazhe AR, Jessen SB, Tan FC, Lauritzen MJ. Rapid stimulus-evoked astrocyte Ca2+ elevations and hemodynamic responses in mouse somatosensory cortex in vivo. Proc Natl Acad Sci U S A. 2013;110:E4678–E4687. doi: 10.1073/pnas.1310065110. [DOI] [PMC free article] [PubMed] [Google Scholar]
- Lindauer U, Megow D, Matsuda H, Dirnagl U. Nitric oxide: a modulator, but not a mediator, of neurovascular coupling in rat somatosensory cortex. Am J Physiol. 1999;277:H799–H811. doi: 10.1152/ajpheart.1999.277.2.H799. [DOI] [PubMed] [Google Scholar]
- Lipp S, Wurm A, Pannicke T, Wiedemann P, Reichenbach A, Chen J, Bringmann A. Calcium responses mediated by type 2 IP3-receptors are required for osmotic volume regulation of retinal glial cells in mice. Neurosci Lett. 2009;457:85–88. doi: 10.1016/j.neulet.2009.04.001. [DOI] [PMC free article] [PubMed] [Google Scholar]
- Logothetis NK, Wandell BA. Interpreting the BOLD signal. Annu Rev Physiol. 2004;66:735–769. doi: 10.1146/annurev.physiol.66.082602.092845. [DOI] [PubMed] [Google Scholar]
- Metea MR, Newman EA. Glial cells dilate and constrict blood vessels: a mechanism of neurovascular coupling. J Neurosci. 2006;26:2862–2870. doi: 10.1523/JNEUROSCI.4048-05.2006. [DOI] [PMC free article] [PubMed] [Google Scholar]
- Mishra A, Newman EA. Inhibition of inducible nitric oxide synthase reverses the loss of functional hyperemia in diabetic retinopathy. Glia. 2010;58:1996–2004. doi: 10.1002/glia.21068. [DOI] [PMC free article] [PubMed] [Google Scholar]
- Mosso A. Circulation of blood in the human brain. In: Raichle ME, Shepherd GM, editors. Fabbri CN, Translator. NY: Oxford University Press; 2014. [Google Scholar]
- Newman EA. Propagation of intercellular calcium waves in retinal astrocytes and Müller cells. J Neurosci. 2001;21:2215–2223. doi: 10.1523/JNEUROSCI.21-07-02215.2001. [DOI] [PMC free article] [PubMed] [Google Scholar]
- Newman EA. Calcium increases in retinal glial cells evoked by light-induced neuronal activity. J Neurosci. 2005;25:5502–5510. doi: 10.1523/JNEUROSCI.1354-05.2005. [DOI] [PMC free article] [PubMed] [Google Scholar]
- Newman EA, Bartosch R. An eyecup preparation for the rat and mouse. J Neurosci Methods. 1999;93:169–175. doi: 10.1016/S0165-0270(99)00138-7. [DOI] [PubMed] [Google Scholar]
- Newman E, Reichenbach A. The Muller cell: a functional element of the retina. Trends Neurosci. 1996;19:307–312. doi: 10.1016/0166-2236(96)10040-0. [DOI] [PubMed] [Google Scholar]
- Nicolakakis N, Hamel E. Neurovascular function in Alzheimer's disease patients and experimental models. J Cereb Blood Flow Metab. 2011;31:1354–1370. doi: 10.1038/jcbfm.2011.43. [DOI] [PMC free article] [PubMed] [Google Scholar]
- Nizar K, Uhlirova H, Tian P, Saisan PA, Cheng Q, Reznichenko L, Weldy KL, Steed TC, Sridhar VB, MacDonald CL, Cui J, Gratiy SL, Sakadzić S, Boas DA, Beka TI, Einevoll GT, Chen J, Masliah E, Dale AM, Silva GA. In vivo stimulus-induced vasodilation occurs without IP3 receptor activation and may precede astrocytic calcium increase. J Neurosci. 2013;33:8411–8422. doi: 10.1523/JNEUROSCI.3285-12.2013. [DOI] [PMC free article] [PubMed] [Google Scholar]
- Otsu Y, Couchman K, Lyons DG, Collot M, Agarwal A, Mallet JM, Pfrieger FW, Bergles DE, Charpak S. Calcium dynamics in astrocyte processes during neurovascular coupling. Nat Neurosci. 2015;18:210–218. doi: 10.1038/nn.3906. [DOI] [PMC free article] [PubMed] [Google Scholar]
- Paques M, Tadayoni R, Sercombe R, Laurent P, Genevois O, Gaudric A, Vicaut E. Structural and hemodynamic analysis of the mouse retinal microcirculation. Invest Ophthalmol Vis Sci. 2003;44:4960–4967. doi: 10.1167/iovs.02-0738. [DOI] [PubMed] [Google Scholar]
- Paukert M, Agarwal A, Cha J, Doze VA, Kang JU, Bergles DE. Norepinephrine controls astroglial responsiveness to local circuit activity. Neuron. 2014;82:1263–1270. doi: 10.1016/j.neuron.2014.04.038. [DOI] [PMC free article] [PubMed] [Google Scholar]
- Paulson OB, Newman EA. Does the release of potassium from astrocyte endfeet regulate cerebral blood flow? Science. 1987;237:896–898. doi: 10.1126/science.3616619. [DOI] [PMC free article] [PubMed] [Google Scholar]
- Peppiatt CM, Howarth C, Mobbs P, Attwell D. Bidirectional control of CNS capillary diameter by pericytes. Nature. 2006;443:700–704. doi: 10.1038/nature05193. [DOI] [PMC free article] [PubMed] [Google Scholar]
- Riva CE, Logean E, Falsini B. Visually evoked hemodynamical response and assessment of neurovascular coupling in the optic nerve and retina. Prog Retin Eye Res. 2005;24:183–215. doi: 10.1016/j.preteyeres.2004.07.002. [DOI] [PubMed] [Google Scholar]
- Rosa JM, Bos R, Sack GS, Fortuny C, Agarwal A, Bergles DE, Flannery JG, Feller MB. Neuron-glia signaling in developing retina mediated by neurotransmitter spillover. Elife. 2015:4. doi: 10.7554/eLife.09590. [DOI] [PMC free article] [PubMed] [Google Scholar]
- Roy CS, Sherrington CS. On the regulation of the blood-supply of the brain. J Physiol. 1890;11:85–108. doi: 10.1113/jphysiol.1890.sp000321. [DOI] [PMC free article] [PubMed] [Google Scholar]
- Schönfelder U, Hofer A, Paul M, Funk RH. In situ observation of living pericytes in rat retinal capillaries. Microvasc Res. 1998;56:22–29. doi: 10.1006/mvre.1998.2086. [DOI] [PubMed] [Google Scholar]
- Shahram M, Milanfar P. Imaging below the diffraction limit: a statistical analysis. IEEE Trans Image Process. 2004;13:677–689. doi: 10.1109/TIP.2004.826096. [DOI] [PubMed] [Google Scholar]
- Sharp AH, Nucifora FC, Jr, Blondel O, Sheppard CA, Zhang C, Snyder SH, Russell JT, Ryugo DK, Ross CA. Differential cellular expression of isoforms of inositol 1,4,5-triphosphate receptors in neurons and glia in brain. J Comp Neurol. 1999;406:207–220. doi: 10.1002/(SICI)1096-9861(19990405)406:2%3C207::AID-CNE6%3E3.0.CO%3B2-7. [DOI] [PubMed] [Google Scholar]
- Shigetomi E, Bushong EA, Haustein MD, Tong X, Jackson-Weaver O, Kracun S, Xu J, Sofroniew MV, Ellisman MH, Khakh BS. Imaging calcium microdomains within entire astrocyte territories and endfeet with GCaMPs expressed using adeno-associated viruses. J Gen Physiol. 2013;141:633–647. doi: 10.1085/jgp.201210949. [DOI] [PMC free article] [PubMed] [Google Scholar]
- Srienc AI, Kornfield TE, Mishra A, Burian MA, Newman EA. Assessment of glial function in the in vivo retina. In: Milner R, editor. Astrocytes: methods and protocols. New York: Springer; 2012. pp. 499–514. [DOI] [PMC free article] [PubMed] [Google Scholar]
- Srinivasan R, Huang BS, Venugopal S, Johnston AD, Chai H, Zeng H, Golshani P, Khakh BS. Ca2+ signaling in astrocytes from Ip3r2−/− mice in brain slices and during startle responses in vivo. Nat Neurosci. 2015;18:708–717. doi: 10.1038/nn.4001. [DOI] [PMC free article] [PubMed] [Google Scholar]
- Takano T, Tian GF, Peng W, Lou N, Libionka W, Han X, Nedergaard M. Astrocyte-mediated control of cerebral blood flow. Nat Neurosci. 2006;9:260–267. doi: 10.1038/nn1623. [DOI] [PubMed] [Google Scholar]
- Verkhratsky A, Kettenmann H. Calcium signalling in glial cells. Trends Neurosci. 1996;19:346–352. doi: 10.1016/0166-2236(96)10048-5. [DOI] [PubMed] [Google Scholar]
- Wang X, Lou N, Xu Q, Tian GF, Peng WG, Han X, Kang J, Takano T, Nedergaard M. Astrocytic Ca2+ signaling evoked by sensory stimulation in vivo. Nat Neurosci. 2006;9:816–823. doi: 10.1038/nn1703. [DOI] [PubMed] [Google Scholar]
- Yang G, Zhang Y, Ross ME, Iadecola C. Attenuation of activity-induced increases in cerebellar blood flow in mice lacking neuronal nitric oxide synthase. Am J Physiol Heart Circ Physiol. 2003;285:H298–H304. doi: 10.1152/ajpheart.00043.2003. [DOI] [PubMed] [Google Scholar]
- Yemisci M, Gursoy-Ozdemir Y, Vural A, Can A, Topalkara K, Dalkara T. Pericyte contraction induced by oxidative-nitrative stress impairs capillary reflow despite successful opening of an occluded cerebral artery. Nat Med. 2009;15:1031–1037. doi: 10.1038/nm.2022. [DOI] [PubMed] [Google Scholar]
Associated Data
This section collects any data citations, data availability statements, or supplementary materials included in this article.
Data Availability Statement
All relevant data are available from the corresponding author upon request.