

Abstract
Synchronous optogenetic activation of striatal cholinergic interneurons ex vivo produces a disynaptic inhibition of spiny projection neurons composed of biophysically distinct GABAAfast and GABAAslow components. This has been shown to be due, at least in part, to activation of nicotinic receptors on GABAergic NPY-neurogliaform interneurons that monosynaptically inhibit striatal spiny projection neurons. Recently, it has been proposed that a significant proportion of this inhibition is actually mediated by activation of presynaptic nicotinic receptors on nigrostriatal terminals that evoke GABA release from the terminals of the dopaminergic nigrostriatal pathway. To disambiguate these the two mechanisms, we crossed mice in which channelrhodopsin is endogenously expressed in cholinergic neurons with Htr3a-Cre mice, in which Cre is selectively targeted to several populations of striatal GABAergic interneurons, including the striatal NPY-neurogliaform interneuron. Htr3a-Cre mice were then virally transduced to express halorhodopsin to allow activation of channelrhodopsin and halorhodopsin, individually or simultaneously. Thus we were able to optogenetically disconnect the interneuron-spiny projection neuron (SPN) cell circuit on a trial-by-trial basis. As expected, optogenetic activation of cholinergic interneurons produced inhibitory currents in SPNs. During simultaneous inhibition of GABAergic interneurons with halorhodopsin, we observed a large, sometimes near complete reduction in both fast and slow components of the cholinergic-evoked inhibition, and a delay in IPSC latency. This demonstrates that the majority of cholinergic-evoked striatal GABAergic inhibition is derived from GABAergic interneurons. These results also reinforce the notion that a semiautonomous circuit of striatal GABAergic interneurons is responsible for transmitting behaviorally relevant cholinergic signals to spiny projection neurons.
SIGNIFICANCE STATEMENT The circuitry between neurons of the striatum has been recently described to be far more complex than originally imagined. One example of this phenomenon is that striatal cholinergic interneurons have been shown to provide intrinsic nicotinic excitation of local GABAergic interneurons, which then inhibit the projection neurons of the striatum. As deficits of cholinergic interneurons are reported in patients with Tourette syndrome, the normal functions of these interneurons are of great interest. Whether this novel route of nicotinic input constitutes a major output of cholinergic interneurons remains unknown. The study addressed this question using excitatory and inhibitory optogenetic technology, so that cholinergic interneurons could be selectively activated and GABAergic interneurons selectively inhibited to determine the causal relationship in this circuit.
Keywords: cholinergic interneuron, GABA-Aslow, neurogliaform, optogenetics, striatum
Introduction
Cholinergic interneurons (CINs) represent one of the largest groups of striatal interneurons and the only non-GABAergic population. They exert a strong muscarinic control over striatal function and exhibit conditioned phasic responses to various behaviorally relevant stimuli (Goldberg and Reynolds, 2011; for review, see Goldberg et al., 2012).
In addition, a diverse population of striatal GABAergic interneurons provides inhibition to spiny projection neurons (SPNs) through several known routes (Tepper and Koós, 2016). In perhaps the most well described case, fast-spiking interneurons (FSIs) receive glutamatergic input from cortex and intralaminar thalamus (Rudkin and Sadikot, 1999; Sidibé and Smith, 1999; Ramanathan et al., 2002), and provide strong feedforward inhibition to SPNs (Kita et al., 1990; Bennett and Bolam, 1994; Kita, 1996; Koós and Tepper, 1999; Koós et al., 2004; Mallet et al., 2005; Gittis et al., 2010; Planert et al., 2010; Szydlowski et al., 2013). Pharmacological inhibition of non-NMDA glutamate receptors in these neurons produces obvious motor deficits (Gittis et al., 2011).
However, more recently, many other types of striatal GABAergic interneurons have been identified that are driven by different sources. Striatal TH-expressing interneurons, NPY-expressing neurogliaform interneurons (NGFs) and fast-adapting interneurons (FAIs) receive nicotinic excitation ex vivo, and provide potent GABAAslow and/or GABAAfast inhibition to SPNs (Ibáñez-Sandoval et al., 2011, 2015; English et al., 2012; Luo et al., 2013; Faust et al., 2015). CINs are also responsible for their own feedback inhibition through an as yet unidentified source (Sullivan et al., 2008). When synchronously activated, CINs produce a large and long-lasting IPSC in SPNs in brain slices that contain distinct GABAAslow and GABAAfast components. This inhibition is also observed in vivo as a reduction of SPN firing following CIN activation (English et al., 2012). Based on the synaptic connections and inhibition kinetics determined from the ex vivo optogenetic and paired recording experiments, it appears that this cholinergic inhibition is mediated through striatal interneurons. This observation suggests that striatal interneurons under cholinergic control may influence striatal information processing in a cortical-independent manner.
In addition to the nicotinic innervation of striatal interneurons, CINs also provide a source of nicotinic input to nigrostriatal and mesaoaccumbens dopamine terminals that evokes dopamine release in both dorsal and ventral striatum (Cachope et al., 2012; Threlfell et al., 2012). With the recent demonstration that nigrostriatal terminals can co-release GABA and produce inhibition in SPNs with slow decay kinetics in ex vivo optogenetic experiments (Tritsch et al., 2012, 2014), it has been reported that the majority of the nicotinic-induced inhibition of SPNs is caused by GABA release from these terminals rather than by local interneurons, and that following either nigrostriatal pathway lesion or depletion of dopaminergic vesicles, a significant proportion of nicotinic-induced inhibition is reduced in the optogenetic experiments (Nelson et al., 2014). These data suggest that nigrostriatal terminals are the predominant source of this inhibition, and/or that the disynaptic pathway from CINs to SPNs via GABAergic interneurons is dopamine-sensitive. Therefore, we sought to determine the interneuronal contribution to the cholinergic-induced inhibition by using optogenetics to disconnect interneurons from this disynaptic circuit. If inhibition of ACh-activated striatal GABAergic interneurons failed to affect the CIN-induced SPN inhibition, then the novel, non-canonical mode of GABAergic inhibition of SPNs (Nelson et al., 2014) would be verified. On the other hand, if the CIN-induced inhibition of SPNs were due to activation of the NGF and/or other GABAergic interneurons, then the SPN inhibition ought to be reduced or blocked.
Materials and Methods
Subjects.
All procedures used in this study were performed in agreement with the National Institutes of Health Guide for the Care and Use of Laboratory Animals and with the approval of the Rutgers University Institutional Animal Care and Use Committee. Double-transgenic Htr3a-Cre × ChAT-ChR2 mice [Tg(Htr3a-Cre)NO152Gsat/Mmucd, UC Davis; Tg(Chat-COP4*H134R/EYFP,Slc18a3)6Gfng/J, Jackson Laboratories] were generated and maintained as hemizygotes (Zhao et al., 2011; Gerfen et al., 2013). Mice were housed in groups of up to four per cage and maintained on a 12 h light cycle (07:00 A.M.–07:00 P.M.) with ad libitum access to food and water. A total of seven mice were used, including both males and females.
Intracerebral virus injection.
Mice were anesthetized with isofluorane (1–3%) and placed in a stereotaxic frame. Following a subcutaneous injection of bupivacaine, the scalp was retracted. A craniotomy was drilled above the site of injection, and 0.6 μl AAV5 Ef1a DIO HR3.0-eYFP (HR3.0) was injected into dorsal neostriatum at three sites described by the following coordinates (from bregma): +0.74 mm AP, +1.6 mm ML, −1.75/−2.25/−3.6 mm DV, for a total volume of 1.8 μl. Injections were performed using glass pipettes pulled and cut to an inner diameter of 40–50 μm and an outer diameter of 60–70 μm. Virus was injected at a rate of 9.2 nl/5 s with Nanoject II Auto-Nanoliter Injector (Drummond Scientific Company). Following viral injection, mice were treated with ketoprofen and buprenorphine for analgesia, and allowed to recover and express the viral transgene for 4–6 weeks before experimentation.
Slice preparation and visualized in vitro whole-cell recording.
Mice aged 3–7 months were anesthetized with ketamine (100 mg/kg) and transcardially perfused with an ice-cold/partially frozen N-methyl d-glucamine (NMDG)-based solution comprised of the following (in mm): 103 NMDG, 2.5 KCl, 1.2 NaH2PO4, 30 NaHCO3, 20 HEPES, 25 glucose, 101 HCl, 10 MgSO4, 2 thiourea, 3 sodium pyruvate, 12 N-acetyl cysteine, and 0.5 CaCl2 (saturated with 95% O2/5% CO2, measured to be 300–310 mOsm and 7.2–7.4 pH). The brain was removed, blocked and 350 μm slices cut on a Vibratome 3000. Slices were then incubated in oxygenated NMDG-based solution at 35°C for 5 min, after which they were maintained in oxygenated normal external solution at 25°C until placed in the recording chamber constantly perfused with oxygenated external solution at 30°C. External solution was composed of the following (in mm): 124 NaCl, 2.5 KCl, 26 NaHCO3, 1.2 NaH2PO4, 1 MgCl2, 2 CaCl2, 10 glucose, and 3 sodium pyruvate. Whole-cell voltage-clamp recordings of SPNs were obtained at −70 mV using a CsCl-based internal solution containing the following (in mm): 125 CsCl, 2 MgCl2, 10 HEPES, 4 Na2ATP, 0.4 GTP plus 2 μl/ml AlexaFluor 594 for SPN verification. Current-clamp recordings were obtained with normal internal solution containing the following (in mm): 130 K-methanesulfonate, 10 KCl, 2 MgCl2, 10 HEPES, 4 Na2ATP, 0.4 GTP plus 0.1–0.3% biocytin, pH 7.3–7.4. Pipettes typically exhibited a DC impedance of 3–4 MΩ measured in the recording chamber.
In vitro optical stimulation.
Optogenetic stimulation of channelrhodopsin-2 (ChR2)-expressing neurons in vitro consisted of 1–2 ms duration blue light pulses (465 nm, 1.25 mW/mm2 illumination intensity) delivered from an LED coupled to a 200 μm multimode optical fiber (PlexBright, Plexon) placed at ∼30° above the slice aiming at the recorded neurons. Optogenetic stimulation of HR3.0 consisted of 1 s duration yellow light pulses by wide-field illumination using a high-power (750 mW) LED (590 nm, >5 mW/mm2 illumination intensity). Optogenetic pulses were delivered at 30 s intervals. Because of the pronounced depression in this synaptic pathway (Nelson et al., 2014), we omitted the first ChR-evoked trace from subsequent statistical analysis.
Results
Whole-cell recordings were obtained from SPNs in slices from the ChAT-Chr2 × Htr3a-Cre double-transgenic mice described above. A schematic of the experimental protocol is shown in Figure 1A. Cholinergic neurons were stimulated with a 2 ms pulse from a blue LED causing postsynaptic GABAergic interneurons to fire, as shown for one representative neuron in Figure 1B. On alternate trials, a 1 s long wide-angle yellow LED was simultaneously activated as shown in Figure 1B. The yellow light hyperpolarized the GABAergic interneuron and blocked the spiking in response to activation of ChR2, leaving only a subthreshold depolarization (yellow traces). This example verifies the efficacy of the optogenetic activation of cholinergic interneurons consistently evoking spiking in the GABAergic interneurons, and the complete blockade of the ChAT-ChR2-induced spiking by simultaneous activation of halorhodopsin in the interneuron.
Figure 1.
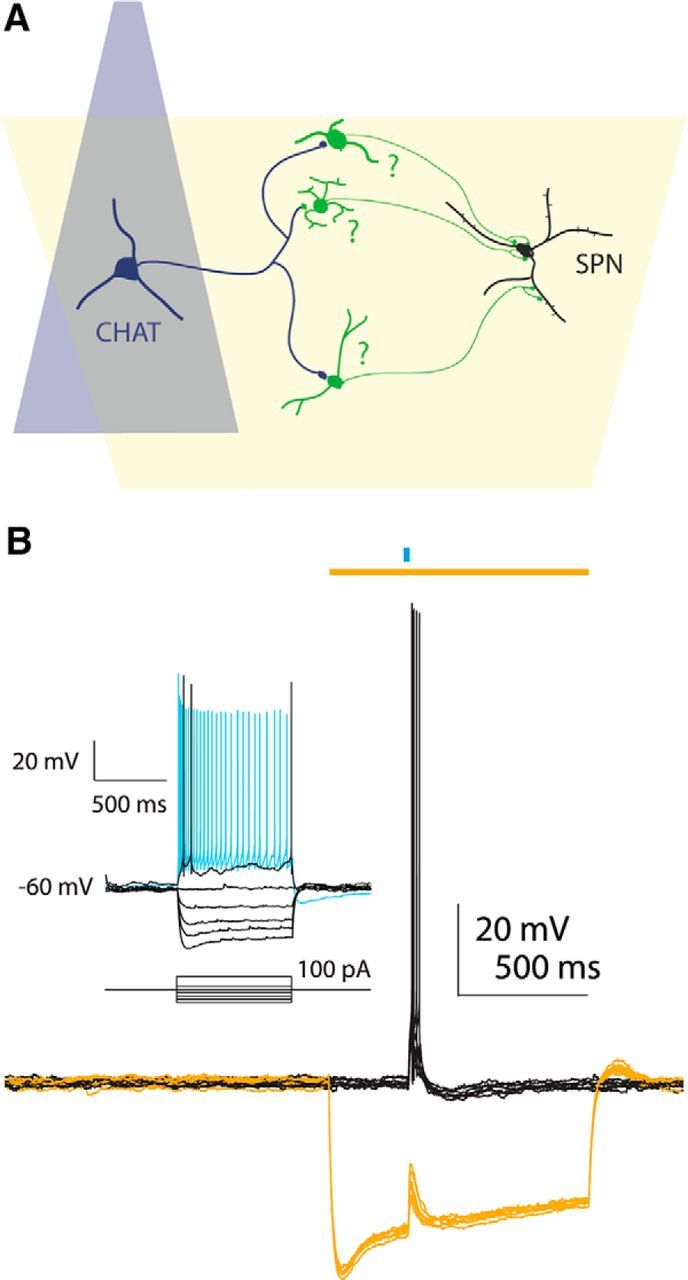
Schematic for examining interneuronal contributions to cholinergic-induced inhibition. A, Diagram of tissue from double-transgenic animals in which cholinergic interneurons (CHAT, dark blue) are activated with a focal blue LED and Htr3a-Cre interneurons (green) are inhibited with a wide angle yellow LED (yellow). B, Example of decoupling an interneuron from the nicotinic circuit. Top, blue bar: 2 ms blue LED stimulus; top, yellow bar: 1 s yellow LED stimulus. Activation of CINs produces nicotinic EPSP and action potentials in the fast-adapting interneuron (black traces). Concurrent inhibition with yellow light hyperpolarizes neuron and prevents EPSP from reaching spike threshold (yellow traces). Inset, Current–voltage responses of the HR3.0-expressing fast-adapting interneuron.
Next we repeated the optical stimulation protocol while recording SPNs in voltage-clamp. Optogenetic activation (1–2 ms blue light pulse) of CINs evoked a large IPSC in SPNs. Simultaneous illumination with yellow light, activating halorhodopsin selectively in the Htr3a-Cre GABAergic interneurons produced a dramatic reduction in the amplitude of the EPSC (Fig. 2), thus demonstrating that a significant proportion of the IPSC originates from local interneurons. In several SPNs there was a distinct delay in IPSC onset and peak following halorhodopsin activation (Fig. 3). This indicates a delay in the latency of the intervening interneurons to fire action potentials following activation of CINs. In one SPN we observed failures on a number of trials both with and without halorhodopsin activation (Fig. 3B, bottom). This also strongly suggests that the sources for this inhibition are neurons rather than axon terminals.
Figure 2.

Cholinergic-induced inhibition in SPNs before and after inhibition of Htr3a-Cre interneurons. A, Voltage-clamp recordings of SPNs from Dbl-Tgn mice following cholinergic activation. Top, blue bar: 1–2 ms blue LED stimulus; top, yellow bar: 1 s yellow LED stimulus. Thin gray traces represent individual control trials following blue LED pulse. Thin yellow traces represent individual HR3.0 trials during simultaneous blue and yellow LED pulses. These two trial types were acquired on an alternating schedule. Black traces represent average of control trials (n = 9, excluding first trial). Red traces represent average of HR3.0 trials (n = 10). B, Voltage-clamp recording of SPN from single-transgenic ChAT-ChR2 mouse following cholinergic activation, using the same color scheme used as in A. Note the lack of IPSC reduction during yellow LED pulses.
Figure 3.

Inhibition of Htr3a-Cre interneurons delays cholinergic-induced IPSC. A, Example SPN from Dbl-Tgn mouse, using same color scheme as in Figure 2. Note that the main effect of HR3.0 in this neuron was the reduction of the fast component and the delay in its onset and peak, observable in the inset. B, Example SPN from Dbl-Tgn mouse, using same color scheme as in Figure 2. Note the increased delay of IPSC onset (black arrow) and peak (white arrows) primarily on HR3.0 trials. Note also the failures experienced by this SPN on both trial types, indicative of unitary sources (individual neurons) failing to fire action potentials.
Because the NPY-NGF interneuron generates only GABAAslow inhibition (Ibáñez-Sandoval et al., 2011; English et al., 2012), we assumed that the fast and slow components of the IPSC that were reduced in this preparation arose from distinct neuronal sources providing either GABAAfast or GABAAslow inhibition. We sought to differentiate these two components as much as possible to determine whether their reduction by halorhodopsin was similar in amount and occurred independently. Although the peaks of the GABAA fast and slow components constitute a variable mixed response of GABAAfast and GABAAslow currents, they represent their respective maximal contributions to the response and occur with a substantial delay between them (Figs. 2, 4A). Therefore, we measured the current reduction at both of these time points to approximate the GABAAfast and GABAAslow components. For example, if the IPSC contribution arising from NPY-NGF interneurons was completely abolished, we would expect this to reduce the slow-peak component much more than that of the fast-peak. The peak of the slow component was observed in a small number of cells (n = 9) to occur distinct from the fast component on average 41.0 ± 2.6 ms (mean ± SEM) after the blue light pulse (Fig. 4A).
Figure 4.
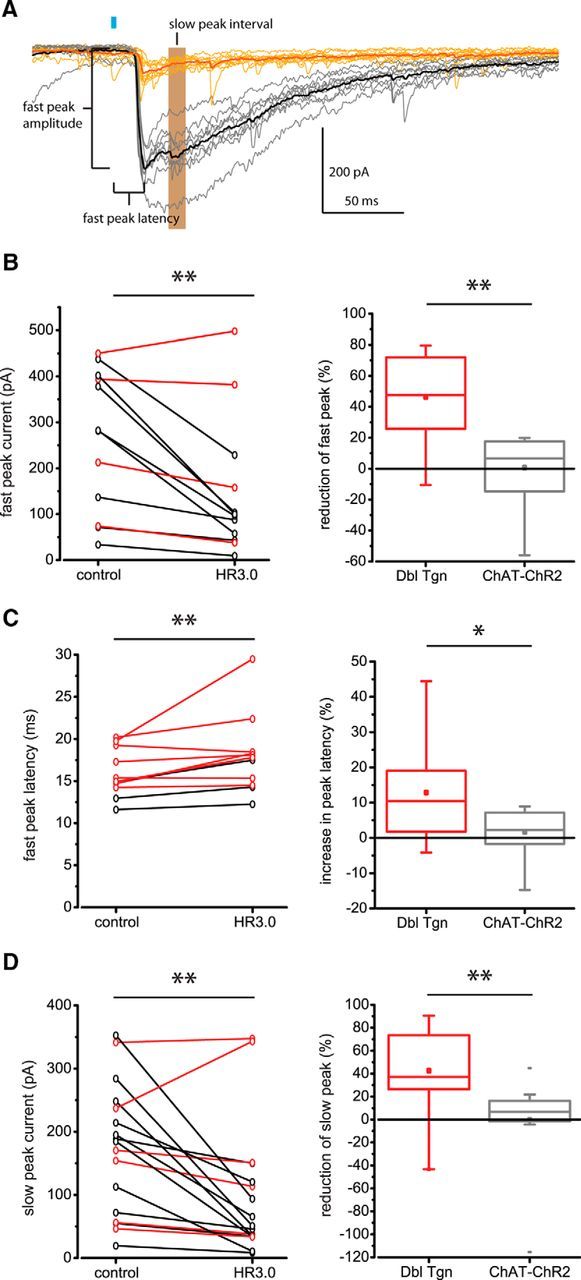
Statistical analysis of HR3.0 effect on IPSC kinetics. A, Example voltage-clamp recording of SPN from Dbl-Tgn mouse as in Figure 2, following the same color scheme. For this SPN, note the presence of both GABAA fast and GABAA slow peaks for the control traces (black, gray). The IPSC fast-peak amplitude, latency, and slow-peak interval used to quantify IPSC amplitude and delay are detailed. Blue bar: 2 ms blue LED stimulus. B–D, Left, Within-group examination of HR3.0 effect on IPSC amplitude and latency for individual Dbl-Tgn SPNs. Black traces represent average responses in SPNs, where HR3.0 significantly affected the IPSC amplitude or latency (p < 0.05, paired-sample t test or paired-sample Wilcoxon signed rank test of individual control and HR3.0 trials, such as the thin gray and yellow traces in A). Red traces represent average responses in SPNs, where HR3.0 failed to do so (p > 0.05). **p < 0.01; paired-sample Wilcoxon signed rank test, using average responses for each SPN. Right, Between-group examination of normalized percentage IPSC reduction or delay in SPNs from Dbl-Tgn mice or single-transgenic ChAT-ChR2 control mice. Box plot bars represent minimum (bottom attached bar), Q1 (box bottom), Q2 (middle line), Q3 (box top), and maximum values (top attached bar). Mean represented by central dot. Detached bars represent outliers (values lesser or greater than Q1, Q3 ± 1.5 IQR). Note the large range in slow- and fast-peak IPSC reduction for the Dbl-Tgn group. **p < 0.01, Mann–Whitney test; *p < 0.05, two sample t test.
The IPSC fast-peak amplitude and latency, and the average amplitude during an interval approximating the slow peak (35–45 ms), were used to determine the proportion of SPNs that experienced significant reductions in inhibition amplitude or latency (Fig. 4A). Comparing control and HR3.0 trials, 66.7% (8/12) of SPNs exhibited a significant reduction of fast-peak amplitude, 25% (3/12) of SPNs exhibited a significant increase in the fast-peak latency, and 64.7% (11/17) of SPNs exhibited a significant reduction in the slow-peak amplitude (p < 0.05, paired sample t test, or paired sample Wilcoxon signed rank test). As a group, SPNs from the double-transgenic animals exhibited a significant reduction in fast-peak amplitude [Fig. 4B, left; n = 12; control 281.8 ± 310.4 pA, median ± interquartile range (IQR), HR3.0 98.0 ± 164.7 pA, median ± IQR; p = 4.88e-3 z = −2.63, W = 5; paired sample Wilcoxon signed rank test] a significant increase in fast-peak latency (Fig. 4C, left; n = 12; control 15.0 ± 4.4 ms, median ± IQR; HR3.0 17.8 ± 3.7 ms, median ± IQR; p = 5.37e-3, z = −2.59, W = 5.5; paired sample Wilcoxon signed rank test) and a significant reduction in slow-peak amplitude (Fig. 4D, left; n = 17; control 184.5 ± 177.1 pA, median ± IQR; HR3.0 51.0 ± 100.9, median ± IQR; p = 1.07e-3, z = −3.03, W = 12; paired sample Wilcoxon signed rank test).
To control for any potential artifact of the yellow light illumination itself, we performed the same recordings on a limited number of SPNs from ChAT-ChR2 single-transgenic animals (Fig. 2B). In these recordings, no SPNs exhibited any reduction of the fast- or slow-peak amplitude, or an increase in fast-peak latency as a result of yellow light application [using the same criterion as for the double-transgenic (Dbl-Tgn) group of p < 0.05, paired sample t test or paired sample Wilcoxon signed rank test]. Compared with this group, the double-transgenic group evidenced a significant reduction in fast-peak amplitude (Fig. 4B, right; Dbl-Tgn: n = 12; 48.3 ± 44.1% median ± IQR; ChAT-ChR2: n = 8, 7.7 ± 28.4%, median ± IQR; p = 6.2e-3, z = 2.74, U = 84; Mann–Whitney test), a significant increase in fast-peak latency (Fig. 4C, right; Dbl-Tgn: n = 12, 12.9 ± 3.9%, mean ± SEM; ChAT-ChR2: n = 8, 1.7 ± 2.7%, mean ± SEM; p = 4.6e-2, t = 2.1384; two sample t test) and a significant reduction of slow-peak amplitude (Fig. 4D, right; Dbl-Tgn: n = 17, 37.1 ± 54.0%, median ± IQR; ChAT-ChR2: n = 11, 6.7 ± 17.9%, median ± IQR; p = 3.54e-3, z = 2.92, U = 156; Mann–Whitney test).
We observed a wide range of IPSC amplitudes in SPNs in response to ChAT-ChR2 activation, and a wide range of IPSC reductions in the double-transgenic group. We aimed to test the concern that the variability in IPSC reduction was a function of initial IPSC amplitude. If nigrostriatal terminals were responsible for a consistent amount of inhibition to SPNs, we would expect IPSC amplitude and percentage reduction to be positively correlated, as larger IPSCs that rely more on interneurons and would be reduced more by HR3.0. Conversely, if interneurons were responsible for a consistent amount of inhibition to SPNs, we would expect IPSC amplitude and percentage reduction to be negatively correlated, as larger IPSCs that rely more on nigrostriatal terminals would be reduced less by HR3.0. Because the ChR2-induced IPSC exhibits a strong and long-lasting paired-pulse depression (Nelson et al., 2014), we used the initial IPSC amplitudes from each SPN to describe the maximal response. There was no correlation between initial amplitude and percentage reduction (fast-peak slope = −0.025, r2 = −0.035; slow-peak slope = −0.029, r2 = −0.020; Pearson's product-moment correlation; Fig. 5A,B). Therefore, we assume that the variability of IPSC reduction is due to variable interneuron control by HR3.0. It is also possible that the lack of correlation reflects the scenario in which relative contributions of interneurons and nigrostriatal terminals vary independently of each other and IPSC amplitude, but even in this case, the strong average HR3.0-mediated IPSC reduction is proof that the interneuron source accounts for a large part of the inhibition, for both small and large IPSCs.
Figure 5.

Relationship between IPSC reduction and amplitude. A, Correlation between the IPSC first acquired trace (largest gray traces; Fig. 2A) and percentage reduction for the fast peak. B, Correlation between the IPSC first acquired trace (largest gray traces; Fig. 2A) and percentage reduction for the slow peak. Although there are negative trends in both A and B, no significant correlations were observed. C, Correlation between fast-peak and slow-peak percentage reduction for all SPNs exhibiting significant reductions in at least one of these two components. Note the strong linear correlation between these two responses.
Although there was a large range in percentage reduction for both the fast-peak responses and the slow-peak responses, we were unsure what the relationship between them was. Both fast- and slow-peak responses contain varying contributions from GABAA fast and slow sources, depending on the SPN. If there were SPNs in which one component was reduced much more than the other (Fig. 3A), this would indicate that GABAA fast and slow inhibitory sources are being suppressed independently by HR3.0. Contrary to this notion, we found a significant correlation between fast- and slow-peak reduction (Fig. 4C; r2 = 0.86, slope = 0.636, p < 0.01; Pearson's product-moment correlation). This suggests that although there are distinct sources of this inhibition, their decoupling from the cholinergic circuit may occur through a common mechanism.
Discussion
By hyperpolarizing populations of striatal interneurons with HR3.0, we were able to reduce both the fast and slow components of cholinergic-mediated GABAergic inhibition in SPNs in a fast and reversible manner, causally demonstrating an interneuronal source of this inhibition. However, the rate of reduction was highly variable among SPNs, with some exhibiting no reduction and others up to 79.6% reduction for the fast peak and 90.5% reduction for the slow peak. This high ceiling of the reduction indicates that interneurons are the primary source of this cholinergic-induced inhibition under these conditions. As there are fewer interneurons per SPN than nigrostriatal terminals per SPN, we expect a greater variability for the interneuronal contribution based on which interneurons are successfully decoupled from the circuit by HR3.0.
If the inhibition originates mostly from interneurons targeted in the Htr3a-Cre mouse, why did this paradigm sometimes fail? Incomplete or absent reduction of the IPSC can be ascribed to several technical failures. First, it is clear that not all interneurons responsible for generating ACh-linked IPSCs are targeted in the Htr3a-Cre mouse. For example, TH interneurons are not targeted in this Cre mouse, and provide powerful inhibition of SPNs as well as receive strong excitation via nicotinic receptors (Luo et al., 2013; Ibáñez-Sandoval et al., 2015). Striatal NPY-PLTS interneurons are also not targeted in the Htr3a-Cre mouse (Faust et al., 2015). Among the GABAergic interneurons that are targeted, the magnitude of the IPSC reduction is likely a function of both transfection efficiency, as well as the location of SPNs within the transfection field. Last, failure of HR3.0-induced hyperpolarization to completely prevent action potential initiation and subsequent GABA release would result in an incomplete reduction of the IPSC. If we assume that nigrostriatal terminals produce a consistent inhibition among SPNs, then the maximal reduction we were able to produce in our preparation represents the minimal contribution from GABAergic interneurons.
How can these results and interpretations be reconciled with the notion that release of GABA from nigrostriatal terminals also inhibits SPNs in the same manner? If there were a large, consistent nigrostriatal contribution, we would have expected a lower ceiling of IPSC reduction, rather than the 80–90% we observed. Some divergence in results may derive from the different ChR2 expression levels in the ChAT-ChR2 mouse used in this study versus the viral expression under ChAT-Cre targeting (English et al., 2012; Nelson et al., 2014). In our preparation, CINs consistently fired action potentials upon blue light stimulation. Yet if ChR2-mediated acetylcholine release is different between these two preparations, this may affect the amount of nigrostriatal GABA release and additionally explain the differences in IPSC amplitudes observed. Perhaps most important to our preparation, nigrostriatal dopamine neurons load GABA by a non-canonical mechanism and display a strong synaptic rundown of GABAergic inhibition (Tritsch et al., 2012, 2014), that is well outside of the range of their autoreceptor-mediated depression of dopamine release (Phillips et al., 2002). Taking these differences into account, it is likely that the recovery time of vesicular GABA may be much longer than that observed for dopamine or for other inhibitory synapses in the striatum (Planert et al., 2010). In our hands, the use of CHR2.0-eYFP and blue light for locating the transfection field may have depleted the nigrostriatal vesicular pool of GABA for the duration of these experiments. Another potential explanation of these differences may be that nigrostriatal deletion or depletion alters the strength of the disynaptic interneuronal circuits in a rapid manner, similar to that observed in SPN–SPN connections (Taverna et al., 2008).
The reductions in the GABAA fast-peak amplitude and latency came as a surprise to us, considering we did not believe that any striatal interneurons targeted in Ht3a-Cre transgenic fit the criteria necessary to be a major source of this inhibition. These criteria include a strong inhibition of SPNs and a DHβE-sensitive suprathreshold input from CINs. The FAI, which is targeted in the Htr3a-Cre mouse, is excited by cholinergic activation, but as a population is not DHβE-sensitive, and exhibits on average a low release probability, low-amplitude IPSC at the SPN cell body (Faust et al., 2015). The other novel interneurons targeted in the Htr3a-Cre resembled TH interneurons, but similarly did not fit the criteria (Faust et al., 2015). If none of these neurons are responsible for the fast component of the inhibition, why was it reduced?
Our results indicate that a source of the fast inhibition is not only being reduced by HR3.0 activation but that these sources' increased latency to fire action potentials in response to ChAT-ChR2 activation is the result of an outward current in those interneurons not always strong enough to prevent action potentials but only to delay them. The two sources for this outward current could be either a polysynaptic disinhibitory circuit or electrical synapses between interneurons. This unknown synaptic source would also be the candidate for the reduction of the fast component of the IPSC.
This study verifies that striatal GABAergic interneurons are responsible for cholinergic-induced inhibition of SPNs under our ex vivo conditions. Although these interneuronal sources are incompletely described and relatively rare (Ibáñez-Sandoval et al., 2011), they provide a majority of the inhibition to SPNs from CINs. If these results did not demonstrate this, it could be argued that this unique excitatory input to rare GABAergic interneurons is an oddity non-integral to normal striatal function. An extension of these results implies that striatal cholinergic circuits have complex machinery and operate in a semiautonomous manner from cortical control. We suggest that the characteristic brief firing rate changes of CINs that are associated with stimuli of innate and learned significance may be transmitted with high fidelity to projection neurons through nicotinic control of the activity of specialized classes of GABAergic interneurons.
Footnotes
This work was supported by grants NS072950 (T.K., J.M.T.) and NS034865 (J.M.T.), and Rutgers University. We thank Fulva Shah and Arpan Garg for excellent technical assistance.
The authors declare no competing financial interests.
References
- Bennett BD, Bolam JP. Synaptic input and output of parvalbumin-immunoreactive neurons in the neostriatum of the rat. Neuroscience. 1994;62:707–719. doi: 10.1016/0306-4522(94)90471-5. [DOI] [PubMed] [Google Scholar]
- Cachope R, Mateo Y, Mathur BN, Irving J, Wang HL, Morales M, Lovinger DM, Cheer JF. Selective activation of cholinergic interneurons enhances accumbal phasic dopamine release: setting the tone for reward processing. Cell Rep. 2012;2:33–41. doi: 10.1016/j.celrep.2012.05.011. [DOI] [PMC free article] [PubMed] [Google Scholar]
- English DF, Ibáñez-Sandoval O, Stark E, Tecuapetla F, Buzsáki G, Deisseroth K, Tepper JM, Koós T. GABAergic circuits mediate the reinforcement-related signals of striatal cholinergic interneurons. Nat Neurosci. 2012;15:123–130. doi: 10.1038/nn.2984. [DOI] [PMC free article] [PubMed] [Google Scholar]
- Faust TW, Assous M, Shah F, Tepper JM, Koós T. Novel fast adapting interneurons mediate cholinergic-induced fast GABAA inhibitory postsynaptic currents in striatal spiny neurons. Eur J Neurosci. 2015;42:1764–1774. doi: 10.1111/ejn.12915. [DOI] [PMC free article] [PubMed] [Google Scholar]
- Gerfen CR, Paletzki R, Heintz N. GENSAT BAC Cre-recombinase driver lines to study the functional organization of cerebral cortical and basal ganglia circuits. Neuron. 2013;80:1368–1383. doi: 10.1016/j.neuron.2013.10.016. [DOI] [PMC free article] [PubMed] [Google Scholar]
- Gittis AH, Nelson AB, Thwin MT, Palop JJ, Kreitzer AC. Distinct roles of GABAergic interneurons in the regulation of striatal output pathways. J Neurosci. 2010;30:2223–2234. doi: 10.1523/JNEUROSCI.4870-09.2010. [DOI] [PMC free article] [PubMed] [Google Scholar]
- Gittis AH, Leventhal DK, Fensterheim BA, Pettibone JR, Berke JD, Kreitzer AC. Selective inhibition of striatal fast-spiking interneurons causes dyskinesias. J Neurosci. 2011;31:15727–15731. doi: 10.1523/JNEUROSCI.3875-11.2011. [DOI] [PMC free article] [PubMed] [Google Scholar]
- Goldberg JA, Reynolds JN. Spontaneous firing and evoked pauses in the tonically active cholinergic interneurons of the striatum. Neuroscience. 2011;198:27–43. doi: 10.1016/j.neuroscience.2011.08.067. [DOI] [PubMed] [Google Scholar]
- Goldberg JA, Ding JB, Surmeier DJ. Muscarinic modulation of striatal function and circuitry. Handb Exp Pharmacol. 2012;208:223–241. doi: 10.1007/978-3-642-23274-9_10. [DOI] [PubMed] [Google Scholar]
- Ibáñez-Sandoval O, Tecuapetla F, Unal B, Shah F, Koós T, Tepper JM. A novel functionally distinct subtype of striatal neuropeptide Y interneuron. J Neurosci. 2011;31:16757–16769. doi: 10.1523/JNEUROSCI.2628-11.2011. [DOI] [PMC free article] [PubMed] [Google Scholar]
- Ibáñez-Sandoval O, Xenias HS, Tepper JM, Koós T. Dopaminergic and cholinergic modulation of striatal tyrosine hydroxylase interneurons. Neuropharmacology. 2015;95:468–476. doi: 10.1016/j.neuropharm.2015.03.036. [DOI] [PMC free article] [PubMed] [Google Scholar]
- Kita H. Glutamatergic and GABAergic postsynaptic responses of striatal spiny neurons to intrastriatal and cortical stimulation recorded in slice preparations. Neuroscience. 1996;70:925–940. doi: 10.1016/0306-4522(95)00410-6. [DOI] [PubMed] [Google Scholar]
- Kita H, Kosaka T, Heizmann CW. Parvalbumin-immunoreactive neurons in the rat neostriatum: a light and electron microscopic study. Brain Res. 1990;536:1–15. doi: 10.1016/0006-8993(90)90002-S. [DOI] [PubMed] [Google Scholar]
- Koós T, Tepper JM. Inhibitory control of neostriatal projection neurons by GABAergic interneurons. Nat Neurosci. 1999;2:467–472. doi: 10.1038/8138. [DOI] [PubMed] [Google Scholar]
- Koós T, Tepper JM, Wilson CJ. Comparison of IPSCs evoked by spiny and fast-spiking neurons in the neostriatum. J Neurosci. 2004;24:7916–7922. doi: 10.1523/jneurosci.2163-04.2004. [DOI] [PMC free article] [PubMed] [Google Scholar]
- Luo R, Janssen MJ, Partridge JG, Vicini S. Direct and GABA-mediated indirect effects of nicotinic ACh receptor agonists on striatal neurones. J Physiol. 2013;591:203–217. doi: 10.1113/jphysiol.2012.241786. [DOI] [PMC free article] [PubMed] [Google Scholar]
- Mallet N, Le Moine C, Charpier S, Gonon F. Feedforward inhibition of projection neurons by fast-spiking GABA interneurons in the rat striatum in vivo. J Neurosci. 2005;25:3857–3869. doi: 10.1523/JNEUROSCI.5027-04.2005. [DOI] [PMC free article] [PubMed] [Google Scholar]
- Nelson AB, Hammack N, Yang CF, Shah NM, Seal RP, Kreitzer AC. Striatal cholinergic interneurons drive GABA release from dopamine terminals. Neuron. 2014;82:63–70. doi: 10.1016/j.neuron.2014.01.023. [DOI] [PMC free article] [PubMed] [Google Scholar]
- Phillips PE, Hancock PJ, Stamford JA. Time window of autoreceptor-mediated inhibition of limbic and striatal dopamine release. Synapse. 2002;44:15–22. doi: 10.1002/syn.10049. [DOI] [PubMed] [Google Scholar]
- Planert H, Szydlowski SN, Hjorth JJ, Grillner S, Silberberg G. Dynamics of synaptic transmission between fast-spiking interneurons and striatal projection neurons of the direct and indirect pathways. J Neurosci. 2010;30:3499–3507. doi: 10.1523/JNEUROSCI.5139-09.2010. [DOI] [PMC free article] [PubMed] [Google Scholar]
- Ramanathan S, Hanley JJ, Deniau JM, Bolam JP. Synaptic convergence of motor and somatosensory cortical afferents onto GABAergic interneurons in the rat striatum. J Neurosci. 2002;22:8158–8169. doi: 10.1523/JNEUROSCI.22-18-08158.2002. [DOI] [PMC free article] [PubMed] [Google Scholar]
- Rudkin TM, Sadikot AF. Thalamic input to parvalbumin-immunoreactive GABAergic interneurons: organization in normal striatum and effect of neonatal decortication. Neuroscience. 1999;88:1165–1175. doi: 10.1016/S0306-4522(98)00265-6. [DOI] [PubMed] [Google Scholar]
- Sidibé M, Smith Y. Thalamic inputs to striatal interneurons in monkeys: synaptic organization and co-localization of calcium binding proteins. Neuroscience. 1999;89:1189–1208. doi: 10.1016/S0306-4522(98)00367-4. [DOI] [PubMed] [Google Scholar]
- Sullivan MA, Chen H, Morikawa H. Recurrent inhibitory network among striatal cholinergic interneurons. J Neurosci. 2008;28:8682–8690. doi: 10.1523/JNEUROSCI.2411-08.2008. [DOI] [PMC free article] [PubMed] [Google Scholar]
- Szydlowski SN, Pollak Dorocic I, Planert H, Carlén M, Meletis K, Silberberg G. Target selectivity of feedforward inhibition by striatal fast-spiking interneurons. J Neurosci. 2013;33:1678–1683. doi: 10.1523/JNEUROSCI.3572-12.2013. [DOI] [PMC free article] [PubMed] [Google Scholar]
- Taverna S, Ilijic E, Surmeier DJ. Recurrent collateral connections of striatal medium spiny neurons are disrupted in models of Parkinson's disease. J Neurosci. 2008;28:5504–5512. doi: 10.1523/JNEUROSCI.5493-07.2008. [DOI] [PMC free article] [PubMed] [Google Scholar]
- Tepper JM, Koós T. Steiner H, Tseng K, editors. Striatal GABAergic interneurons. Handbook of basal ganglia structure and function. (Ed 2) 2016 in press. [Google Scholar]
- Threlfell S, Lalic T, Platt NJ, Jennings KA, Deisseroth K, Cragg SJ. Striatal dopamine release is triggered by synchronized activity in cholinergic interneurons. Neuron. 2012;75:58–64. doi: 10.1016/j.neuron.2012.04.038. [DOI] [PubMed] [Google Scholar]
- Tritsch NX, Ding JB, Sabatini BL. Dopaminergic neurons inhibit striatal output through non-canonical release of GABA. Nature. 2012;490:262–266. doi: 10.1038/nature11466. [DOI] [PMC free article] [PubMed] [Google Scholar]
- Tritsch NX, Oh WJ, Gu C, Sabatini BL. Midbrain dopamine neurons sustain inhibitory transmission using plasma membrane uptake of GABA, not synthesis. Elife. 2014;3:e01936. doi: 10.7554/eLife.01936. [DOI] [PMC free article] [PubMed] [Google Scholar]
- Zhao S, Ting JT, Atallah HE, Qiu L, Tan J, Gloss B, Augustine GJ, Deisseroth K, Luo M, Graybiel AM, Feng G. Cell-type specific optogenetic mice for dissecting neural circuitry function. Nat Methods. 2011;8:745–752. doi: 10.1038/nmeth.1668. [DOI] [PMC free article] [PubMed] [Google Scholar]