Abstract
Ovarian cancer is a fatal gynaecological malignancy in adult women with a five-year overall survival rate of only 30%. Glycomic and glycoproteomic profiling studies have reported extensive protein glycosylation pattern alterations in ovarian cancer. Therefore, spatio-temporal investigation of these glycosylation changes may unearth tissue-specific changes that occur in the development and progression of ovarian cancer. A novel method for investigating tissue-specific N-linked glycans is using matrix-assisted laser desorption/ionization (MALDI) mass spectrometry imaging (MSI) on formalin-fixed paraffin-embedded (FFPE) tissue sections that can spatially profile N-glycan compositions released from proteins in tissue-specific regions. In this study, tissue regions of interest (e.g. tumor, stroma, adipose tissue and necrotic areas) were isolated from FFPE tissue sections of advanced serous ovarian cancers (n = 3). PGC-LC-ESI-MS/MS and MALDI-MSI were used as complementary techniques to firstly generate structural information on the tissue-specific glycans in order to then obtain high resolution images of the glycan structure distribution in ovarian cancer tissue. The N-linked glycan repertoires carried by the proteins in these tissue regions were structurally characterized for the first time in FFPE ovarian cancer tissue regions, using enzymatic peptide-N-glycosidase F (PNGase F) release of N-glycans. The released glycans were analyzed by porous graphitized carbon liquid chromatography (PGC-LC) and collision induced electrospray negative mode MS fragmentation analysis. The N-glycan profiles identified by this analysis were then used to determine the location and distribution of each N-glycan on FFPE ovarian cancer sections that were treated with PNGase F using high resolution MALDI-MSI. A tissue-specific distribution of N-glycan structures identified particular regions of the ovarian cancer sections. For example, high mannose glycans were predominantly expressed in the tumor tissue region whereas complex/hybrid N-glycans were significantly abundant in the intervening stroma. Therefore, tumor and non-tumor tissue regions were clearly demarcated solely on their N-glycan structure distributions.
Ovarian cancer is the fifth most fatal malignancy in adult women with an estimated 21,290 new cases diagnosed and 14,180 deaths recorded in the United States during 2015 (1). There are several reasons for the poor prognosis of ovarian cancer and its diagnosis at advanced stage—lack of diagnostic markers for the early detection (2, 3), rapid metastasis of the disease (4), and limited or modest understanding of the etiology, origin and the diverse clinical and pathological behavior of the tumors (5). Moreover, epithelial ovarian cancer comprises of several distinct sub-types based on their histopathological features into serous, endometrioid, clear-cell, mucinous, and undifferentiated subtypes (6, 7).
Protein glycosylation is an important post-translational modification which has relevance in many biological processes such as cell signaling, immune responses, extracellular interaction and cell adhesion (8, 9). Aberrant protein glycosylation such as the expression of truncated glycans as well as neo-expression of glycans are hallmarks of various cancers (10–12). These glycomic changes facilitate the discrimination between healthy and cancerous cells or potentially reflect tumor microheterogeneity caused by the variation between cancer subtypes (13, 14). Increased branching of N-glycans is a commonly observed glycosylation change in cancer, which has been shown to alter the overall structure and function of the glycoprotein (15–17). For example, the synthesis of increased branching antennas on the glycans creates available sites for the addition of sialic acids (Neu5Ac) by sialyltransferases, leading to increased sialylation being reported in many cancers (18–21). Similarly, changes in the expression of long chains of lactosamine (polyLacNAc) have also been reported to be associated with cancer (15). Likewise, terminal modifications of glycans on the cancer cell surface, such as fucosylation, give rise to the presence of Lewis and sialyl Lewis antigens that have been implicated in tumor progression and metastasis (22–26). These aberrant glycosylations play a significant role in malignant transformation and therefore afford a valuable opportunity to exploit cancer-specific protein glycosylation markers for prognosis and diagnosis (16).
Mass spectrometry (MS)-based glycomic methodologies are now regularly used for the reliable profiling of glycans from clinical samples (17–22). In fact, MS identification and measurement of glycans are being pursued as a structurally-informative approach as opposed to the clinically-established immunological assays (23–25) or arrays (26). Several quantitative glycomic profiling studies have identified N-glycan changes that were statistically elevated in ovarian cancer patients' plasma (17, 27–29). A significant increase in branching and sialylation patterns as well as increased expression of α2–6 sialylation in ovarian cancer plasma as compared with healthy controls have been reported (28). Saladova et al., reported specific N-glycosylation changes on serum glycoproteins from ovarian cancer patients, including a decrease in galactosylation of IgG and an increase in sialyl Lewis X (SLe(x) on haptoglobin beta-chain, alpha1-acid glycoprotein and alpha1-antichymotrypsin (30). We have also observed membrane glycosylation changes between non-cancerous ovarian surface epithelial (HOSE 6.3 and HOSE 17.1) and serous ovarian cancer cell lines (SKOV 3, IGROV1, A2780, and OVCAR3) (31). The “bisecting N-acetyl-glucosamine” type N-glycans, increased levels of α 2–6 sialylated N-glycans and “N,N′-diacetyl-lactosamine” type N-glycans were predominantly observed in serous ovarian cancer cell lines while absent in the noncancerous ovarian cells. Most of these studies yielded clinically relevant information on the differential expression of glycans, but the major focus of their analysis was on plasma based tests to differentiate between healthy and diseased patients rather on the spatial tissue location of the expressed glycans.
To address this challenge, we have employed glycomic profiling strategy to first identify the detailed N-glycan structural changes that occur on different regions of FFPE ovarian tissues clinically diagnosed as serous ovarian cancer. Routine mass spectrometric glycoanalysis is well-established and reliable, but the analysis of whole tissues destroys any information relating to the spatial distribution of the analytes. Matrix-assisted laser desorption/ionization (MALDI) 1 mass spectrometry imaging (MSI) is an emerging technique that seeks to utilize the analytical advantages of mass spectrometry while preserving the spatial information of the biological molecule of interest inherent in the sample. The unambiguous correlation between histopathology and MALDI-MSI allows the mass measurement of sugars, proteins, peptides, lipids, and metabolites directly from tissue regions. The distribution and intensity of the detected biomolecules can then be visualized as an image. Furthermore, conventional histological staining can be compared on the same tissue section. Overlaying the MS images and optical microscope morphological images then can differentiate the specific molecules in each minute tissue section and can relate molecular distribution to the biological functions and morphological changes of an organ/organelle.
MALDI-MSI can be used for both targeted and untargeted molecular mass analysis. A typical example of a targeted analysis is the measurement of a single metabolite mass distribution in tissue, whereas untargeted analysis could include the mass distribution of biomolecules such as protein, lipid or carbohydrates in a tissue. Some MALDI-MSI applications include gaining a fundamental understanding of the expression of biomolecules in a disease state, investigating and characterizing the biomolecules spatially across tissue sections, and developing new ways of imaging in situ There have been a few MALDI-MSI based analyses on the spatial localization of N-glycans on tissue (32–35). Recently glycan MALDI-MSI was used to image released glycan masses from Tissue MicroArrays (TMAs) of liver cancer in which many small tumor tissue samples from different patients were assembled on a single slide, and provided proof of concept that released glycans could be imaged on FFPE liver cancer tissue sections (33).
Specifically, in this study we (1) identify the structural glycan features that are characteristic of serous ovarian cancer specimens by detailed PGC-LC-ESI-MS/MS, (2) use this information to identify a panel of tissue-specific glycan markers in order to discriminate between tumor and nontumor tissue by high resolution MALDI-MSI, and (3) perform a rigorous evaluation of the tissue diagnostic glycan structures using independent statistical procedures. It is envisioned that the identification of the differential localization of glycan structures may improve ovarian cancer diagnosis and further lead to novel therapeutic strategies to improve survival rates for this malignancy.
MATERIALS AND METHODS
Reagents
Glycerol free PNGase F (P0705L, 75,000 NEB units) was purchased from New England Biolabs (Ipswich, MA). DHB matrix were purchased from Sigma-Aldrich (Steinheim, Germany) and Bruker Daltonics (Bremen, Germany). Formalin was from Sigma-Aldrich. Trifluoroacetic acid (TFA), ethanol and NaCl were from Merck (Darmstadt, Germany). Nitrocellulose membranes (0.025 μm VSWP) for dialysis were purchased from Millipore (Cork, Ireland). Xylene was purchased from Chem-Supply (Gillman, South Australia). Indium tin oxide (ITO) slides were purchased from Bruker Daltonics, whereas PEN membrane slides were from MicroDissect (Herborn, Germany). GLY3 standards (Man5GlcNAc2, Man3GlcNAc5, Man3Gal4GlcNAc6) were purchased from Prozyme (Hayward, CA). Unless otherwise stated, all H2O used was ultrapure (i.e. ≥18.2 MΩ and ≤5 ppb TOC).
Tissue Sectioning
Tissue sectioning was performed as previously described with some minor modifications (36). Ovarian tumors tissue was taken from FIGO stage III ovarian cancer patients as part of experiments with full ethics approval and in accordance with the policies of the University of Adelaide Ethics Committee. Formalin was diluted 1:9.25 in 1× PBS and tissues were immersed in this solution overnight at 4 °C. Tissue was then removed from the formalin, rinsed with de-ionized H2O and stored in 70% EtOH before processing with a Leica TP 1020 processor (Leica Biosystems, North Ryde, Australia). Protocol: 70% EtOH for 5 min, 80% EtOH for 2 h, 95% EtOH for 2 h, 3 × 100% EtOH for 2 h each, 2× xylene for 2 h each and 2× paraffin for 2 h each. A Leica EG 114OH embedder (Leica Biosystems) was used to create paraffin embedded tissue blocks. FFPE blocks were sectioned (6 μm thick) on a Microm HM325 microtome (Zeiss, Göttingen, Germany) and water bath mounted (39 °C) onto ITO slides (Bruker Daltonics) or PEN membrane slides (MicroDissect). Slides were left to dry at 37 °C for one hour prior to storage at 4 °C.
PGC-LC-ESI-Ion Trap MS and MS/MS Analysis of N-glycans Released from FFPE Tissue Sections
In-solution PNGase F Digestion
Tissue sections on PEN membrane slides (n = 3) were used and processed as described previously (34), with modifications. Briefly, following a 5 min 60 °C heating block incubation, 90 s xylene wash and 60 s EtOH wash, the whole FFPE tissue section was scraped off slide by a scalpel and deposited into micro-vials. The tissue sections were incubated (2 × 5 min) in 10 mm NH4HCO3. Solution was removed and replaced with 10 mm citric acid (pH 6) and heated at 98 °C for 45 min. The samples were washed twice with 10 mm NH4HCO3. Glycerol free PNGase F (2 μl, non-dialyzed) was added to the FFPE tissue in a 40 μl total reaction volume (with 25 mm NH4HCO3). The tissue digests were left overnight at 37 °C.
N-linked Glycan Release
The released N-linked glycans were reduced and desalted according to previously described methods (34). After acidification with 100 mm NH4COOH pH 5 (10 μl) for 60 min at room temperature, the samples were dried in a vacuum centrifuge and were reduced with 20 μl of 1 m NaBH4 in 50 mm KOH at 50 °C for 3 h. The reduction was quenched with 1 μl glacial acetic acid and the N-linked glycan alditols were desalted as described below.
Glycan Purification
The released N-glycans were desalted using cation exchange columns comprising 30 μl AG50W-X8 cation-exchange resin (BioRad, Hercules, CA) packed on top of a C18 StageTip Frit. Residual borate was removed by the addition of methanol (×3) and drying under vacuum. The glycans were further purified by tips using porous graphitised carbon slurry manually packed onto C18 StageTip Frits as previously described.
PGC-LC-ESI-Ion Trap MS and MS/MS
The N- were resuspended in 10 μl of milli-Q water and subjected to PGC-LC-ESI MS/MS separation and analysis using an Agilent 1100 capillary LC (Agilent Technologies, Santa Clara, CA) and analyzed using an Agilent MSD, three-dimensional Ion-trap XCT mass spectrometer coupled to the LC. Separation was performed on a Hypercarb Porous Graphitized Carbon column (PGC, 3 μm particle size, 100 × 0.18 mm, Hypercarb, Thermo Scientific). N-linked glycan alditols were separated across an 85 min gradient with a constant flow rate of 2 μl/min using a linear gradient up to 45% (v/v) CH3CN in 10 mm NH4HCO3. ESI-MS was performed in negative ion mode with two scan events; MS full scan with mass range 100–2000 m/z and data dependent MS/MS scan after collision-induced dissociation (CID) of the top two most intense precursor ions.
MALDI-MSI Analysis of N-glycans Released In Situ From FFPE Tissue Sections
Tissue Section Antigen Retrieval
Tissue sections were re-hydrated using a standard procedure for citric acid antigen retrieval (CAAR) (34). Briefly, the tissue sections were heated at 60 °C for 1 h over a heatblock; washed in 100% xylene (2 × 5 min) and 100% ethanol (2 × 2 min). Sections were washed in 10 mm NH4HCO3 (2 × 5 min) followed by a 10 min incubation in boiling 10 mm citric acid (pH 6.0) and then by heating at 98 °C for 30 min on a heating block. Finally, tissue sections were immersed twice in 10 mm NH4HCO3 (1 min) and dried at room temperature in a humid chamber.
In Situ PNGase F Digestion and Matrix Deposition
Neat PNGase F enzyme (40 μl) spotted onto a nitrocellulose membrane and drop dialyzed against water for 2 h at room temperature. NH4HCO3 (25 mm, pH ∼8.2) was added to the dialyzed PNGase F to a total volume of 200 μl and the PNGase F was printed onto retrieved tissue sections (15 nL at 250 μm spacing) using a ChIP-1000 (Shimadzu, Japan). Buffer control arrays (25 mm NH4HCO3) were printed using the same conditions on adjacent sections. Tissue sections were incubated overnight at 37 °C in a humid chamber and GLY3 standard was manually spotted (0.5 μl) on an adjacent section. DHB (20 mg/ml) in 0.1% (v/v) TFA and 1 mm NaCl was sprayed onto prepared tissues using a TM-sprayer. Instrument specific settings: 16 passes, 0.05 ml/min flow rate, 4 psi N2 pressure, 65 °C capillary temperature, 800 mm/min.
MALDI-TOF/TOF Mass Spectrometry and Histological Staining
MS data was acquired using an ultrafleXtreme MALDI-TOF/TOF mass spectrometer (Bruker Daltonics) controlled by flexControl (v3.4, Bruker Daltonics) and flexImaging (v4.0, Bruker Daltonics). Instrument-specific settings were as follows: 800–4500 m/z range, 700 Da matrix suppression, 2 kHz laser repetition rate and 2.5 GS/s. Method-specific settings were as follows: 75% laser power and 2698 V detector gain. A total of 1000 shots were acquired at each position with no walk. Data was acquired by oversampling from an arbitrary array with center to center acquisition distance of 100 μm overlaid onto the 250 μm PNGase F array. The MALDI-TOF/TOF instrument was externally calibrated using the included GLY3 standard spots prior to MALDI imaging.
Following analysis, DHB matrix was eluted using 70% EtOH and tissue sections were hematoxylin and eosin (H&E) stained as described previously (34).
Data Analysis
MALDI-MSI data was analyzed by SCiLS Lab (version 2014a, SCiLS, Bruker Daltonics). Raw data was loaded and reduced to 50,000 points per spectrum. Data was preprocessed by baseline subtraction and normalization to total ion current (TIC). Peaks were picked, aligned and the preprocessed data was used to generate log ion intensity maps. These log ion intensity maps were weakly denoised with automatic hotspot removal. Data analysis of the LC-ESI-MS/MS data was carried out in ESI-Compass 1.3 (Bruker Daltonics, Bremen, Germany).
RESULTS
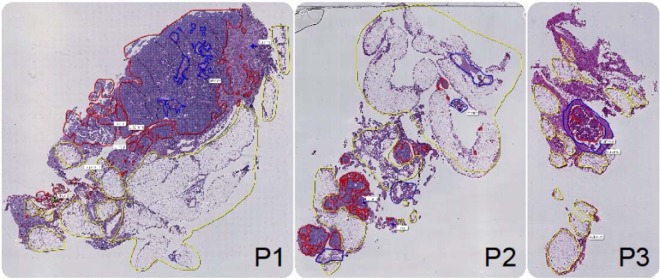
In this study, we employed the N-linked glycan mass spectrometry imaging technique that we have previously established (34). Briefly, the method combines released N-glycan MALDI-MSI of FFPE tissue with parallel detailed N-glycan structural characterization by negative ion PGC-LC-ESI-MS/MS (36). The N-glycan analysis was applied to FFPE sections of the ovarian tissue from three FIGO stage III ovarian cancer patients labeled P1, P2 and P3. Fig. 1 shows hematoxylin and eosin (H&E) stains for tissue sections from patients P1, P2, and P3.
Fig. 1.
Hematoxylin and eosin (H&E) stains of tissue sections from each patient (P1, P2 and P3) that were used for MALDI mass spectrometry imaging (MSI) analysis. Tissue-types were annotated by a pathologist post-MALDI-MSI based on the histology with tumor (red), stroma (blue), adipose (yellow), and necrotic (green) regions identified.
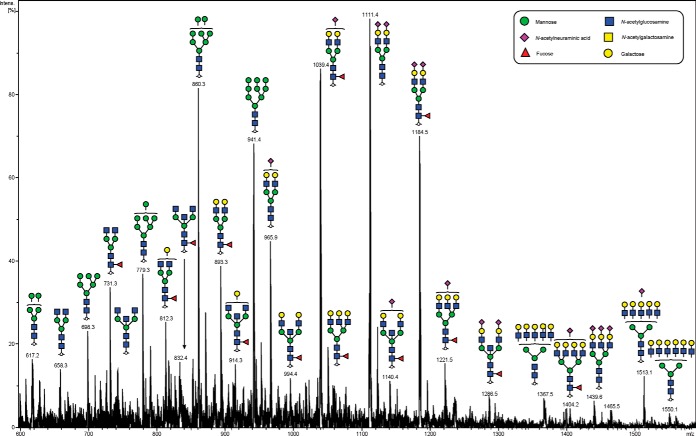
We initially characterized the N-glycans of whole tissue sections in detail using negative ion mode PGC-LC-ESI-MS/MS to construct a repository which could be used for assigning a glycan structure to the corresponding glycan masses from spatially localized MALDI-MSI data. N-glycan structures were manually assigned via the following steps: (1) The monosaccharide composition was deduced based on the mass of the released N-glycan masses (using GlycoMod http://web.expasy.org/glycomod/) (36) whereas structures, where shown, were deduced by interpretation of the MS2 fragments and biological pathway constraints, (2) mass-matching of theoretical fragment mass ions produced by tandem MS for each structure, (3) use of diagnostic fragment ions in negative ion mode that have been previously reported for the identification of specific glycan structural features (19, 37, 38), and (4) known expression of glycans based on biological pathway constraints. A representative summed negative mode MS profile of patient P1 with assigned glycan structures is shown in Fig. 2.
Fig. 2.
Negative ion mode summed MS spectrum of patient P1 ovarian tissue annotated with proposed structures for N-glycans identified by PGC-LC-ESI MS/MS. N-glycans released in-solution from formalin-fixed paraffin-embedded ovarian cancer tissue (P1) using PNGaseF were reduced, de-salted and purified on a carbon column prior to porous graphitic column chromatography coupled online to an ESI-IT-MS system. The proposed glycan structures were deduced from their doubly charged negative ion monoisotopic masses [M-2H]2−.
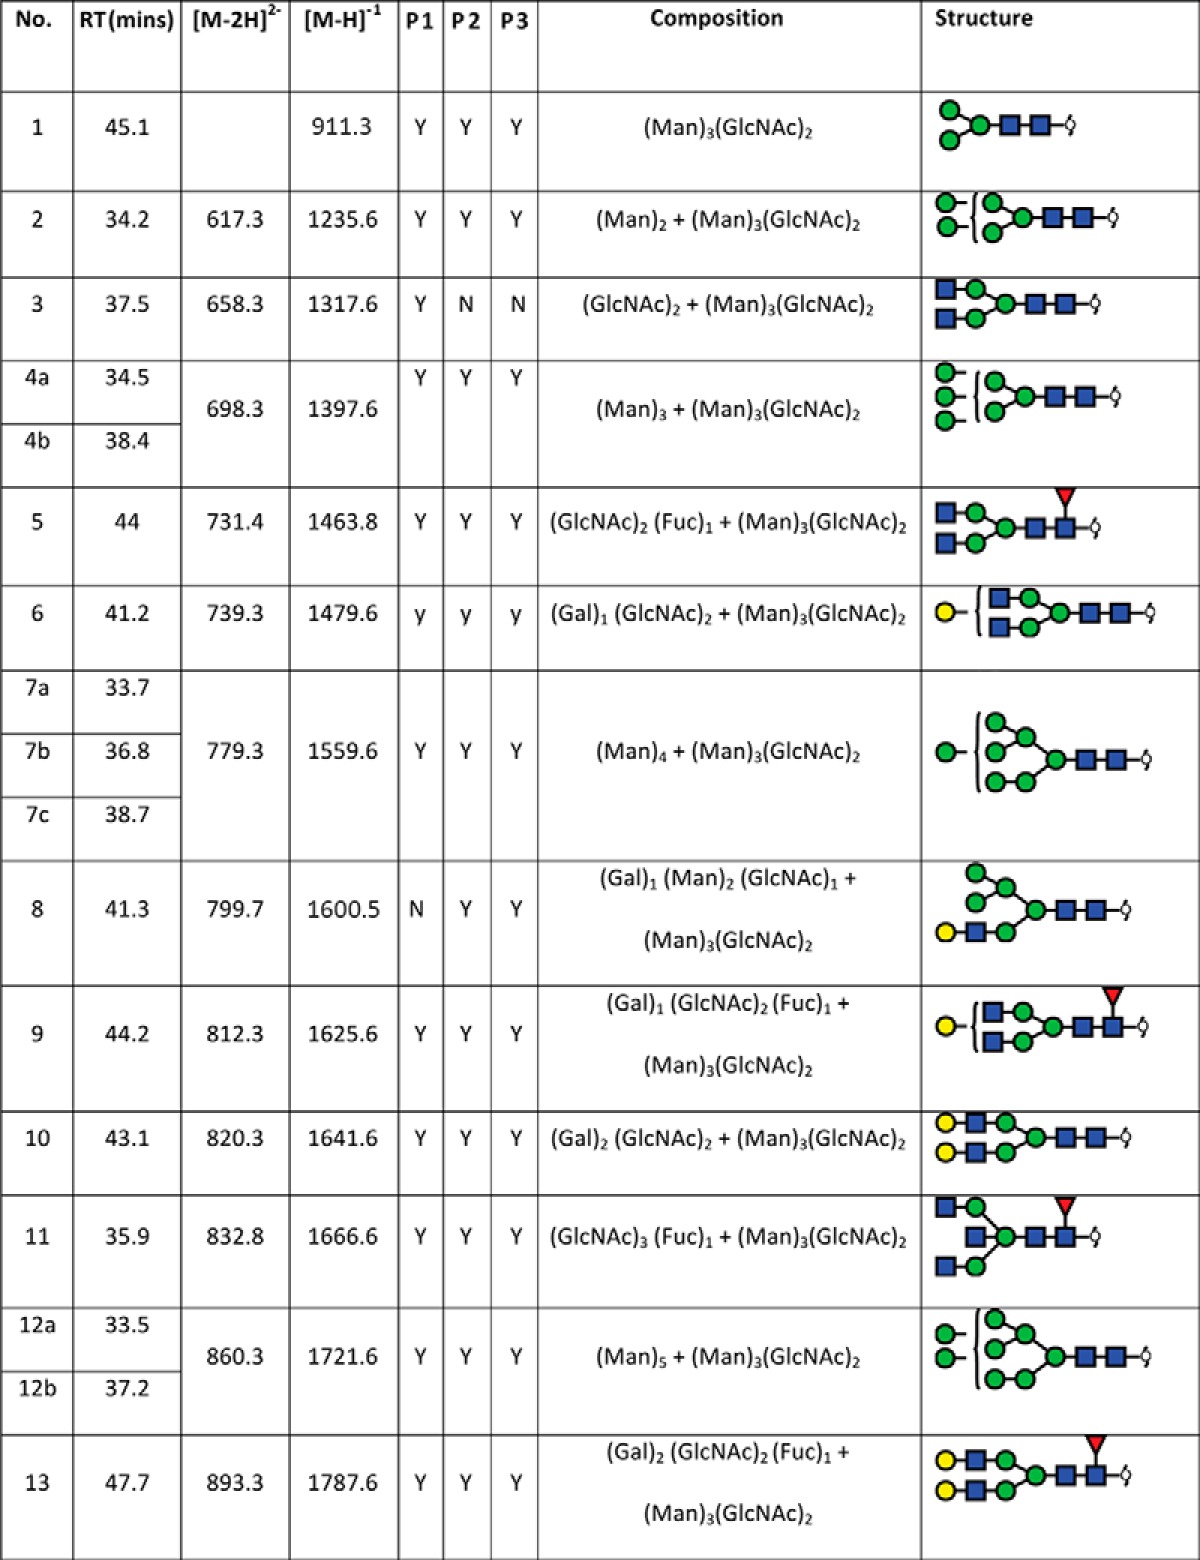
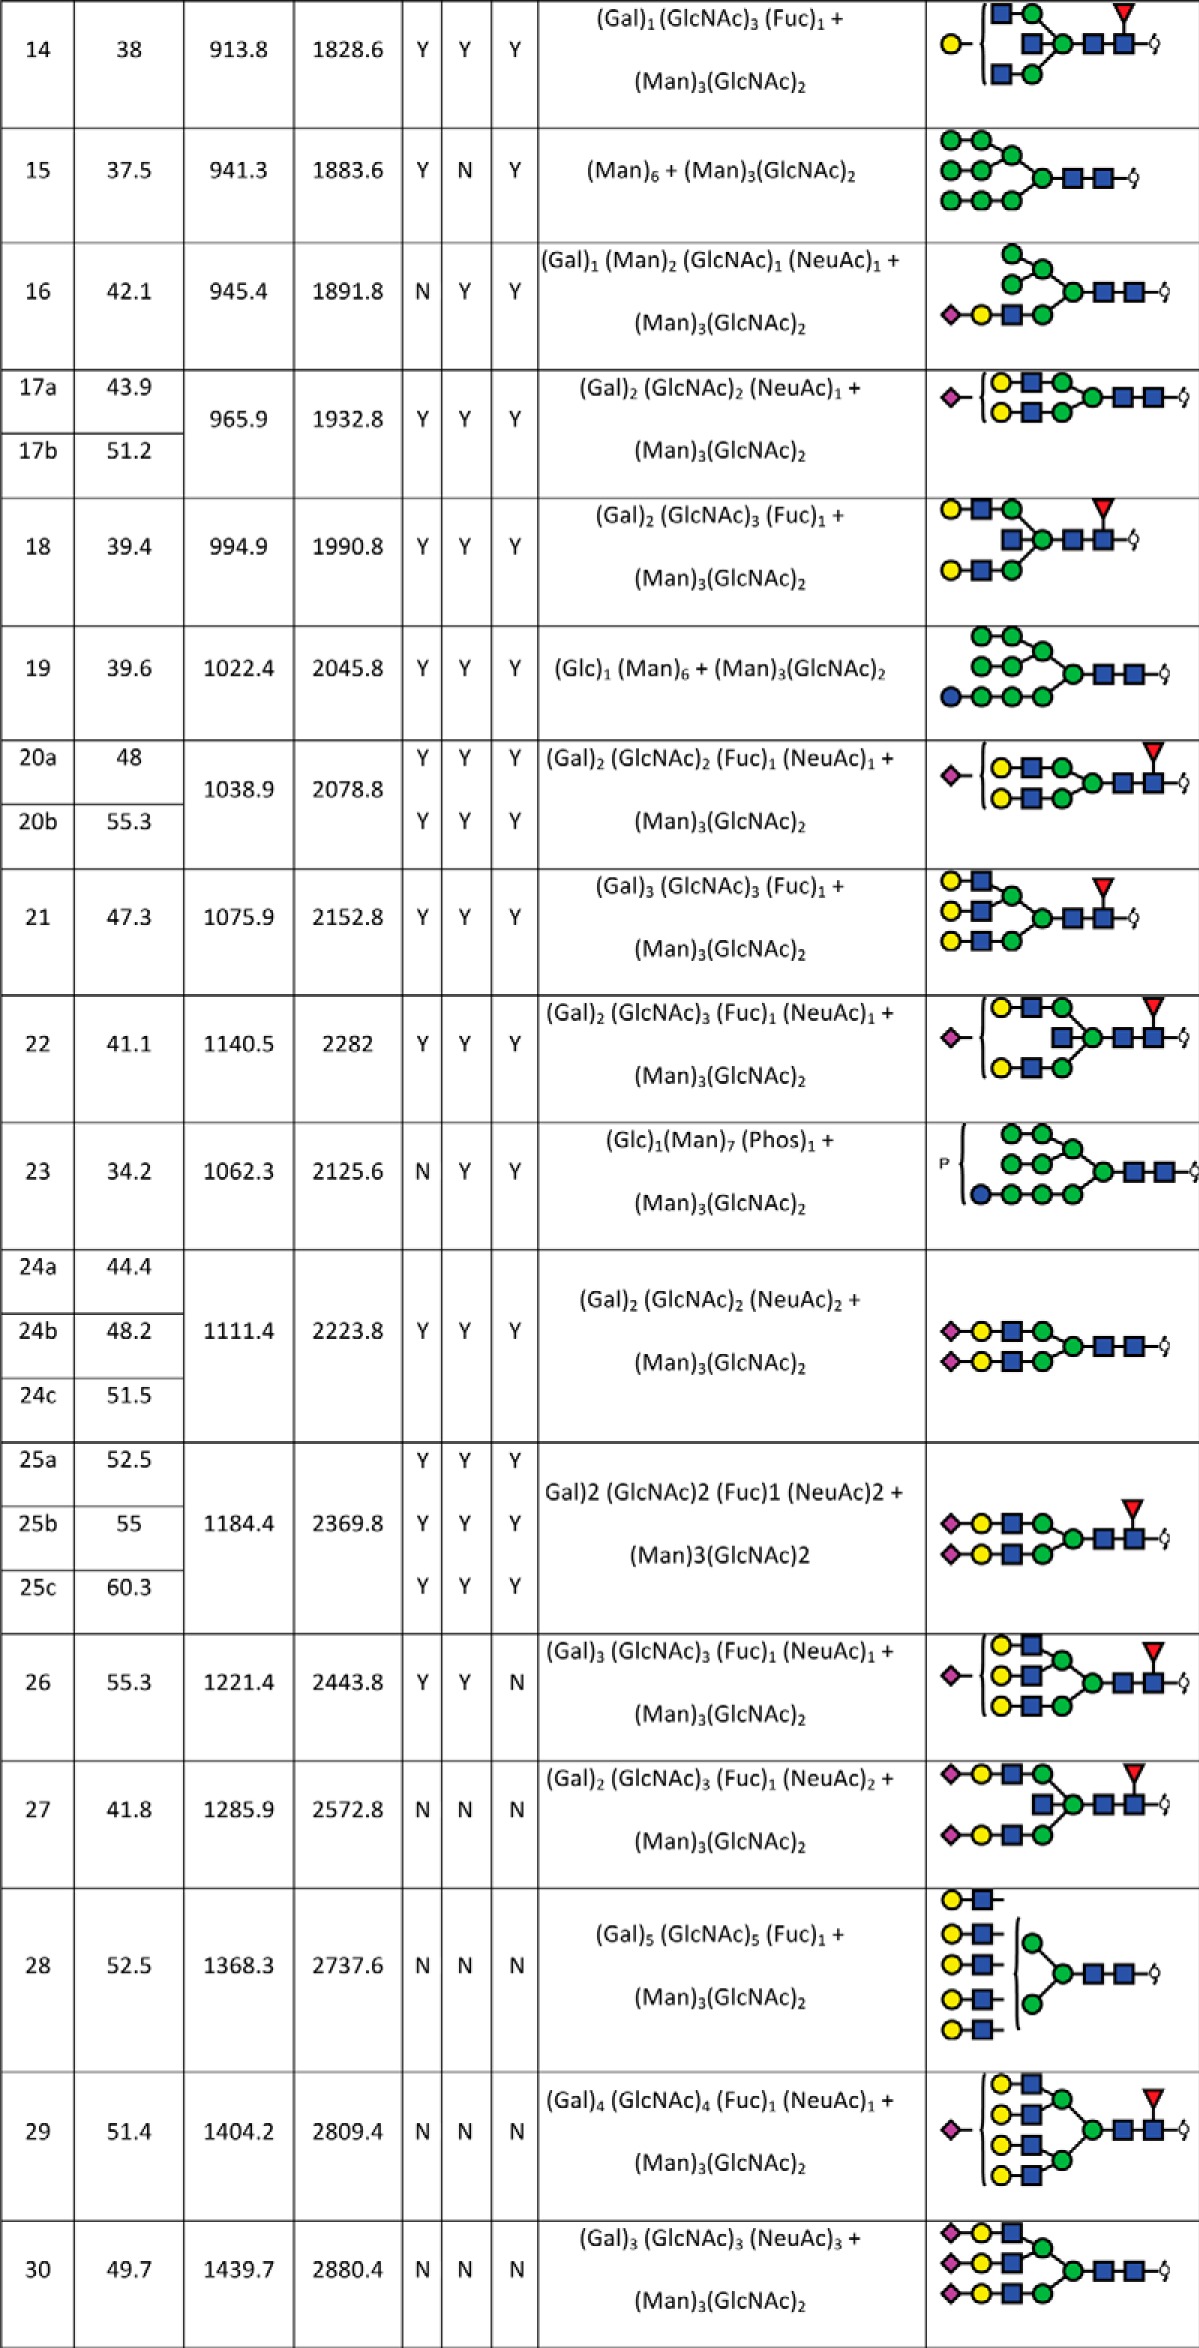
In total, 40 individual N-glycan masses (including structural and compositional isomers) were detected across the whole FFPE sections from in-solution enzyme release of the N-glycans from a whole FFPE ovarian tissue section (see Table I). These N-glycan classes included high mannose, core fucosylated, hybrid and complex (neutral and sialylated). Sialylated N-glycans were further classified based on the number of sialic acid residues, in which mono-, di- and tri-sialylated N-glycans were all observed to be present, Specifically the three most abundant glycan structures were comprised of sialylated N-glycans characterized by LC-ESI-MS/MS analysis, Structural isomers corresponding to differences in sialic acid linkages were also observed for some of the N-glycan masses. (1111.42− and 1184.42−). Isomers with α 2–3 or α 2–6 sialic acids were differentiated based on the chromatographic behavior and retention times of previous studies (31, 38, 39). Detailed structural characterization of the N-glycans was carried out by tandem MS fragmentation analysis. Examples of the collision-induced dissociation (CID) fragmentation of N-glycans in negative mode analysis characterized in this study is described using two examples in supplemental Fig. S2 for glycan masses of (1) m/z 693.32− and (2) m/z 832.82−.
TABLE 1. N-glycan structures assigned by PGC-LC-ESI-ion trap MS/MS. N-glycan structures found in formalin-fixed paraffin-embedded ovarian cancer tissue (P1 and P2) by PGC-LC-ESI-MS/MS (singly negatively charged monoisotopic masses ([M-H]1- were calculated from their observed doubly negatively charged monoisotopic masses ([M-2H]2-), matching composition and proposed structure. Y = Yes, n = No; observed in the patient samples.
For MALDI imaging analysis, duplicate FFPE ovarian tumor sections of each patient (P1, P2 and P3) were then prepared for N-glycan MALDI-MSI by antigen retrieval and PNGase F printing onto the tissue sections followed by overnight incubation at 37 °C and spray deposition of DHB.
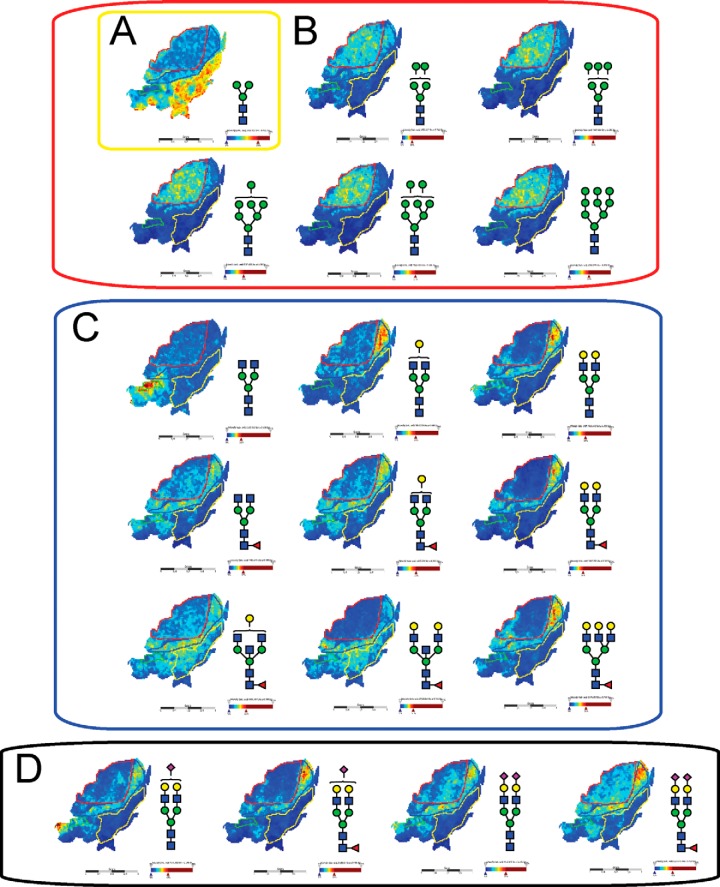
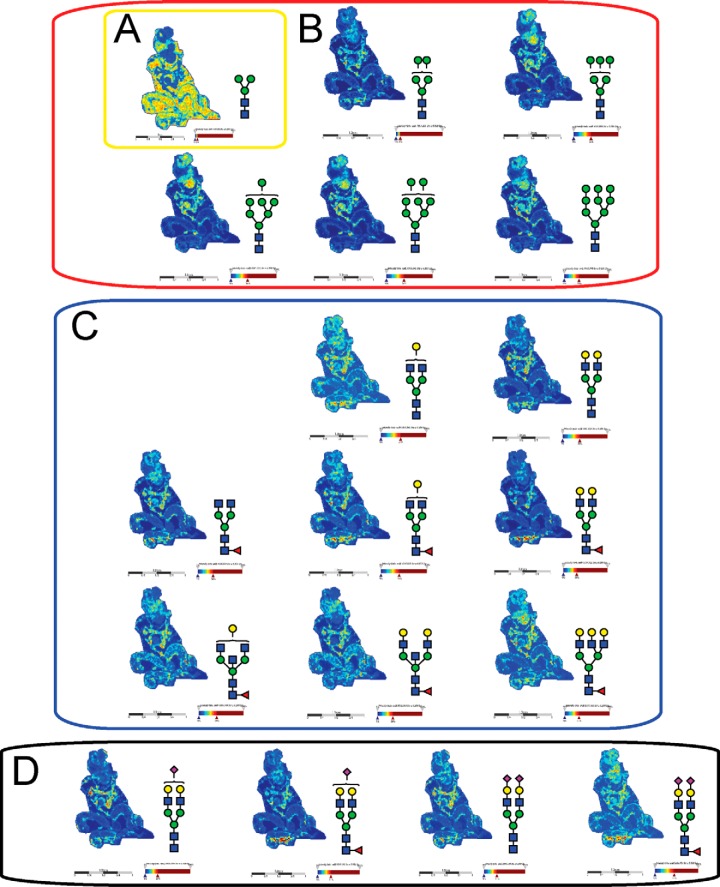
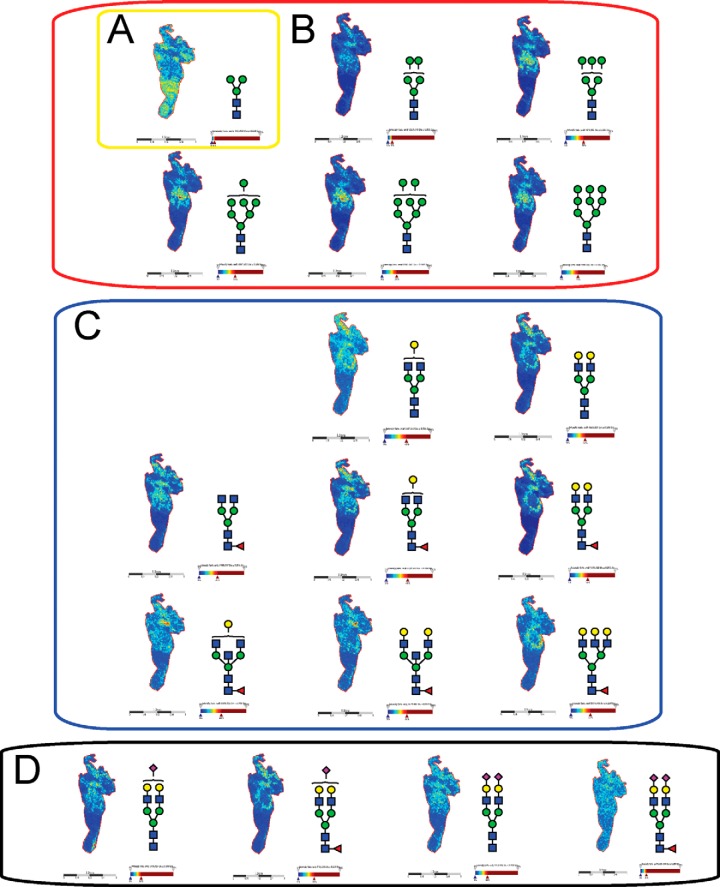
Intensity ion maps for the three FFPE samples (P1, P2, P3) of the glycan masses detected (Table I) in the LC-ESI-MS analysis were constructed. Representative ion intensity maps of the positive ion monoisotopic masses of the tissue sections are shown in Figs. 3, 4, and 5. The spatial distribution and localization of these structures were observed to be class dependent. For example, the adipose tissue region corresponded to the location of the pauci-mannose glycan (Man)3(GlcNAc)2 of mass m/z 933.3 in all patient samples (Fig. 3A, 4A, 5A). Similarly, all high mannose glycans were significantly abundant in the tumor region across the three samples (Fig. 3B, 4B, and 5B) corresponding to glycan masses of m/z 1257.4, 1419.4, 1581.5, 1743.4, and 1905.6. Although complex bi-antennary and tri-antennary antennary structures were abundantly observed in the stromal region (masses m/z 1501.5, 1663.5, 1485.4, 1809.6, 1647.6, 1850.6, 2012.7, and 2174.7 (Fig. 3C, 4C, and 5C), mono and di-sialylated structures (m/z 1954.6, 2245.7, 2100.7, and 2391.8) were observed as sodiated adducts as shown in Fig. 3D, 4D, and 5D, predominantly in the stromal region, although traces of these species were also observed in the tumor regions.
Fig. 3.
MALDI mass spectrometric imaging of N-linked glycans released from patient P1 ovarian cancer tissue sections. Formalin-fixed paraffin-embedded ovarian cancer tissue sections were treated with antigen retrieval prior to printing of 15 nL/spot dialyzed PNGase F or buffer control arrays with 250 μm spacing. DHB (20 mg/ml) was sprayed onto the sections and MS spectra were acquired by oversampling at 100 μm intervals using a MALDI-TOF/TOF MS instrument. Monoisotopic glycan masses were measured in the positive ion reflectron mode as (M+Na) adducts. Panel A shows the log ion intensity map for the m/z 933.3 of a pauci mannose structure was observed to be localized and relatively highly expressed in the adipose tissue region of the FFPE tissue. The agalactosylated bisecting structure of m/z 1339.4 was observed only in the necrotic tissue of the sample P1. Five high mannose structures (m/z 1257.4, 1419.4, 1581.5, 1743.4, and 1905.6) were observed predominantly in the tumor region as shown in panel B. The hybrid/complex N-glycan structures were indicative of the stroma region as shown in panel C (m/z 1501.5, 1663.5, 1485.4, 1809.6, 1647.6, 1850.6, 2012.7, and 2174.7) and the sialylated structures are represented in panel D shows log ion intensities of the sialylated glycans of m/z 1954.6, 2245.7, 2100.7, and 2391.8.
Fig. 4.
MALDI mass spectrometry imaging of N-linked glycans released from patient P2 ovarian cancer tissue sections. Formalin-fixed paraffin-embedded ovarian cancer tissue sections were treated with antigen retrieval prior to printing of 15 nL/spot dialyzed PNGase F or buffer control arrays with 250 μm spacing. DHB (20 mg/ml) was sprayed onto the sections and MS spectra were acquired by oversampling at 100 μm intervals using a MALDI-TOF/TOF MS instrument. Monoisotopic glycan masses were measured in the positive ion reflectron mode as (M+Na) adducts. Panel A, shows the log ion intensity map for the m/z 933.3 of a pauci mannose structure was observed to be localized and relatively highly expressed in the adipose tissue region of the FFPE tissue. Five high mannose structures (m/z 1257.4, 1419.4, 1581.5, 1743.4, and 1905.6) were observed predominantly in the tumor region as shown in panel B. The hybrid/complex N-glycan structures were indicative of the stroma region as shown in panel C (m/z 1501.5, 1663.5, 1485.4, 1809.6, 1647.6, 1850.6, 2012.7, and 2174.7) and the sialylated structures are represented in panel D shows log ion intensities of the sialylated glycans of m/z 1954.6, 2245.7, 2100.7, and 2391.8.
Fig. 5.
MALDI mass spectrometry imaging of N-linked glycans released from patient P3 ovarian cancer tissue sections. Formalin-fixed paraffin-embedded ovarian cancer tissue sections were treated with antigen retrieval prior to printing of 15 nL/spot dialyzed PNGase F or buffer control arrays with 250 μm spacing. DHB (20 mg/ml) was sprayed onto the sections and MS spectra were acquired by oversampling at 100 μm intervals using a MALDI-TOF/TOF MS instrument. Monoisotopic glycan masses were measured in the positive ion reflectron mode as (M+Na) adducts. Panel A shows the log ion intensity map for the m/z 933.3 of a pauci mannose structure was observed to be localized and relatively highly expressed in the adipose tissue region of the FFPE tissue. Five high mannose structures (m/z 1257.4, 1419.4, 1581.5, 1743.4, and 1905.6) were observed predominantly in the tumor region as shown in panel B. The hybrid/complex N-glycan structures were indicative of the stroma region as shown in panel C (m/z 1501.5, 1663.5, 1485.4, 1809.6, 1647.6, 1850.6, 2012.7, and 2174.7) and the sialylated structures are represented in panel D shows log ion intensities of the sialylated glycans of m/z 1954.6, 2245.7, 2100.7, and 2391.8.
The In situ PNGase-F released N-glycans were easily able to discriminate these four tissue-types by single unique glycan masses; for example, four distinct N-glycan masses that are representative of different glycan classes discriminated the four different tissues within the FFPE section as shown in Fig. 6. The log ion intensity map for the m/z 1339.4 corresponding to the agalactosylated bi-antennary glycan (GlcNAc)2 + (Man)3(GlcNAc)2 was observed to be localized and relatively highly abundant only in the necrotic region of the FFPE tissue section (Fig. 6C). On the other hand, the mass m/z 2175.5 corresponding to a complex fucosylated tri-antennary structure ((Gal)3 (GlcNAc)3 (Fuc)1 + (Man)3(GlcNAc)2) was observed predominantly in the stroma region. The adipose tissue region was demarcated solely by the mass of the of the pauci-mannose glycan (Man)3(GlcNAc)2 of mass m/z 933.3 (Fig. 6A). Importantly, the high mannose mass of m/z 1743.5 ((Man)5 + (Man)3(GlcNAc)2) was indicative of the tumor region (Fig. 6B).
Fig. 6.
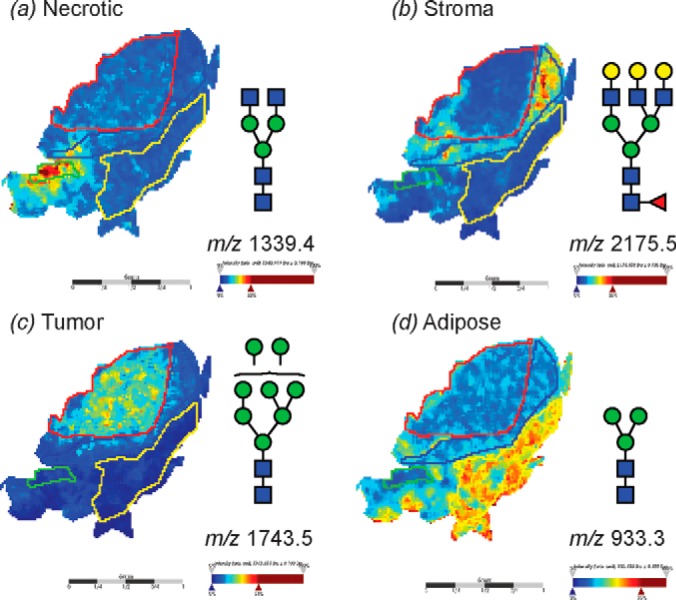
MALDI imaging MS of N-linked glycans released from ovarian cancer sections. Formalin-fixed ovarian cancer sections were treated with antigen retrieval prior to printing of 30 nL/spot dialyzed PNGase F or buffer control arrays with 250 μm spacing. DHB (20 mg/ml) was sprayed onto the sections and MS spectra were acquired by oversampling at 100 μm intervals using a MALDI-TOF/TOF MS instrument. Monoisotopic glycan masses were measured in the positive ion reflectron mode as (M+Na) adducts. Panel A shows the log ion intensity map for the m/z 1339.4 that corresponds to a (GlcNAc)2 + (Man)3(GlcNAc)2 that was observed to be localized and relatively highly expressed in the necrotic tissue region of the FFPE tissue. Similarly, B m/z 2175.5 (Gal)3 (GlcNAc)3 (Fuc)1 + (Man)3(GlcNAc)2 corresponding to a complex tri-antennary structure was observed predominantly in the stroma region. The high mannose mass of C m/z 1743.5 (Man)5 + (Man)3(GlcNAc)2 was indicative of the tumor region. The adipose tissue region corresponded to the pauci-mannose glycan D (Man)3(GlcNAc)2 of mass m/z 933.3.
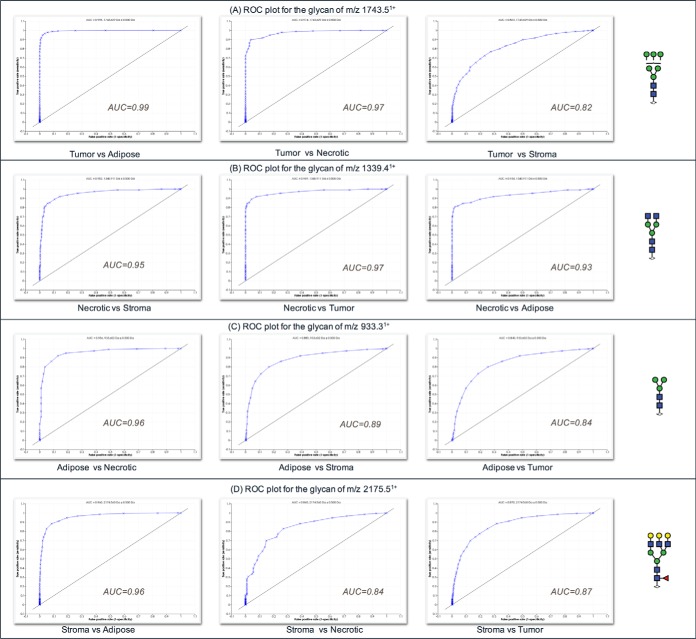
Statistical analysis by receiver operating curve (ROC) analysis and determination of the area under the ROC curve (AUC), was carried out to determine the specificity and sensitivity of using these N-glycans as potential discriminators of different tissue types. The AUC value from the ROC test is indicative of the diagnostic value of a specific indicator; specifically by a plot of sensitivity (i.e. the true-positive rate) versus specificity (i.e. the false-positive rate). The four glycan masses used to discriminate the different tissue regions observed in Fig. 6 (masses m/z 1339.4, 2175.5, 1743.5, and 933.3) showed high AUC values between 0.84 to 0.99 (Fig. 7), confirming their potential power as discriminators between tumor, stromal, adipose, and necrotic tissue regions.
Fig. 7.
Receiver operating characteristics (ROC) plots of glycan m/z from Fig. 6 used to discriminate tissue regions from sample P1. A, ROC plot for the glycan m/z 1743.5 B, ROC plot for the glycan m/z 1339.4 C, ROC plot for the glycan m/z 933.3 D, ROC plot for the glycan m/z 2175.5.
A data-driven approach was also implemented to discover whether glycan structural data alone can be used to define tissue morphology. To achieve this, the MALDI imaging data spectra were loaded into SCiLS Lab 2D software (version 2014a, SCiLS GmbH), which provides computational methods to analyze MALDI imaging datasets. A key feature of this software is spatial segmentation which allows whole spectra with similar features (i.e. peaks) to be clustered and thereby define regions in the tissue containing similar features. The segmentation map for the entire data set of patient P1 as shown in Fig. 8 discriminates between tumors (dark blue), stromal (light blue) and adipose (orange) of the sections at the segmentation levels selected (see insert). The segmentation map illustrates the potential that glycans possess in distinctly segmenting a histologically complex tissue section, and also highlights the heterogeneity of cancer tissue samples.
Fig. 8.
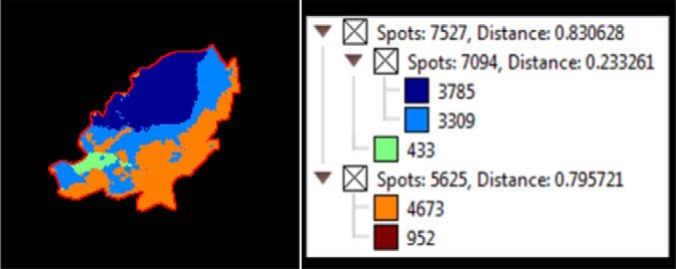
MALDI imaging MS of N-linked glycans released from formalin-fixed ovarian cancer sections. Formalin-fixed ovarian cancer sections were treated with antigen retrieval prior to printing of (30 nL/position) dialyzed PNGase F or buffer control arrays with 250 μm spacing. DHB (20 mg/ml) was sprayed onto the sections and MS spectra were acquired by oversampling at 100 μm intervals using a MALDI-TOF/TOF MS instrument. Data was loaded raw into SCiLS, pre-processed for baseline subtraction and normalization to total ion current (TIC) prior to segmentation analysis (maximum processing mode, interval width of 0.5 Da, strong smoothing). The segmentation map for the entire data set of patient P1 discriminates between tumor (dark blue), stroma (light blue), adipose (orange) necrotic (green) and tissue border (brown) of the sections at the segmentation levels selected (see insert). The dendrogram (Fig. insert) shows the number of spectra clustered together for each region.
This striking tissue segmentation map demonstrates the potential to use individual N-glycan masses to identify specific tissue regions, however the summed mass spectra from the different tissue regions could also be used as a mass-spectral pattern to identify and discriminate unique tissue regions as shown in supplemental Fig. S3. Using a series of masses with distinctive relative intensities as observed in the summed mass spectra in supplemental Fig. S3, could increase the sensitivity and facilitate high throughput analysis through complex pattern matching algorithms.
DISCUSSION
MALDI-MSI of N-glycans is a relatively new technique that has immense potential in several clinical applications including identification and validation of biomarkers in cancer tissues. Glycosylation changes are a hallmark of disease states and identification of the aberrant glycan changes directly relates to molecular changes in the glycosylation machinery. Cancer cells frequently display glycans at different levels or with fundamentally different structures than those observed from normal cells (10). There are several advantages offered by the analysis of these post-translationally added glycans, because aberrant glycosylation affects several glycoproteins simultaneously and is therefore an amplified effect that may be easily distinguished compared with other biomolecules. This is clearly demonstrated in this study, where the observation of significant abundances of the entire class of high-mannose N-glycans is apparent specifically in the tumor tissue of all three patients. This high abundance localization of the early products of the N-glycan biosynthetic pathway specifically in the tumor may reflect the incomplete time for processing of the structures in the rapidly dividing cancer cell environment.
MALDI-MS is known to result in a loss of sialylation of glycan species. This limitation for the measurement of sialylated N-glycans by MALDI-MSI is confirmed by this study where the sialylated species were observed in negative ion mode by ESI and CID fragmentation whereas MALDI-MSI in the positive ion mode had few sialylated species detected. The masses of the low abundance sialylated species that were detected in the MALDI-MSI analysis corresponded to multiply sodiated adducts. The prominence of sialyated glycans in these samples and their isomeric differentiation observed by PGC-LC-ESI-MS illustrates the need in the future development of this technique for the use of derivatization techniques for MALDI-MSI analysis of these labile glycans (40) or by optimization of MALDI-MSI analysis in the negative ion mode that protects the sialylation. Very recently Holst et al., have demonstrated a promising linkage-specific in situ sialic Acid derivatization for N-Glycan mass spectrometry imaging of formalin-fixed paraffin-embedded tissues (41).
Through the combination of detailed structural characterization by negative mode PGC-LC-ESI-MS/MS analysis and positive mode high resolution MALDI-MSI, we were able to differentiate tumor from non-tumor tissue regions in three ovarian cancer FFPE tissue sections by using only 4 masses corresponding to four specific N-glycan structures that are representative of different N-glycan classes. Distinct N-glycans were identified that were consistently able to differentiate between the tissues across biological samples. Surprisingly, specific single glycan masses were able to discriminate between necrotic, tumor, adipose and stromal tissue regions. The N-glycan based tissue differentiation observed in this study offers a unique advantage in analysis of ovarian cancer. The results from this study indicate that the location, diversification or classification of the various ovarian cancers and their subtypes could be made possible by high resolution MALDI-MSI aided by structural characterization of the implicated glycan structures by PGC-LC-ESI-MS/MS analysis.
The increase in high mannose structures have been previously reported in breast cancer progression in mouse models, colorectal cancer cell lines and hepatocellular carcinoma, among others (42–44). The increased expression of high-mannose glycans could suggest a premature termination of the glycosylation pathway during glycan synthesis. Although we observed some sialylation in the tumor region, it was considerably lower than that of the underlying stroma. It would be of interest to compare the sialylation of ovarian tumor region with its health counterpart.
The need to constantly improve and advance MALDI-MSI is also evident from this study. The PGC-LC-ESI-MS analysis revealed several N-glycans, specifically the sialylated and highly branched structures, which were not detected using the MALDI-MSI technique. There is also a need to further optimize and improve the sensitivity of detection for N-glycan MALDI-MSI and extend the detection into the O-glycan space. Although several challenges and limitations are evident, the combination of structural detail from PGC-LC-ESI-MS/MS and spatial localization from MALDI-MSI is a unique tool, is able to be performed with current technologies and offers far more information for distinguishing and classifying tissue compared with the more conventional histopathology staining methods.
Supplementary Material
Footnotes
Author contributions: NHP, PH, MTB and AVE-D conceived the project. NHP and PH, designed the experiments and supervised the research. MKO provided the ovarian tissue samples and GK annotated the H&E stained FFPE sections. MTB and AVE-D were primarily responsible for data collection and analysis. MTB and AVE-D prepared figures and wrote the main manuscript text. All authors contributed to the data analysis, discussions and manuscript preparation.
* PH received financial support from the Australian Research Council (ARC LP110100693), Bioplatforms Australia, and the Government of South Australia. NHP and AVE-D received financial support of the ARC CoE in NanoScale BioPhotonics (ARC CE140100003).
 This article contains supplemental material.
1 The abbreviations used are:
- MALDI
- matrix-assisted laser desorption/ionization
- MSI
- mass spectrometry imaging
- FFPE
- formalin-fixed paraffin-embedded
- CID
- collision-induced dissociation
- ESI
- electrospray ionization
- LC
- liquid chromatography
- MS/MS
- tandem mass spectrometry
- GnT-V
- N-acetylglucosaminyltransferase V
- NeuAc
- N-acetylneuraminic acid
- NeuGc
- N-glycolylneuraminic acid
- Man
- mannose
- PGC
- porous graphitized carbon
- PNGase F
- peptide-N-Glycosidase F
- Lea
- Lewis a antigen
- Gal
- galactose
- Fuc
- fucose
- GlcNAc
- N-acetylglucosamine
- ITO
- Indium tin oxide
- TFA
- Trifluoroacetic acid
- DHB
- 2,5-Dihydroxybenzoic acid
- EtOH
- Ethanol
- H&E
- haematoxylin and eosin.
REFERENCES
- 1. Torre L. A., Bray F., Siegel R. L., Ferlay J., Lortet-Tieulent J., and Jemal A. (2015) Global cancer statistics, 2012. Cancer J. Clin. 65, 87–108 [DOI] [PubMed] [Google Scholar]
- 2. Suh K. S., Park S. W., Castro A., Patel H., Blake P., Liang M., and Goy A. (2010) Ovarian cancer biomarkers for molecular biosensors and translational medicine. Expert Rev. Mol. Diagn. 10, 1069–1083 [DOI] [PubMed] [Google Scholar]
- 3. Erickson B. K., Conner M. G., and Landen C. N. Jr.(2013) The role of the fallopian tube in the origin of ovarian cancer. Am. J. Obstet. Gynecol. 209, 409–414 [DOI] [PMC free article] [PubMed] [Google Scholar]
- 4. Bhoola S., and Hoskins W. J. (2006) Diagnosis and management of epithelial ovarian cancer. Obstet. Gynecol. 107, 1399–1410 [DOI] [PubMed] [Google Scholar]
- 5. Nik N. N., Vang R., Shih Ie M., and Kurman R. J. (2014) Origin and pathogenesis of pelvic (ovarian, tubal, and primary peritoneal) serous carcinoma. Annu. Rev. Pathol. 9, 27–45 [DOI] [PubMed] [Google Scholar]
- 6. Scully R. E., Young R. H., and Clement P. B. (1998) Tumors of the ovary, maldeveloped gonads, fallopian tube, and broad ligament. Atlas of tumor pathology, Armed Forces Institute of Pathology, Washington, DC: 30, 1523–1524 [Google Scholar]
- 7. Kurman R. J., and Shih Ie M. (2010) The origin and pathogenesis of epithelial ovarian cancer: a proposed unifying theory. Am. J. Surg. Pathol. 34, 433–443 [DOI] [PMC free article] [PubMed] [Google Scholar]
- 8. Varki A. (1993) Biological roles of oligosaccharides: all of the theories are correct. Glycobiology 3, 97–130 [DOI] [PMC free article] [PubMed] [Google Scholar]
- 9. Ohtsubo K., and Marth J. D. (2006) Glycosylation in cellular mechanisms of health and disease. Cell 126, 855–867 [DOI] [PubMed] [Google Scholar]
- 10. Dube D. H., and Bertozzi C. R. (2005) Glycans in cancer and inflammation–potential for therapeutics and diagnostics. Nat. Rev. Drug Discov. 4, 477–488 [DOI] [PubMed] [Google Scholar]
- 11. Reis C. A., Osorio H., Silva L., Gomes C., and David L. (2010) Alterations in glycosylation as biomarkers for cancer detection. J. Clin. Pathol. 63, 322–329 [DOI] [PubMed] [Google Scholar]
- 12. Hakomori S. (2002) Glycosylation defining cancer malignancy: new wine in an old bottle. Proc. Natl. Acad. Sci. U.S.A. 99, 10231–10233 [DOI] [PMC free article] [PubMed] [Google Scholar]
- 13. West M. B., Segu Z. M., Feasley C. L., Kang P., Klouckova I., Li C., Novotny M. V., West C. M., Mechref Y., and Hanigan M. H. (2010) Analysis of site-specific glycosylation of renal and hepatic gamma-glutamyl transpeptidase from normal human tissue. J. Biol. Chem. 285, 29511–29524 [DOI] [PMC free article] [PubMed] [Google Scholar]
- 14. Abbott K. L., Lim J. M., Wells L., Benigno B. B., McDonald J. F., and Pierce M. (2010) Identification of candidate biomarkers with cancer-specific glycosylation in the tissue and serum of endometrioid ovarian cancer patients by glycoproteomic analysis. Proteomics 10, 470–481 [DOI] [PMC free article] [PubMed] [Google Scholar]
- 15. Gao L., Shen L., Yu M., Ni J., Dong X., Zhou Y., and Wu S. (2014) Colon cancer cells treated with 5fluorouracil exhibit changes in polylactosaminetype Nglycans. Mol. Med Rep. 9, 1697–1702 [DOI] [PubMed] [Google Scholar]
- 16. Drake P. M., Cho W., Li B., Prakobphol A., Johansen E., Anderson N. L., Regnier F. E., Gibson B. W., and Fisher S. J. (2010) Sweetening the pot: adding glycosylation to the biomarker discovery equation. Clin. Chem. 56, 223–236 [DOI] [PMC free article] [PubMed] [Google Scholar]
- 17. Alley W. R. Jr, Vasseur J. A., Goetz J. A., Svoboda M., Mann B. F., Matei D. E., Menning N., Hussein A., Mechref Y., and Novotny M. V. (2012) N-linked glycan structures and their expressions change in the blood sera of ovarian cancer patients. J. Proteome Res. 11, 2282–2300 [DOI] [PMC free article] [PubMed] [Google Scholar]
- 18. Chu C. S., Ninonuevo M. R., Clowers B. H., Perkins P. D., An H. J., Yin H., Killeen K., Miyamoto S., Grimm R., and Lebrilla C. B. (2009) Profile of native N-linked glycan structures from human serum using high performance liquid chromatography on a microfluidic chip and time-of-flight mass spectrometry. Proteomics 9, 1939–1951 [DOI] [PMC free article] [PubMed] [Google Scholar]
- 19. Harvey D. J. (2009) Analysis of carbohydrates and glycoconjugates by matrix-assisted laser desorption/ionization mass spectrometry: An update for 2003–2004. Mass Spectrom. Rev. 28, 273–361 [DOI] [PMC free article] [PubMed] [Google Scholar]
- 20. Mereiter S., Balmana M., Gomes J., Magalhaes A., and Reis C. A. (2016) Glycomic Approaches for the Discovery of Targets in Gastrointestinal Cancer. Front. Oncol. 6, 55. [DOI] [PMC free article] [PubMed] [Google Scholar]
- 21. He Y., Xie Q., Wang Y., Liang Y., Xu X., Li Y., Miao J., Chen Z., and Li Y. (2016) Liquid chromatography mass spectrometry-based O-glycomics to evaluate glycosylation alterations in gastric cancer. Proteomics Clin. Appl. 10, 206–215 [DOI] [PubMed] [Google Scholar]
- 22. Hu Y., Mayampurath A., Khan S., Cohen J. K., Mechref Y., and Volchenboum S. L. (2015) N-linked glycan profiling in neuroblastoma cell lines. J. Proteome Res. 14, 2074–2081 [DOI] [PMC free article] [PubMed] [Google Scholar]
- 23. Scholler N., Crawford M., Sato A., Drescher C. W., O'Briant K. C., Kiviat N., Anderson G. L., and Urban N. (2006) Bead-based ELISA for validation of ovarian cancer early detection markers. Clin. Cancer Res. 12, 2117–2124 [DOI] [PMC free article] [PubMed] [Google Scholar]
- 24. Wu J., Zhu J., Yin H., Buckanovich R. J., and Lubman D. M. (2014) Analysis of glycan variation on glycoproteins from serum by the reverse lectin-based ELISA assay. J. Proteome Res. 13, 2197–2204 [DOI] [PMC free article] [PubMed] [Google Scholar]
- 25. Shirotani K., Futakawa S., Nara K., Hoshi K., Saito T., Tohyama Y., Kitazume S., Yuasa T., Miyajima M., Arai H., Kuno A., Narimatsu H., and Hashimoto Y. (2011) High throughput ELISAs to measure a unique glycan on transferrin in cerebrospinal fluid: A possible extension toward Alzheimer's disease biomarker development. Int. J. Alzheimer's Dis. 2011, 5. [DOI] [PMC free article] [PubMed] [Google Scholar]
- 26. Yue T., Goldstein I. J., Hollingsworth M. A., Kaul K., Brand R. E., and Haab B. B. (2009) The prevalence and nature of glycan alterations on specific proteins in pancreatic cancer patients revealed using antibody-lectin sandwich arrays. Mol. Cell. Proteomics 8, 1697–1707 [DOI] [PMC free article] [PubMed] [Google Scholar]
- 27. Kim J-H, Park C. W., Um D., Baek K. H., Jo Y., An H., Kim Y., and Kim T. J. (2014) Mass spectrometric screening of ovarian cancer with serum glycans. Disease Markers 2014, 9. [DOI] [PMC free article] [PubMed] [Google Scholar]
- 28. Saldova R., Royle L., Radcliffe C. M., Abd Hamid U. M., Evans R., Arnold J. N., Banks R. E., Hutson R., Harvey D. J., Antrobus R., Petrescu S. M., Dwek R. A., and Rudd P. M. (2007) Ovarian cancer is associated with changes in glycosylation in both acute-phase proteins and IgG. Glycobiology 17, 1344–1356 [DOI] [PubMed] [Google Scholar]
- 29. Biskup K., Braicu E. I., Sehouli J., Fotopoulou C., Tauber R., Berger M., and Blanchard V. (2013) Serum glycome profiling: a biomarker for diagnosis of ovarian cancer. J. Proteome Res. 12, 4056–4063 [DOI] [PubMed] [Google Scholar]
- 30. Saldova R., Piccard H., Perez-Garay M., Harvey D. J., Struwe W. B., Galligan M. C., Berghmans N., Madden S. F., Peracaula R., Opdenakker G., and Rudd P. M. (2013) Increase in sialylation and branching in the mouse serum N-glycome correlates with inflammation and ovarian tumour progression. PLoS ONE 8, e71159. [DOI] [PMC free article] [PubMed] [Google Scholar]
- 31. Anugraham M., Jacob F., Nixdorf S., Everest-Dass A. V., Heinzelmann-Schwarz V., and Packer N. H. (2014) Specific glycosylation of membrane proteins in epithelial ovarian cancer cell lines: glycan structures reflect gene expression and DNA methylation status. Mol. Cell. Proteomics 13, 2213–2232 [DOI] [PMC free article] [PubMed] [Google Scholar]
- 32. Briggs M. T., Kuliwaba J. S., Muratovic D., Everest-Dass A. V., Packer N. H., Findlay D. M., and Hoffmann P. (2016) MALDI mass spectrometry imaging of N-glycans on tibial cartilage and subchondral bone proteins in knee osteoarthritis. Proteomics 10.1002/pmic.201500461 [DOI] [PubMed] [Google Scholar]
- 33. Powers T. W., Holst S., Wuhrer M., Mehta A. S., and Drake R. R. (2015) Two-dimensional N-glycan distribution mapping of hepatocellular carcinoma tissues by MALDI-imaging mass spectrometry. Biomolecules 5, 2554–2572 [DOI] [PMC free article] [PubMed] [Google Scholar]
- 34. Gustafsson O. J., Briggs M. T., Condina M. R., Winderbaum L. J., Pelzing M., McColl S. R., Everest-Dass A. V., Packer N. H., and Hoffmann P. (2015) MALDI imaging mass spectrometry of N-linked glycans on formalin-fixed paraffin-embedded murine kidney. Anal. Bioanal. Chem. 407, 2127–2139 [DOI] [PMC free article] [PubMed] [Google Scholar]
- 35. Toghi Eshghi S., Yang S., Wang X., Shah P., Li X., and Zhang H. (2014) Imaging of N-linked glycans from formalin-fixed paraffin-embedded tissue sections using MALDI mass spectrometry. ACS Chem. Biol. 9, 2149–2156 [DOI] [PMC free article] [PubMed] [Google Scholar]
- 36. Cooper C. A., Gasteiger E., and Packer N. H. (2001) GlycoMod–a software tool for determining glycosylation compositions from mass spectrometric data. Proteomics 1, 340–349 [DOI] [PubMed] [Google Scholar]
- 37. Everest-Dass A. V., Kolarich D., Campbell M. P., and Packer N. H. (2013) Tandem mass spectra of glycan substructures enable the multistage mass spectrometric identification of determinants on oligosaccharides. Rapid Commun. Mass Spectrom. 27, 931–939 [DOI] [PubMed] [Google Scholar]
- 38. Everest-Dass A. V., Abrahams J. L., Kolarich D., Packer N. H., and Campbell M. P. (2013) Structural feature ions for distinguishing N- and O-linked glycan isomers by LC-ESI-IT MS/MS. J. Am. Soc. Mass Spectrom. 24, 895–906 [DOI] [PubMed] [Google Scholar]
- 39. Nakano M., Saldanha R., Gobel A., Kavallaris M., and Packer N. H. (2011) Identification of glycan structure alterations on cell membrane proteins in desoxyepothilone B resistant leukemia cells. Mol. Cell. Proteomics 10, M111 009001 [DOI] [PMC free article] [PubMed] [Google Scholar]
- 40. Reiding K. R., Blank D., Kuijper D. M., Deelder A. M., and Wuhrer M. (2014) High-throughput profiling of protein N-glycosylation by MALDI-TOF-MS employing linkage-specific sialic acid esterification. Anal. Chem. 86, 5784–5793 [DOI] [PubMed] [Google Scholar]
- 41. Holst S., Heijs B., de Haan N., van Zeijl R. J., Briaire-de Bruijn I. H., van Pelt G. W., Mehta A. S., Angel P. M., Mesker W. E., Tollenaar R. A., Drake R. R., Bovee J. V., McDonnell L. A., and Wuhrer M. (2016) Linkage-Specific in Situ Sialic Acid Derivatization for N-Glycan Mass Spectrometry Imaging of Formalin-Fixed Paraffin-Embedded Tissues. Anal Chem 88(11), 5904–13 [DOI] [PubMed] [Google Scholar]
- 42. de Leoz M. L., Young L. J., An H. J., Kronewitter S. R., Kim J., Miyamoto S., Borowsky A. D., Chew H. K., and Lebrilla C. B. (2011) High-mannose glycans are elevated during breast cancer progression. Mol. Cell. Proteomics 10, M110 002717 [DOI] [PMC free article] [PubMed] [Google Scholar]
- 43. Sethi M. K., Thaysen-Andersen M., Smith J. T., Baker M. S., Packer N. H., Hancock W. S., and Fanayan S. (2014) Comparative N-glycan profiling of colorectal cancer cell lines reveals unique bisecting GlcNAc and alpha-2,3-linked sialic acid determinants are associated with membrane proteins of the more metastatic/aggressive cell lines. J. Proteome Res. 13, 277–288 [DOI] [PubMed] [Google Scholar]
- 44. Amin A., Bashir A., Zaki N., McCarthy D., Ahmed S., and Lotfy M. (2015) Insights into glycan biosynthesis in chemically-induced hepatocellular carcinoma in rats: A glycomic analysis. World J. Gastroenterol. 21, 6167–6179 [DOI] [PMC free article] [PubMed] [Google Scholar]
Associated Data
This section collects any data citations, data availability statements, or supplementary materials included in this article.


