

Abstract
Treatment of cancer cells with anticancer drugs often fails to achieve complete remission. Yet, such drug treatments may induce alteration in the tumor's gene expression patterns, including those of Cancer/Testis Antigens (CTA). The degradation products of such antigens can be presented as HLA peptides on the surface of the tumor cells and be developed into anticancer immunotherapeutics. For example, the DNA methyl transferase inhibitor, 5-aza-2′-deoxycytidine (Decitabine) has limited antitumor efficacy, yet it induces the expression of many genes, including CTAs that are normally silenced in the healthy adult tissues. In this study, the presentation of many new HLA peptides derived from CTAs and induced by Decitabine was demonstrated in three human Glioblastoma cell lines. Such presentation of CTA-derived HLA peptides can be exploited for development of new treatment modalities, combining drug treatment with anti-CTA targeted immunotherapy. The Decitabine-induced HLA peptidomes include many CTAs that are not normally detected in healthy tissues or in cancer cells, unless treated with the drug. In addition, the study included large-scale analyses of the simultaneous effects of Decitabine on the transcriptomes, proteomes and HLA peptidomes of the human Glioblastoma cells. It demonstrates the poor correlations between these three levels of gene expression, both in their total levels and in their response to the drug. The proteomics and HLA peptidomics data are available via ProteomeXchange with identifier PXD003790 and the transcriptomics data are available via GEO with identifier GSE80137.
Grade IV astrocytoma, also called glioblastoma multiforme (GBM) 1, is the most common and aggressive primary brain tumor, with a prognosis of about three months if untreated. Despite advances in treatment, and even after applying a combination of maximal surgical resection, followed by radiation and Temozolamide (TMZ) chemotherapy, the survival rate for GBM has not changed much over the past 50 years, remaining largely an incurable disease with a median survival of about 15 months (1). Hence, there is a pressing need to develop better therapeutic modalities, such as immunotherapies, which are emerging as promising treatment options for otherwise incurable cancers, such as GBM (2, 3). Different cancer immunotherapy regimens are now approved by the FDA and the European Medicines Agency for various cancers (4), including HLA peptide vaccines (5, 6). Presentation of HLA peptides derived from tumor antigens (TA) can lead to activation of anticancer T cells and to cytotoxic killing of the diseased cells. Therefore, the cancer cells' HLA peptidomes were studied extensively as sources for tumor antigens potentially useful as cancer vaccines (5, 7–10). The HLA peptidomes (also called the immunopeptidome or the HLA ligandome) are the assortments of peptides bound and presented at the cells' surface by the HLA molecules. Tumor antigens potentially useful for cancer immunotherapy are tumor-specific antigens (TSA), including neo-antigens derived from mutations unique to the tumor cells (10–14). Tumor-associated antigens (TAA) are another useful group of antigens that are expressed in larger amounts on tumor cells relative to normal cells (15, 16) and therefore pose some risk of eliciting autoimmune reactions (17). A special group of tumor antigens attracting significant attention as potential targets for cancer immunotherapy are the cancer/testis antigens (CTA), which are preferentially expressed in immune privileged sites, such as male germ cells, placenta, and ovary, but are often absent from the normal somatic cells (18, 19). The biological role of the CTAs in the germline cells is not always known, yet their expression in the tumor cells was exploited to elicit immune responses in treated cancer patients, bringing about complete regressions in a few cases (19–21). Furthermore, combining TA vaccines with inhibitors of immune modulators may become even a more powerful modality for cancer treatment (5, 13, 22, 23).
The expression level of many of the CTAs is regulated by constant DNA methylation of their promoters in normal and transformed cells (24–26). Although most of the CTA promoters are methylated in the healthy adult tissues, such regulation is often lost in the tumor cells. These epigenetic abnormalities, prevalent in cancer cells, induce differential expression of oncogenes and CTAs as side effects of the loss of cellular control (27–30). Moreover, although the expression of CTAs in human cancer cells is heterogeneous, their expression can be up-regulated by treatment with inhibitors of methylation, such as 5-aza-2′-deoxycytidine (Decitabine). Decitabine is a cytosine analog, which inhibits DNA methyltransferases by trapping these enzymes after its incorporation into the DNA, thus reducing methylation of newly synthesized DNA strands (31–33). Decitabine was shown also to reduce the methylation and to elevate the expression of the MHC class I genes along with different tumor antigens (34–36). Treatment of human glioma cells with Decitabine uniformly up-regulated the expression of NY-ESO-1 and other well characterized CTAs in the cancer cells (37) but not in nonmalignant cells (38–40). Decitabine is not the only anticancer drug affecting the epigenome. Currently, 87 clinical trials of epigenetic cancer therapy are registered at Clinical Trials (http://www.clinicaltrials.gov) (30).
Identification of HLA peptides as tumor antigens and candidates for immunotherapy is complicated by the difficulty of detection of their presentation on tumor cells. HLA peptidome analysis is limited by the yield of immunoaffinity purified HLA molecules and by the technical limitations of the chromatography and mass spectrometry analysis of the recovered peptides (7–9, 41). To this end, analysis of the tumor cells' exomes and transcriptomes may provide useful data from which the presentation of HLA peptides can be inferred (9, 13, 14, 16, 42–45). The cancer cells' proteomes is less useful for elucidation the presentation of HLA peptides, because the levels of the presented peptides correlates poorly with the levels of their source proteins (42–48).
This research aimed to promote the development of a reliable method for selection of potential candidates for cancer immunotherapy, especially CTAs induced by drugs, such as Decitabine. It followed the effect of the drug on the transcriptomes, proteomes, and the HLA peptidomes of cultured human GBM cells, resulting in the discovery of large sets of drug-induced CTAs. The obtained data are potentially useful for advancing the development of new approaches for immunotherapy, based on the induction by drugs of tumor antigens that are not normally expressed by the cancer cells and can be used for combined drug and immunotherapy cancer treatment.
EXPERIMENTAL PROCEDURES
Cell Lines and Antibodies
Three human Glioblastoma cell lines, U-87, T98G, and LNT-229 (obtained from the ATCC, Manassas, VA) were maintained in DMEM supplemented with 10% FBS, 1% l-glutamine, 1% Na-pyruvate, 0.1 mg/ml streptomycin, and 100 μ/ml penicillin and 0.1% HEPES. The cells were kept in 5% CO2 humidified incubator at 37 °C. The monoclonal antibodies W6/32 (anti-HLA class I) were affinity purified from growth medium of the HB95 hybridoma (obtained from the ATCC).
Drug Treatment Regimen
Cells were counted and plated in new 150 mm Petri dishes 1 day prior to the treatment. The following day, the media was removed and replaced with fresh medium with or without 1 μm of 5′-Aza-2′-deoxycytidine (Decitabine, AdooQ Bioscience, Irvine, CA). After incubation with Decitabine for 72 h, the cells were harvested, counted and prepared for FACS, HLA peptidomics, proteomics analysis, or for RNA sequencing.
Experimental Design and Statistical Rationale
Three Glioblastoma cell lines (U-87, T98G, and LNT-229), treated and untreated with Decitabine, were used for the HLA peptidomics analysis, proteomics analysis, and for the RNA sequencing and quantification. Three HLA peptidomics and proteomics analyses biological replicates were performed with each of the treated and untreated Glioblastoma cell lines. In addition, two out of these three replicates of each of the cells lines were also used for RNA-seq analyses.
FACS Analysis
About 2 × 10⁵ Decitabine-treated and untreated cells were used for each flow cytometric analysis. The cells were tagged with the W6/32 monoclonal antibody (anti-HLA-A, B and C) produced from the HB95 hybridoma and used at a final concentration of 0.5 μg/μl. Secondary antibodies were anti-mouse IgG conjugated to FITC (Sigma, St. Louis, MO). FACS analysis was performed using LSRII instrument (BD Biosciences, San Jose, CA) and the data were analyzed using FCS Express 5 Plus (DeNovo Software, Glendale, CA).
Affinity Purification of HLA Molecules
HLA class I molecules were purified from three biological replicates for each Glioblastoma cell line. Each replica with about 5 × 10⁸ cells was lysed with 0.25% sodium deoxycholate, 0.2 mm iodoacetamide, 1 mm EDTA, 1:200 Protease Inhibitors Mixture (Sigma), 1 mm PMSF, and 1% octyl-β-D glucopyranoside (Sigma) in PBS at 4 °C for 1 h. The cell extracts were cleared by centrifugation for 45 min at 18,000 rpm, 4 °C. The recovered HLA class I molecules were immunoaffinity purified using the W6/32 mAb bound to Amino-Link beads (Thermo Scientific, Waltham, MA) as in (49). The HLA molecules with their bound peptides were eluted from the affinity column with five column volumes of 0.1 N acetic acid. The eluted HLA class I proteins and the released peptides were loaded on disposable C18 columns (Harvard Apparatus, Holliston, MA) and the peptides fraction was recovered with 30% acetonitrile in 0.1% TFA. The peptide fractions were dried using vacuum centrifugation, reconstituted in 100 μl of 0.1% TFA, reloaded on Stage-Tips (50), eluted with 80% ACN, dried, and reconstituted with 0.1% formic acid for μLC-MS-MS analysis.
Proteomics analysis
Two approaches for proteome analysis were employed in this study. The first was in-solution tryptic digest followed by resolution of the peptides by long (3 h) one-dimensional reversed phase capillary chromatography and tandem mass spectrometry and the other was based on in-gel proteolysis of 5 gel slices from each lane, followed by two hours μLC-MS-MS of the tryptic peptides from each gel slice, as in (51). Thirty μg of total protein were used for the in-gel digest and μLC-MS-MS and 2.5 μg of proteins were used for the in-solution digest and μLC-MS-MS analysis.
Identification of the HLA and Tryptic Peptides
The HLA and tryptic peptides were resolved by capillary chromatography and electrospray tandem mass spectrometry with Q-Exactive-plus mass spectrometers (Thermo Scientific). The reversed phase capillary chromatographies were performed with home-packed a 30 cm long, 75 μm inner diameter column with 3.5 μm silica ReproSil-Pur C18-AQ resin (Dr. Maisch GmbH, Ammerbuch-Entringen, Germany). HLA and tryptic peptides were eluted with a linear gradient of 5–28% of buffer B (100% ACN and 0.1% Formic acid). The gradients were run at flow rates of 0.15 μl/min for 2 h for the HLA peptides and the in-gel digested fractions and for 3 h for the in-solution digests. Data was acquired using a data-dependent “top 10” method, fragmenting the peptides by higher-energy collisional dissociation (HCD). We acquired full scan MS spectra at a resolution of 70,000 at 200 m/z with a target value of 3 × 10⁶ ions. Ions were accumulated to an AGC target value of 105 with a maximum injection time of generally 100 msec. For the HLA peptides with unassigned precursor ion charge states, or charge states of four and above, no fragmentation was performed. For tryptic peptides, the fragmentation was performed on charge states between 2 to 7. The peptide match option was set to Preferred. Normalized collision energy was set to 25% and MS/MS resolution was 17,500 at 200 m/z. Fragmented m/z values were dynamically excluded from further selection for 20 s.
Data Analysis
The MS data was analyzed by the MaxQuant computational proteomics platform (52) version 1.5.0.25 and searched with the Andromeda search engine (53). Peptide identifications were based on the human section of the Uniprot database (http://www.uniprot.org/) of July 2015 containing 69,693 entries. Mass tolerance of 4.5 ppm for the precursor masses and 20 ppm for the fragments were allowed. Methionine oxidation was accepted as variable modification for both tryptic and HLA peptides. Carbamidomethyl cysteine was accepted as a fixed modification for the proteomics data and as a variable modification for the HLA peptidome data. Methionine sulfoxide and n-acetylation were set as variable modifications for both the proteomics and HLA peptidomics analyses. Minimal peptide length was set to seven amino acids and a maximum of two miscleavages was allowed for tryptic peptides. The false discovery rate (FDR) was set for tryptic peptides to 0.01 for protein identifications, and 0.05 for the MHC peptides. The resulting identified protein tables were filtered to eliminate the identifications derived from the reverse database, as well as common contaminants. The mass spectrometry proteomics data have been deposited to the ProteomeXchange Consortium (54) (http://proteomecentral.proteomexchange.org) via the PRIDE partner repository with the data set identifier PXD003790.
Normalization of the Transcriptome, Proteome, and HLA Peptidome Data
The transcriptome data of each of the cell lines was normalized using a normalization factor (size factor) for each sample, using the DESeq2 package (http://bioconductor.org/packages/release/bioc/vignettes./DESeq2/inst/doc/DESeq2.pdf). The proteome data was normalized by the iBAQ and the LFQ tools of the MaxQuant software (indicated in the relevant legends). The medians of the fold changes of each HLA peptidome experimental repetition, before and after the Decitabine treatment, were zeroed and differentially expressed peptides were defined as those changing by at least twofold.
mRNA-Seq Library Preparation and Sequencing
Total RNA was prepared from between 1 to 2 × 10⁶ GBM cells, using the Total RNA Purification Plus kit (Norgen Biotek, Thorold, ON, Canada) as per the kit instructions. The isolated total RNA was quantified using Qubit 2.0 machine (Invitrogen, Carlsbad, CA) before the sequencing library preparation. The mRNA population in each sample was enriched by removing ribosomal RNA (rRNA) using the Epicenter ScriptSeq Complete kit (human, Illumina, Madison, WI) as per the kit instructions. Gene expression analysis of 12 samples, including two biological replicates per each of the three GBM cell lines before and after Decitabine treatment, was performed by Illumina HiSeq 2500 in 50 base pair single read mode in the Technion Genome Center. The RNA-seq reads were mapped to the GRCh38 genome using TopHat version 2.0.13 (55). Only uniquely mapped reads were counted in the analysis, using the HTSeq-count package version 0.6.1 with “union” mode (56). The counts normalization and the differential expression analysis were performed using the DESeq2 package version 1.8.1. The RNA sequencing data have been deposited to the GEO Consortium (http://www.ncbi.nlm.nih.gov/geo/) with the data set identifier GSE80137.
RT-qPCR of NY-ESO-1 Expression
Total cellular RNA was extracted using the Total RNA purification Plus kit (Norgen biotek) as per the kit instructions. The RNA concentration was determined using the Epoch microplate reader and software (BioTek, Winooski, VT). One microgram of total RNA was used to generate cDNA with the qScript cDNAsynthesis Kit (Quanta Biosciences, Beverly, MA). Quantitative polymerase chain reaction (RT-qPCR) of NY-ESO-1 mRNA was performed using SYBR green FastMix assay (Quanta biosciences) and the Bio-Rad (Hercules, CA) real-time PCR system and software. HPRT1 mRNA was used as the endogenous control. Primers specific for NY-ESO-1 and HPRT1 were NY-ESO-1: forward primer: 5′-CGCCTGCTTGAGTTCTACCT-3′, reverse primer: 5′-TGCAGCAGTCAGTCGGATAG-3′; HPRT1 forward primer: 5′-ACCCCACGAAGTGTTGGATA', reverse primer: 5′-AAGCAGATGGCCACAGAACT-3′. Each sample was amplified by 1 cycle at 95 °C for 3 min, 40 cycles at 95° for 10 s and 60° for 30 s. All RT-qPCR assays were carried out in triplicate. Negative controls for the RT-qPCR reactions were performed by omitting the cDNA templates in at least one reaction per tested transcript.
HLA Typing
In brief, DNA was extracted from 106 cells using the DNeasy Blood & Tissue kit (Qiagen, Hilden, Germany) as per the kit instructions. The HLA typing was conducted with this DNA at the Sheba Medical Center Tissue Typing Unit (Israel). HLA typing was performed using Luminex technology and Immucor Transplant Diagnostic kits, as per the kits' instructions to obtain HLA A*, B*, and C* loci typing at low/intermediate resolution.
Definition of the Tumor Antigen (TA) Group
Selection of TAs was based on the cancer tumor database (CT gene database) (http://www.cta.lncc.br/) (57) comprised of 277 different TAs (data accumulated between the years 2005–2009) and the Tumor T cell Antigen database (TANTIGEN) (http://cvc.dfci.harvard.edu/tadb), comprised of 259 different TAs.
RESULTS
Transcriptome, Proteome, and HLA Peptidome Analyses of the GBM Cells
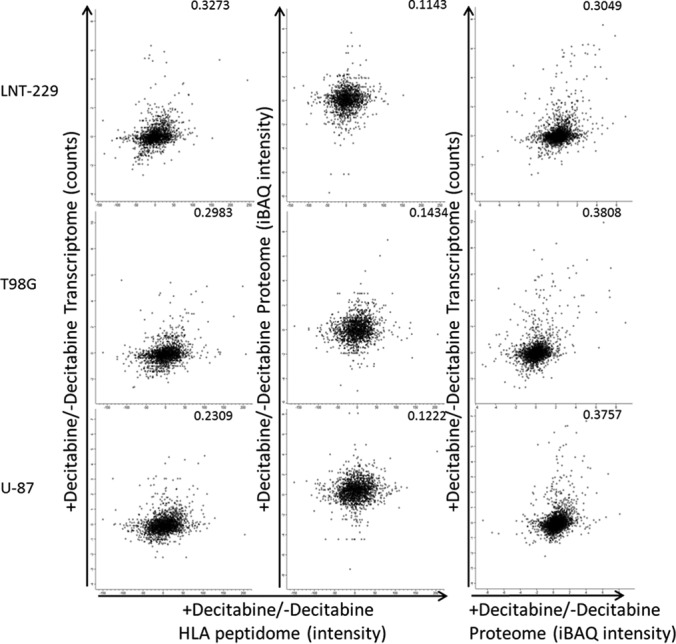
The transcriptomes, proteomes, and HLA peptidomes of the U-87, T98G, and LNT-229 GBM human cell lines were analyzed before and after treatment with Decitabine (Fig. 1). Overall, the RNA-Seq transcriptome analyses resulted in the identification of above 26,000 transcripts, the proteome analyses identified about 7500 proteins and the HLA class I peptidome analyses resulted in above 25,000 identified HLA peptides (Table I). Two biological repetitions of the transcriptome, three of the proteome and three of the HLA peptidome were performed with each of the cell lines and treatment, resulting in highly reproducible data sets. Even though, rather similar transcriptomes and proteomes were detected in the three cell lines (Fig. 2A–2B), the detected HLA peptidomes were largely different (Fig. 2C). In addition, although the transcriptomes and the proteomes of the cells were reasonably correlated with each other in each of the cell lines, the correlations of both with the HLA peptidomes of the same cells were poor (Fig. 3). Significantly, many of the gene products induced by Decitabine were derived from TAs, including many CTAs, which are prime candidates for further evaluation as immunotherapeutics (Table II).
Fig. 1.

Overview of the combined transcriptome, proteome and HLA peptidome analytical workflow using the three human Glioblastoma cell lines. The HLA alleles of each of the tested cell lines are listed in the box at the top. Interestingly, these cell lines have lost their heterozygosity as commonly happens in GBM (76).
Table I. Statistics of the transcripts, proteins and HLA peptides identifications.
| Analysis type | Number of identifications | Number of upregulations | Number of down regulations | Number of identified TAs | Number of upregulated TAs | Number of upregulated CTAs |
|---|---|---|---|---|---|---|
| HLA Peptidome | 25544 | 1855 | 824 | 731 | 72 | 21 |
| (Source proteins) | (7817) | (1539) | (729) | (160) | (54) | (15) |
| Proteome | 7555 | 1759 | 1602 | 141 | 45 | 14 |
| Transcriptome | 26055 | 3892 | 643 | 313 | 109 | 42 |
Fig. 2.

Venn diagrams indicating the degrees of overlap between the transcriptomes, proteomes and HLA peptidomes of the three GBM cell lines (A–C). The circles represent the numbers of detected gene products in the LNT-229 (red), T98G (blue) and U-87 (green) cell lines.
Fig. 3.

Comparisons between the transcriptomes, proteomes and HLA peptidomes of the three GBM cell lines. The iBAQ intensities (69) of the proteomes were defined by the MaxQuant software (52). The normalized intensities of the transcriptomes (i.e. the number of identified reads divided by the length of the transcript) were used for the calculations. Pearson correlations are indicated in each panel.
Table II. Examples for transcripts, proteins and HLA peptides upregulated by Decitabine treatment. CTA score of “1” indicates if the genes is not expressed in any healthy (not-testis) tissues (at levels above 9 in BioGPS, above 7 in Human Protein Atlas and above 300 in IST online). CTA score of “2” indicates some minor expression in a few normal tissues and a CTA score of “3” indicates a wide-spread expression in different healthy tissues. HLA score below 50 nM represents strong binding between the HLA molecules to its peptide. Antigens that were not detected in the untreated cells and detected in the treated cells were assigned a value of “I” and antigens detected only in the untreated cells and not detected in the treated cells were assigned a value of “−I.” (−) No data was available on this antigen in the specific database.
| Tumor antigen | Cell line | HLA peptides | HLA type | HLA score According to NetMHC (nM) | Log2 (fold change) * |
CTA score according to BioGPS | CTA score according to Human Protein Atlas | CTA score according to IST online | ||
|---|---|---|---|---|---|---|---|---|---|---|
| HLA peptidome | Transcriptome | Proteome | ||||||||
| MAGEA1 | LNT−229 | EADPTGHSY | B*3501 | 37.6 | 1.19 | 0.108681 | 0.1824322 | 1 | 1 | 1 |
| KVLEYVIKV | A*0201 | 6.9 | ||||||||
| SAFPTTINF | B*3501 | 25 | 1.38 | |||||||
| SLFRAVITK | A*0301 | 13.5 | −0.68 | |||||||
| T98G | KVLEYVIKV | A*0201 | 6.9 | I | 4.35744 | I | ||||
| U-87 | KEADPTGHSY | B*4402 | 65.4 | I | 3.00002 | 1.215848 | ||||
| KVLEYVIKV | A*0201 | 6.9 | I | |||||||
| MAGEA6 | LNT-229 | DPIGHVYIF | B*3501 | 13.1 | 1.05 | 0.173401 | 0.7706051 | 1 | 1 | − |
| FVQENYLEY | B*3501 | 8.1 | 2.67 | 0.173401 | 0.7706051 | |||||
| LPTTMNYPL | B*3501 | 9.8 | 1.32 | |||||||
| T98G | KIWEELSVLEV | A*0201 | 87.4 | 1.64 | 2.84277 | |||||
| U-87 | KIWEELSVLEV | A*0201 | 87.4 | I | 1.48386 | I | ||||
| MFI2 | LNT-229 | SPLERYYDY | B*3501 | 26 | I | 0.842609 | 0.3690319 | 1 | 3 | 3 |
| VPVGEKTTY | B*3501 | 20.6 | 0.92 | |||||||
| T98G | SPLERYYDY | B*3501 | 26 | 1.71234 | ||||||
| U-87 | AEGAGDVAF | B*4402 | 74.1 | I | 2.7002 | I | ||||
| GEDIYTAGKTY | B*4402 | 4981.8 | I | |||||||
| MAGEA4 | LNT-229 | EVDPASNTY | B*3501 | 27.4 | 6.11363 | 0.5748672 | 3 | 2 | 1 | |
| T98G | GVYDGREHTV | A*0201 | 1751.8 | I | 6.58573 | I | ||||
| U-87 | GVYDGREHTV | A*0201 | 1751.8 | I | 7.3186 | I | ||||
| MAGEB2 | LNT-229 | SVFGEPWKLITK | A*0301 | 214.4 | 0.97 | 0.613071 | 0.130991 | 3 | 1 | 3 |
| T98G | GVYDGEEHSV | A*0201 | 1782.2 | I | 5.69166 | 1.763269 | ||||
| U-87 | GVYDGEEHSV | A*0201 | 1782.2 | I | 6.66147 | 1.982523 | ||||
| CYP1B1 | LNT-229 | FLDPRPLTV | A*0201 | 6.6 | I | 3.06777 | 3 | 3 | 3 | |
| VPATITDIF | B*3501 | 13.7 | I | |||||||
| T98G | EHWKVQRRAA | B*4402 | 33263.6 | I | 2.40255 | I | ||||
| FLDPRPLTV | A*0201 | 6.6 | I | |||||||
| FLDPRPLTVV | A*0201 | 19.1 | 4.24 | |||||||
| U-87 | FADRPAFASF | B*3501 | 188.3 | −0.33 | 0.350121 | 1.025126 | ||||
| FLDPRPLTV | A*0201 | 6.6 | −0.5 | |||||||
| FLDPRPLTVV | A*0201 | 19.1 | −0.03 | |||||||
| ABCC3 | LNT-229 | VLFGKALNPK | A*0301 | 11.1 | 3.05 | 3.62535 | 3 | 3 | 3 | |
| YHYIFVTGVKF | C*0702 | 11502.3 | ||||||||
| T98G | LLSFINPQL | A*020 | 33.8 | −2.72 | ||||||
| PQTDFIIVL | B*3501 | 3298.5 | −0.2201 | I | ||||||
| VLAPVILML | A*0201 | 22.4 | −0.78 | |||||||
| VLFGKALNPK | A*0301 | 11.1 | 0.32 | |||||||
| YHYIFVTGV | B*3901 | 194.4 | −0.27 | |||||||
| YHYIFVTGVKF | C*0702 | 11502.3 | 0.57 | |||||||
| U-87 | GEISDPFRF | B*4402 | 105.8 | |||||||
| LLSFINPQL | A*0201 | 33.8 | −0.91 | 2.0394 | I | |||||
| PQTDFIIVL | B*3901 | 3298.5 | ||||||||
| VLAPVILML | A*0201 | 22.4 | ||||||||
Large and Unique HLA Peptidomes were Detected in Each of the Cell Lines
The HLA class I peptidome analyses, before and after 72 h of Decitabine treatment, resulted in the identification of 25,544 HLA class I peptides derived from 7817 different source proteins (Table I and supplemental Table S1). Most of these peptides (23,439, 92%) fitted the typical HLA class I ligands' lengths of 8–14 amino acids. The majority of peptides fitted the expected sequences motifs of the HLA allotypes of the studied cells (listed in Fig. 1 and supplemental Table S1) according to NetMHC server with score below 1000 (http://www.cbs.dtu.dk/services/NetMHC/) (58). As many as 67.3% of the peptides in the LNT-229 cells, 56.7% of the peptides in the T98G cells, and 67.9% of peptides in the U-87 cells, fitted the cells' HLA sequences motifs with scores below 1000 nm. Larger similarities were observed between the HLA peptidomes of the T98G and U-87 cells (Fig. 2C and supplemental Fig. S1), which share an HLA allotype (HLA-A*02:01) relative to the LNT-229 cells with their completely different HLA haplotype (listed in Fig. 1).
Many HLA Peptides Derived from Tumor Antigens Were Up-regulated by Decitabine
The Decitabine treatment resulted in small up-regulation of the cells' surface HLA class I expression, as assessed by flow cytometry and by the LFQ values of the individual HLA allotypes proteins detected in each cell line during the proteome analyses (supplemental Fig. S2). Most of the identified HLA peptides were detected at similar levels in each of the cell lines and their levels were not significantly affected by the Decitabine treatment (Fig. 4A). However, of the 23,439 identified HLA peptides, as many as 1855 peptides were up-regulated in their presentation levels by the Decitabine treatment and only a small number of the affected peptides were down-regulated (see statistics in Table I and the full data set in supplemental Table S1) according to a “one sample test” with p value < 0.05 and log2 fold change −1 > x > 1 when the HLA peptides were identified both in treated and untreated cells. If the HLA peptides were identified only before or after the treatment, the HLA peptides were considered as changing significantly only if they were not detected at all the three repetitions before (or after) the treatment, and were positively identified in at least two repetitions of the other (treated or untreated) cells. A significant number of the up-regulated HLA peptides were detected only after the Decitabine treatment and were not observed in the untreated cells (Fig. 4A). The Decitabine treatment affected in a similar manner different HLA peptides derived from individual proteins in more than one of the cell lines (Fig. 5 and supplemental Table S1). Importantly, above 730 of the identified HLA peptides were derived from tumor antigens (Table I and supplemental Table S1) and as many as 72 of these HLA peptides were up-regulated by twofold or more following treatment with Decitabine. Moreover, out of these 72 up-regulated HLA peptides, 21 belong to the CTA group. For example, five different HLA peptides derived from the CTA antigen, MAGEA1, were up-regulated by Decitabine in at least one of the three cell lines (boxed in Fig. 5).
Fig. 4.

Scatter Plots of Log2 intensities of the HLA peptides (A), iBAQ intensities of the proteins (B), and transcripts (C), before and after treatment with Decitabine in each of the tested GBM cell lines. HLA peptides, proteins and transcripts detected only after treatment with Decitabine are circled with green on the vertical line and HLA peptides, proteins, and transcripts detected only before the Decitabine treatment are circled with orange on the horizontal line. The averaged intensities of HLA peptides and of transcripts were compared in this analysis. The protein intensities used for the comparisons displayed here, were based on the in-gel digests experiment, because this analysis provided larger numbers of identified peptides resulting in larger data sets relative to the in-gel digests.
Fig. 5.
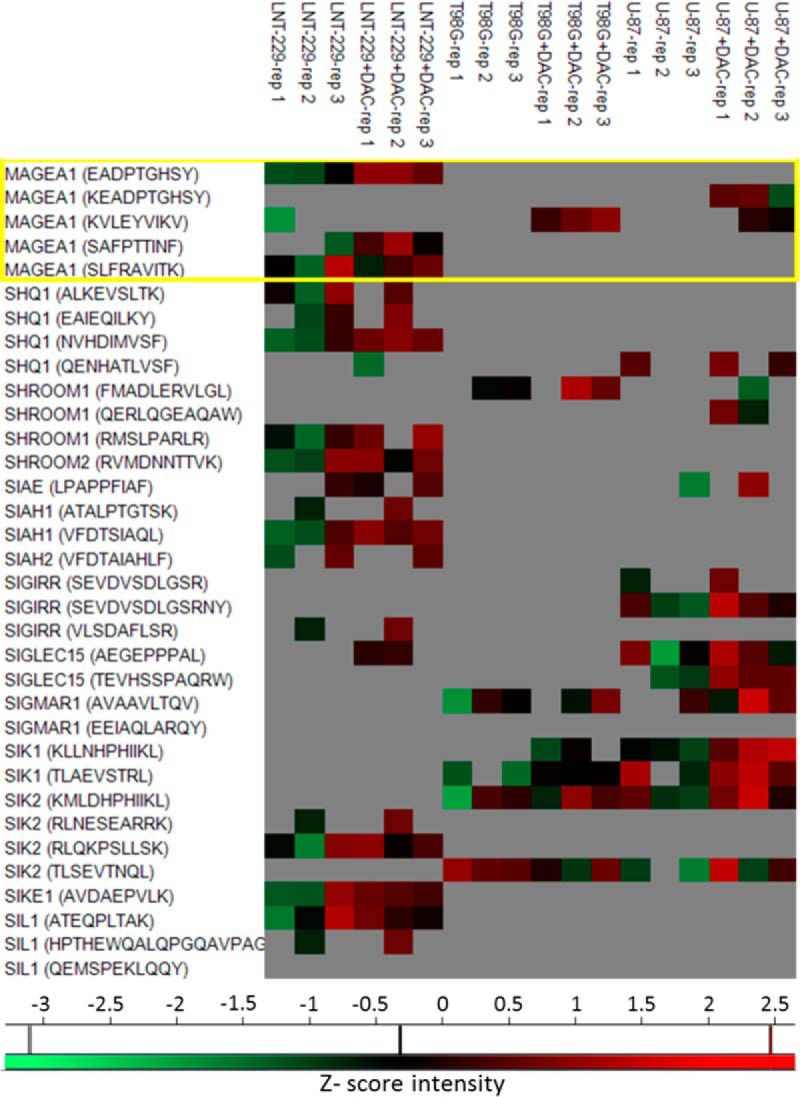
Heat map with a few examples of significantly affected HLA peptides. The HLA peptides derived from MAGEA1 are labeled with a box, showing the similar effect of the treatment on all the three cell lines. The presented intensity values are Z-scored.
The Effect of Decitabine on the Cellular Proteomes
A total of 7555 different proteins were identified by the proteome analyses, with at least two identified tryptic peptides per protein. As expected, significantly higher correlations were observed between the proteomes of the different cell lines (Fig. 1B and supplemental Fig. S3) relative to their HLA peptidomes (Fig. 1C and supplemental Fig. S1). A total of 2990 proteins were affected by the Decitabine treatment with approximately equal numbers up or down regulated (Table I, Fig. 4B and supplemental Table S2). Significantly affected proteins were defined as those changing with a log2 fold-change −1> x >1 before and after treatment in at least one of the repetitions with the other two repetitions not behaving at the opposite direction. The proteomics analyses included both “gel-slicing” and “in-solution” tryptic digest, which cannot be combined for proper t test analysis because of the different sizes of the lists of quantified proteins. Therefore, for the proteome data, this manual analysis was employed rather than the t-tests used for transcriptome and the HLA peptidome analyses. Another group of proteins included those detected only before or after Decitabine treatment. These proteins, were defined as up- or down-regulated only if they were not detected in all three biological repetitions before (or after) the treatment, and were identified in at least two repetitions of the treated (or untreated) cells. As many as 141 different TA proteins were identified in the proteomics analyses and 45 of them were up-regulated by the Decitabine treatment in at least one of the cell lines whereas seven of them were down-regulated (Fig. 6). Of these 45 up-regulated TA's, 14 belong to the CTA group (supplemental Table S2).
Fig. 6.
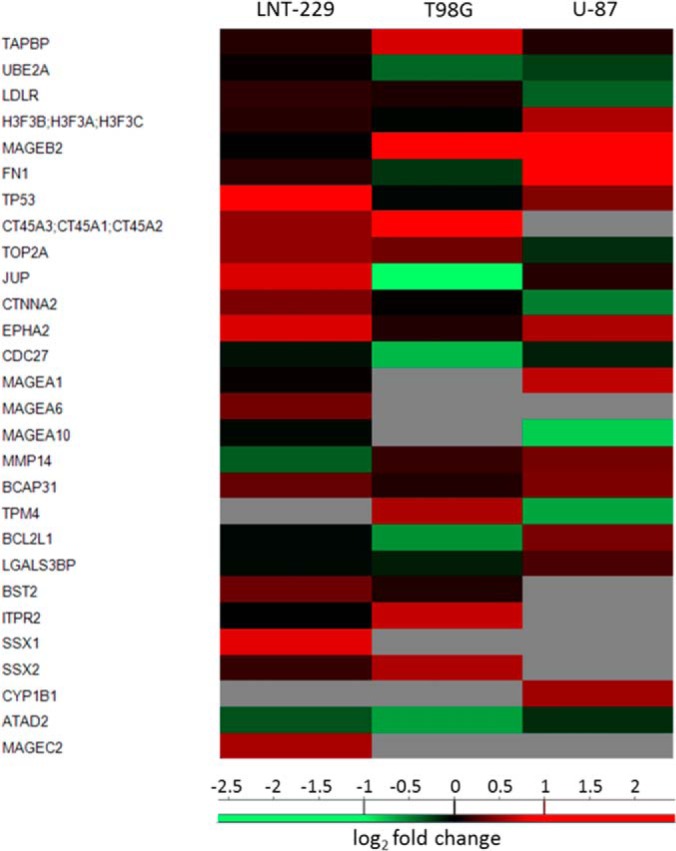
Heat-map of typical tumor antigens that were significantly changed in their intensities before and after treatment (52). The signals are represented as log2 of the fold-change LFQ intensities.
The Effect of Decitabine on the Cells' Transcriptomes
The transcriptomes of the cell lines were defined to a much larger depth than the proteomes or the HLA peptidomes of the same cells. The reproducibility of the transcriptome analyses was high (supplemental Fig. S4), resulting in detection of between 30–36 million “reads” per sample, with 77–82% of the reads uniquely mapped. Significant changes in genes' expressions were defined as those passing a t test with p value< 0.05 and log2 fold change −1> x >1 (supplemental Table S3). More transcripts were up-regulated by the Decitabine than down-regulated with 704 of these up-regulated significantly in all three cell lines (Fig. 4C and supplemental Table S3). A larger number of TA-derived transcripts (313 transcripts) were identified in the transcriptome analyses relative to the proteome and HLA peptidome analyses, with about a third of these TA transcripts up-regulated by the Decitabine treatment (109 transcripts, Table I). Out of these 109 TA transcripts, 42 belong to the CTA group.
To obtain an indication for the sensitivity and coverage of the analysis performed in this study, the NY-ESO-1 gene was selected as a model CTA, because it is known to be up-regulated by Decitabine (37). The NY-ESO-1 gene products were not observed in any of the analyses described here, therefore, an RT-qPCR analysis was performed with RNA extracted from the three GBM cell lines, before and after treatment with Decitabine. The results of the RT-qPCR indicated a uniform up-regulation of the NY-ESO-1 transcripts in the three Decitabine treated cell lines (supplemental Fig. S5).
The Differential Effects of Decitabine on the Transcriptomes, Proteomes, and HLA Peptidomes of the Different Cell Lines
The large numbers of transcripts, proteins and HLA peptides identified in these analyses from each of the three GBM cultured cells (Tables I, supplemental Tables S1, S2, and S3) prompted us to attempt to determine the correlations between these three levels of gene products. Larger numbers of transcripts were identified and quantified relative to the proteins or HLA peptides because of the different technologies used. It is difficult to perform comparisons between levels of transcripts, which are defined by multiple RNA reads, with levels of proteins that are often defined by just a few tryptic peptides (59). Furthermore, it is even more challenging to compare the levels of transcripts and proteins with those of the HLA peptides, which are detected only with a single intensity peak during the LC-MS analyses. Here we attempted to bypass this limitation by comparing instead the drug-induced fold-changes in the levels of the transcripts, proteins and HLA peptides of the same genes rather than their total signal intensities. This was based on the assumption that the ratios between the LC-MS signals of the tryptic and HLA peptides and their cellular amounts remain constant despite the drug-induced perturbation.
The Decitabine treatments caused a reproducible effect on the transcriptomes, proteomes and HLA peptidomes of the different cell lines, mostly upregulating only a subset of these gene products (Tables I, supplemental Tables S1, S2, and S3, and Fig. 7). Concurrent changes in the transcripts, proteins and different HLA peptides derived from the same 96 genes could be observed in at least one of the tested cell lines. Yet, the correlations between the changes induced by the Decitabine treatment in these three levels of gene expression were very poor (Fig. 7). In addition, in some cases, the levels of different HLA peptides derived from one protein were affected differently by the drug treatment. Such phenomenon is likely because of a possible complex effect of the drug on the HLA peptidomes' production pipeline and not only because of the changes in the levels of the source transcripts, rates of synthesis or degradation of the proteins. PLIN2 is an example for a gene whose transcript, protein and HLA peptides changed uniformly in all the three tested cell lines, whereas SPTBN2 represents an example for a more complex response to the drug (Fig. 8).
Fig. 7.
Comparison between the fold-changes of the differentially expressed normalized transcriptomes, iBAQ intensities of the proteomes and the HLA peptidomes of the three GBM cell lines following Decitabine treatment. To weight differentially the fold-changes of the HLA peptides according to their intensities, the fold-changes of the individual HLA peptides were multiplied by the Log2 of their averaged LC-MS signal intensities. Only gene products observed in pairs of analyses are presented. Pearson correlations are indicated in each panel.
Fig. 8.
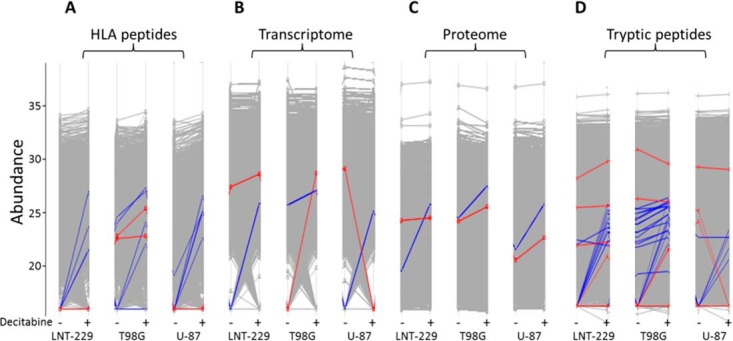
Examples for the effects of the Decitabine on the expression levels of two gene products in the form of HLA peptides (A), transcripts (B), proteins (C), and tryptic peptides (D) following treatment with Decitabine. PLIN2 (blue lines) was affected similarly at all these levels of expression whereas SPTBN2 (red lines) was affected in a more complex manner.
Selection of Tumor Vaccine Candidates
CTAs selected for further investigation as tumor antigens were those detected as up-regulated HLA peptides. The selection for further investigation was based on information about their mRNA gene expression patterns in healthy and diseased tissues using the BioGPS data bank http://biogps.org/ (60, 61). The preferred CTAs for development of immunotherapeutics are likely those derived from genes expressed only in malignant tissues, in male germline cells or in placenta, and not in any other healthy tissues. The selected CTA genes in this study were those with mRNA expression levels below nine units in all normal, essential tissues (BioGPS), which are expressed at significantly higher levels in tumor cells. It was assumed that transcript levels below nine units could be considered as background because these are the expression levels of many well-characterized CTAs in healthy (nontestis) adult tissues. Moreover, some of these CTAs are already used in multiple clinical studies without observable autoimmune reactions (6, 62–64). Candidates for combined drug and immunotherapy treatments were selected in this analysis if their transcripts, proteins or HLA peptides were up-regulated at least by twofold in the GBM cells in response to the Decitabine treatment (supplemental Table S4). A few examples for TAs, including CTAs, which were up-regulated at all the three levels of gene expression following treatment with Decitabine, are listed in Table II. Also listed are their degrees of change and their CTA scores, which indicate their potential relevance for immunotherapy. CTA score of '1′ indicates that the genes mRNA is expressed at levels below nine units in all the healthy (not-testis) tissues, respectively (according to the BioGPS database). These TAs were further analyzed for their mRNA expression levels using two additional databases, the Human protein Atlas (http://www.proteinatlas.org/) and ISTonline (http://ist.medisapiens.com/) to confirm that their mRNA expression is restricted to tumor and nonessential tissues(Table II).
DISCUSSION
As expected, the treatment of the GBM cell lines with Decitabine induced relatively mild effects on the cells without any detectable stress. Yet, it had a pronounced effect on the expression levels of a subset of genes, many of which are CTAs, whose transcripts, proteins, and most significantly, HLA class I peptides, appeared only after the drug treatment. Thus, we suggest that such analyses can be exploited for the development of immunotherapy based on induction of CTAs by drug treatments. In addition, this is the first study, to our knowledge, investigating the simultaneous effects of a drug on the three important levels of gene expression, namely the transcriptome, proteome and HLA peptidome, all in the same cultured human cancer cells. The data described here indicates that only minimal levels of correlations exist between the HLA peptidomes, the transcriptomes and the proteomes of the cells (Fig. 7). The use of modern μLC-MS-MS and RNA-seq technologies enabled reaching a significant coverage of the transcriptomes, proteomes and HLA peptidomes, which was useful for the selection of numerous drug-induced CTA candidates (supplemental Table S4) and most importantly HLA peptides that appear only after the Decitabine treatment (Fig. 4).
The most significant dilemma in the selection of antigens as candidates for cancer immunotherapy relates to the selection of sufficiently immunogenic antigens, while avoiding induction of potential life-threatening autoimmune reactions (17). Tumor antigens of choice are likely those expressed at sufficient levels in the tumors but not at all in any of the essential tissues. Assigning to each antigen its CTA score, proposed here, can help prioritize the identified CTAs for subsequent immunogenicity testing. These scores indicate if the individual antigens are absent from all essential healthy tissue and are expressed at sufficiently high level in the tumor tissues. Furthermore, such CTA scores may provide additional input on how strong the immune reactions to the administered antigens can be enhanced by use of strong adjuvants, without fear of causing damaging autoimmunity (17). To obtain the CTA score for each antigen detected as HLA peptide or transcript, its expression needs to be evaluated with every patient's tumor sample. To obtain the expression levels of the same antigens in the healthy tissues it is essential to rely on public gene expression databases of healthy tissues, such as the three databases used here (BioGPS, Human protein Atlas and ISTonline). The assumption is that in the absence of transcripts in healthy tissues, the derived HLA peptides are also not expressed. We were somewhat surprised to notice discrepancies between databases used here listing the expression levels in the normal tissues of some of the CTAs (examples in Table II). Although these databases are based on numerous studies, further analyses are clearly needed to resolve these conflictions and confirm that the selected CTAs are indeed not expressed in any of the essential tissues.
Although neo-antigens are likely the preferred type of immunotherapeutics (11, 13, 14, 22, 65) they are rare, difficult to identify and will require costly analyses and validations before their routine incorporation into the personalized immunotherapy pipeline. The more general CTAs, expressed by the tumors of large cohorts of patients, may become clinically useful earlier and at lower costs. Therefore, the selection of CTAs expressed in many patients' tumors and absent from all essential healthy tissues, will be beneficial for the development of cancer immunotherapy (17). The suggested strategy may involve pre-vaccination of the patients and induction of pre-existing strong immune reaction against the selected tumor antigens, which will activate the cytotoxic T lymphocytes to eradicate the tumor cells as soon as they express the CTAs after the drug treatment.
Some overlapping groups of peptides were observed in this analysis with extended n- and c-termini, as is commonly observed in HLA peptidome analyses (66, 67). We listed these extended length peptides separately, each with its NetMHC score according to the HLA allomorphs of each cell line, assuming that while being trimmed in the ER these extended peptides may bind and be stabilized by the different HLA molecules present in the different cells.
The poor correlations between the levels of the HLA peptides and their source transcripts or source proteins (Fig. 3) and the poor correlations of the fold-changes observed in response to the drug stimulations (Fig. 7), point to the importance of following the effects of the drug on the HLA peptidomes rather than on the transcriptomes or proteomes). Transcripts' levels can be defined more accurately than of proteins' because of the larger numbers of detected RNA 'reads' relative to quantifiable tryptic peptides derived from each of the proteins (59, 68–70) and certainly better than the HLA peptides. HLA peptides are quantified with single LC-MS signal intensities, which correlate poorly with the amounts of the peptides. Thus, the precise definitions of ratio between the copy numbers per cell and LC-MS signal intensities (MA/MS ratios) of the individual HLA peptides will need to be defined in the future by large scale quantitative mass spectrometry analyses, such as SRM or PRM (41, 71, 72), which were outside the scope of this study.
The findings described here raise the question whether transcriptome analyses may be sufficient in the future for selection of tumor antigens for immunotherapy without HLA peptidome analyses. Will it be possible to design tumor immunotherapy solely based on 'reverse immunology' using exome (for selection of neoantigens) or transcriptome (for selection of CTAs) analyses. Prediction of the HLA peptidomes based on the HLA typing of the presenting cells and familiarity with the HLA consensus binding motifs is currently limited in its capacity to define the nature of the presented HLA peptidome (5, 9, 44, 73, 74). Analyses of large HLA peptidomes presented by different HLA allotypes may facilitate the prediction of the sequences of the presented HLA ligands derived from each of the genes (73, 75). Because vaccination with peptides should preferably be based on peptides that are presented at sufficient levels to drive strong immune reactions to the deformed cells, quantitative HLA peptidome analysis may be beneficial for selection of the more highly expressed antigens for personalized immunotherapy (5).
NY-ESO-1 transcript was absent from the RNA-seq analysis, although it is well known to be elevated in cancer cells in numerous gene expression studies, including cells treated with Decitabine (37). The NY-ESO-1 transcript was clearly observed in the qRT-PCR analysis performed in this study (supplemental Fig. S5). This discrepancy between the qRT-PCR and the RNA-seq is because of the fact that the RNA reads associated with it are “multi-mapped” and therefore were removed from the transcriptome listing by the HTSeq-count package. Such shortfall should be avoided while looking for gene expression in the healthy tissues' transcriptome databases. It is pertinent to confirm that the selected genes are truly not expressed in the healthy tissue and not just artificially removed from the databases.
To conclude, our data suggest that drugs such as Decitabine should be considered as potential treatment for different cancers, in combination with pre-vaccination with the drug-induced CTAs. The identification of a numerous HLA peptides derived from CTAs and induced by the drug treatment suggests that the large-scale HLA peptidome and transcriptome analyses should be combined to search for other HLA peptides derived from tumor specific antigens to be tested as cancer vaccine candidates.
Supplementary Material
Acknowledgments
We thank Ilana Navon for the technical assistance in the operation of the mass spectrometers. HLA typing was performed by the Sheba Medical Center Tissue Typing Unit (Israel). Sequencing, mapping, counting, normalization, and differential gene expression analyses were performed by the Technion Genome Center. Mass spectrometry was performed at the Smoler Proteomics Center, Technion.
Footnotes
Author contributions: B.S., D.M., E.B., and A.A. designed research; B.S., D.M., E.B., and A.A. performed research; B.S., D.M., E.B., and A.A. analyzed data; B.S., D.M., E.B., and A.A. wrote the paper.
* This work was funded by the FP7 European Community GAPVAC project.
 This article contains supplemental material.
1 The abbreviations used are:
- GBM
- Glioblastoma multiforme
- HLA
- human leukocyte antigen
- MHC
- major histocompatibility complex
- CTA
- Cancer/Testis Antigens
- TA
- tumor antigens
- TSA
- tumor-specific antigens
- Decitabine
- 5-aza-2′-deoxycytidine
- TMZ
- Temozolamide.
REFERENCES
- 1. Alifieris C., and Trafalis D. T. (2015) Glioblastoma multiforme: Pathogenesis and treatment. Pharmacol. Ther. 152, 63–82 [DOI] [PubMed] [Google Scholar]
- 2. Mohme M., Neidert M. C., Regli L., Weller M., and Martin R. (2014) Immunological challenges for peptide-based immunotherapy in glioblastoma. Cancer Treat. Rev. 40, 248–258 [DOI] [PubMed] [Google Scholar]
- 3. Weiss T., Weller M., and Roth P. (2015) Immunotherapy for glioblastoma: concepts and challenges. Curr. Opin. Neurol. 28, 639–646 [DOI] [PubMed] [Google Scholar]
- 4. Galluzzi L., Vacchelli E., Bravo-San Pedro J. M., Buque A., Senovilla L., Baracco E. E., Bloy N., Castoldi F., Abastado J. P., Agostinis P., Apte R. N., Aranda F., Ayyoub M., Beckhove P., Blay J. Y., Bracci L., Caignard A., Castelli C., Cavallo F., Celis E., Cerundolo V., Clayton A., Colombo M. P., Coussens L., Dhodapkar M. V., Eggermont A. M., Fearon D. T., Fridman W. H., Fucikova J., Gabrilovich D. I., Galon J., Garg A., Ghiringhelli F., Giaccone G., Gilboa E., Gnjatic S., Hoos A., Hosmalin A., Jager D., Kalinski P., Karre K., Kepp O., Kiessling R., Kirkwood J. M., Klein E., Knuth A., Lewis C. E., Liblau R., Lotze M. T., Lugli E., Mach J. P., Mattei F., Mavilio D., Melero I., Melief C. J., Mittendorf E. A., Moretta L., Odunsi A., Okada H., Palucka A. K., Peter M. E., Pienta K. J., Porgador A., Prendergast G. C., Rabinovich G. A., Restifo N. P., Rizvi N., Sautes-Fridman C., Schreiber H., Seliger B., Shiku H., Silva-Santos B., Smyth M. J., Speiser D. E., Spisek R., Srivastava P. K., Talmadge J. E., Tartour E., Van Der Burg S. H., Van Den Eynde B. J., Vile R., Wagner H., Weber J. S., Whiteside T. L., Wolchok J. D., Zitvogel L., Zou W., and Kroemer G. (2014) Classification of current anticancer immunotherapies. Oncotarget 5, 12472–12508 [DOI] [PMC free article] [PubMed] [Google Scholar]
- 5. Rammensee H. G., and Singh-Jasuja H. (2013) HLA ligandome tumor antigen discovery for personalized vaccine approach. Expert Rev. Vaccines 12, 1211–1217 [DOI] [PMC free article] [PubMed] [Google Scholar]
- 6. Pol J., Bloy N., Buque A., Eggermont A., Cremer I., Sautes-Fridman C., Galon J., Tartour E., Zitvogel L., Kroemer G., and Galluzzi L. (2015) Trial Watch: Peptide-based anticancer vaccines. Oncoimmunology 4, e974411. [DOI] [PMC free article] [PubMed] [Google Scholar]
- 7. Comber J. D., and Philip R. (2014) MHC class I antigen presentation and implications for developing a new generation of therapeutic vaccines. Therap. Adv. Vaccines 2, 77–89 [DOI] [PMC free article] [PubMed] [Google Scholar]
- 8. de Verteuil D., Granados D. P., Thibault P., and Perreault C. (2012) Origin and plasticity of MHC I-associated self peptides. Autoimmunity Rev. 11, 627–635 [DOI] [PubMed] [Google Scholar]
- 9. Granados D. P., Laumont C. M., Thibault P., and Perreault C. (2014) The nature of self for T cells-a systems-level perspective. Curr. Opin. Immunol. 34C, 1–8 [DOI] [PubMed] [Google Scholar]
- 10. Heemskerk B., Kvistborg P., and Schumacher T. N. (2013) The cancer antigenome. EMBO J. 32, 194–203 [DOI] [PMC free article] [PubMed] [Google Scholar]
- 11. Cohen C. J., Gartner J. J., Horovitz-Fried M., Shamalov K., Trebska-McGowan K., Bliskovsky V. V., Parkhurst M. R., Ankri C., Prickett T. D., Crystal J. S., Li Y. F., El-Gamil M., Rosenberg S. A., and Robbins P. F. (2015) Isolation of neoantigen-specific T cells from tumor and peripheral lymphocytes. J. Clin. Invest. 125, 3981–3991 [DOI] [PMC free article] [PubMed] [Google Scholar]
- 12. Gubin M. M., Artyomov M. N., Mardis E. R., and Schreiber R. D. (2015) Tumor neoantigens: building a framework for personalized cancer immunotherapy. J. Clin. Invest. 125, 3413–3421 [DOI] [PMC free article] [PubMed] [Google Scholar]
- 13. Schumacher T. N., and Schreiber R. D. (2015) Neoantigens in cancer immunotherapy. Science 348, 69–74 [DOI] [PubMed] [Google Scholar]
- 14. Tran E., Ahmadzadeh M., Lu Y. C., Gros A., Turcotte S., Robbins P. F., Gartner J. J., Zheng Z., Li Y. F., Ray S., Wunderlich J. R., Somerville R. P., and Rosenberg S. A. (2015) Immunogenicity of somatic mutations in human gastrointestinal cancers. Science 350, 1387–1390 [DOI] [PMC free article] [PubMed] [Google Scholar]
- 15. Peper J. K., and Stevanovic S. (2015) A combined approach of human leukocyte antigen ligandomics and immunogenicity analysis to improve peptide-based cancer immunotherapy. Cancer Immunol. Immunother. 64, 1295–1303 [DOI] [PMC free article] [PubMed] [Google Scholar]
- 16. Ilyas S., and Yang J. C. (2015) Landscape of Tumor Antigens in T Cell Immunotherapy. J. Immunol. 195, 5117–5122 [DOI] [PMC free article] [PubMed] [Google Scholar]
- 17. Hinrichs C. S., and Restifo N. P. (2013) Reassessing target antigens for adoptive T-cell therapy. Nat. Biotechnol. 31, 999–1008 [DOI] [PMC free article] [PubMed] [Google Scholar]
- 18. Chen Y. T., Scanlan M. J., Sahin U., Tureci O., Gure A. O., Tsang S., Williamson B., Stockert E., Pfreundschuh M., and Old L. J. (1997) A testicular antigen aberrantly expressed in human cancers detected by autologous antibody screening. Proc. Natl. Acad. Sci. U.S.A. 94, 1914–1918 [DOI] [PMC free article] [PubMed] [Google Scholar]
- 19. Whitehurst A. W. (2014) Cause and consequence of cancer/testis antigen activation in cancer. Annu. Rev. Pharmacol. Toxicol. 54, 251–272 [DOI] [PubMed] [Google Scholar]
- 20. Cheng Y. H., Wong E. W., and Cheng C. Y. (2011) Cancer/testis (CT) antigens, carcinogenesis and spermatogenesis. Spermatogenesis 1, 209–220 [DOI] [PMC free article] [PubMed] [Google Scholar]
- 21. Gjerstorff M. F., Andersen M. H., and Ditzel H. J. (2015) Oncogenic cancer/testis antigens: prime candidates for immunotherapy. Oncotarget 6, 15772–15787 [DOI] [PMC free article] [PubMed] [Google Scholar]
- 22. Gubin M. M., Zhang X., Schuster H., Caron E., Ward J. P., Noguchi T., Ivanova Y., Hundal J., Arthur C. D., Krebber W. J., Mulder G. E., Toebes M., Vesely M. D., Lam S. S., Korman A. J., Allison J. P., Freeman G. J., Sharpe A. H., Pearce E. L., Schumacher T. N., Aebersold R., Rammensee H. G., Melief C. J., Mardis E. R., Gillanders W. E., Artyomov M. N., and Schreiber R. D. (2014) Checkpoint blockade cancer immunotherapy targets tumour-specific mutant antigens. Nature 515, 577–581 [DOI] [PMC free article] [PubMed] [Google Scholar]
- 23. Mahoney K. M., Rennert P. D., and Freeman G. J. (2015) Combination cancer immunotherapy and new immunomodulatory targets. Nat. Rev. Drug Discov. 14, 561–584 [DOI] [PubMed] [Google Scholar]
- 24. Weber J., Salgaller M., Samid D., Johnson B., Herlyn M., Lassam N., Treisman J., and Rosenberg S. A. (1994) Expression of the MAGE-1 tumor antigen is up-regulated by the demethylating agent 5-aza-2′-deoxycytidine. Cancer Res. 54, 1766–1771 [PubMed] [Google Scholar]
- 25. De Smet C., De Backer O., Faraoni I., Lurquin C., Brasseur F., and Boon T. (1996) The activation of human gene MAGE-1 in tumor cells is correlated with genome-wide demethylation. Proc. Natl. Acad. Sci. U.S.A. 93, 7149–7153 [DOI] [PMC free article] [PubMed] [Google Scholar]
- 26. Fratta E., Coral S., Covre A., Parisi G., Colizzi F., Danielli R., Nicolay H. J., Sigalotti L., and Maio M. (2011) The biology of cancer testis antigens: putative function, regulation and therapeutic potential. Mol. Oncol. 5, 164–182 [DOI] [PMC free article] [PubMed] [Google Scholar]
- 27. Feinberg A. P., and Vogelstein B. (1983) Hypomethylation distinguishes genes of some human cancers from their normal counterparts. Nature 301, 89–92 [DOI] [PubMed] [Google Scholar]
- 28. Gama-Sosa M. A., Slagel V. A., Trewyn R. W., Oxenhandler R., Kuo K. C., Gehrke C. W., and Ehrlich M. (1983) The 5-methylcytosine content of DNA from human tumors. Nucleic Acids Res. 11, 6883–6894 [DOI] [PMC free article] [PubMed] [Google Scholar]
- 29. Heninger E., Krueger T. E., and Lang J. M. (2015) Augmenting antitumor immune responses with epigenetic modifying agents. Front. Immunol. 6, 1–9 [DOI] [PMC free article] [PubMed] [Google Scholar]
- 30. Valdespino V., and Valdespino P. M. (2015) (Potential of epigenetic therapies in the management of solid tumors. Cancer Manag. Res. 7, 241–251 [DOI] [PMC free article] [PubMed] [Google Scholar]
- 31. Claus R., Almstedt M., and Lubbert M. (2005) Epigenetic treatment of hematopoietic malignancies: in vivo targets of demethylating agents. Semin. Oncol. 32, 511–520 [DOI] [PubMed] [Google Scholar]
- 32. Everson R. G., Antonios J. P., Lisiero D. N., Soto H., Scharnweber R., Garrett M. C., Yong W. H., Li N., Li G., Kruse C. A., Liau L. M., and Prins R. M. (2016) Efficacy of systemic adoptive transfer immunotherapy targeting NY-ESO-1 for glioblastoma. Neuro. Oncol. 18, 368–378 [DOI] [PMC free article] [PubMed] [Google Scholar]
- 33. Jones P. A., and Taylor S. M. (1980) Cellular differentiation, cytidine analogs and DNA methylation. Cell 20, 85–93 [DOI] [PubMed] [Google Scholar]
- 34. Serrano A., Tanzarella S., Lionello I., Mendez R., Traversari C., Ruiz-Cabello F., and Garrido F. (2001) Rexpression of HLA class I antigens and restoration of antigen-specific CTL response in melanoma cells following 5-aza-2′-deoxycytidine treatment. Int. J. Cancer 94, 243–251 [DOI] [PubMed] [Google Scholar]
- 35. Coral S., Sigalotti L., Gasparollo A., Cattarossi I., Visintin A., Cattelan A., Altomonte M., and Maio M. (1999) Prolonged upregulation of the expression of HLA class I antigens and costimulatory molecules on melanoma cells treated with 5-aza-2′-deoxycytidine (5-AZA-CdR). J. Immunother. 22, 16–24 [DOI] [PubMed] [Google Scholar]
- 36. Nie Y., Yang G., Song Y., Zhao X., So C., Liao J., Wang L. D., and Yang C. S. (2001) DNA hypermethylation is a mechanism for loss of expression of the HLA class I genes in human esophageal squamous cell carcinomas. Carcinogenesis 22, 1615–1623 [DOI] [PubMed] [Google Scholar]
- 37. Natsume A., Wakabayashi T., Tsujimura K., Shimato S., Ito M., Kuzushima K., Kondo Y., Sekido Y., Kawatsura H., Narita Y., and Yoshida J. (2008) The DNA demethylating agent 5-aza-2′-deoxycytidine activates NY-ESO-1 antigenicity in orthotopic human glioma. Int. J. Cancer 122, 2542–2553 [DOI] [PubMed] [Google Scholar]
- 38. Coral S., Covre A., Nicolay H. J., Parisi G., Rizzo A., Colizzi F., Dalla Santa S., Fonsatti E., Fratta E., Sigalotti L., and Maio M. (2012) Epigenetic remodelling of gene expression profiles of neoplastic and normal tissues: immunotherapeutic implications. Br. J. Cancer 107, 1116–1124 [DOI] [PMC free article] [PubMed] [Google Scholar]
- 39. Konkankit V. V., Kim W., Koya R. C., Eskin A., Dam M. A., Nelson S., Ribas A., Liau L. M., and Prins R. M. (2011) Decitabine immunosensitizes human gliomas to NY-ESO-1 specific T lymphocyte targeting through the Fas/Fas ligand pathway. J. Transl. Med. 9, 192. [DOI] [PMC free article] [PubMed] [Google Scholar]
- 40. Weiser T. S., Guo Z. S., Ohnmacht G. A., Parkhurst M. L., Tong-On P., Marincola F. M., Fischette M. R., Yu X., Chen G. A., Hong J. A., Stewart J. H., Nguyen D. M., Rosenberg S. A., and Schrump D. S. (2001) Sequential 5-Aza-2 deoxycytidine-depsipeptide FR901228 treatment induces apoptosis preferentially in cancer cells and facilitates their recognition by cytolytic T lymphocytes specific for NY-ESO-1. J. Immunother. 24, 151–161 [DOI] [PubMed] [Google Scholar]
- 41. Caron E., Kowalewski D. J., Chiek Koh C., Sturm T., Schuster H., and Aebersold R. (2015) Analysis of major histocompatibility complex (MHC) immunopeptidomes using mass spectrometry. Mol. Cell. Proteomics 14, 3105–3117 [DOI] [PMC free article] [PubMed] [Google Scholar]
- 42. Fortier M. H., Caron E., Hardy M. P., Voisin G., Lemieux S., Perreault C., and Thibault P. (2008) The MHC class I peptide repertoire is molded by the transcriptome. J. Exp. Med. 205, 595–610 [DOI] [PMC free article] [PubMed] [Google Scholar]
- 43. de Verteuil D., Muratore-Schroeder T. L., Granados D. P., Fortier M. H., Hardy M. P., Bramoulle A., Caron E., Vincent K., Mader S., Lemieux S., Thibault P., and Perreault C. (2010) Deletion of immunoproteasome subunits imprints on the transcriptome and has a broad impact on peptides presented by major histocompatibility complex I molecules. Mol. Cell. Proteomics 9, 2034–2047 [DOI] [PMC free article] [PubMed] [Google Scholar]
- 44. Granados D. P., Yahyaoui W., Laumont C. M., Daouda T., Muratore-Schroeder T. L., Cote C., Laverdure J. P., Lemieux S., Thibault P., and Perreault C. (2012) MHC I-associated peptides preferentially derive from transcripts bearing miRNA response elements. Blood 119, e181–e191 [DOI] [PubMed] [Google Scholar]
- 45. Yadav M., Jhunjhunwala S., Phung Q. T., Lupardus P., Tanguay J., Bumbaca S., Franci C., Cheung T. K., Fritsche J., Weinschenk T., Modrusan Z., Mellman I., Lill J. R., and Delamarre L. (2014) Predicting immunogenic tumour mutations by combining mass spectrometry and exome sequencing. Nature 515, 572–576 [DOI] [PubMed] [Google Scholar]
- 46. Weinzierl A. O., Lemmel C., Schoor O., Muller M., Kruger T., Wernet D., Hennenlotter J., Stenzl A., Klingel K., Rammensee H. G., and Stevanovic S. (2007) Distorted relation between mRNA copy number and corresponding major histocompatibility complex ligand density on the cell surface. Mol. Cell. Proteomics 6, 102–113 [DOI] [PubMed] [Google Scholar]
- 47. Hoof I., van Baarle D., Hildebrand W. H., and Kesmir C. (2012) Proteome sampling by the HLA class I antigen processing pathway. PLoS Comput. Biol. 8, e1002517. [DOI] [PMC free article] [PubMed] [Google Scholar]
- 48. Bassani-Sternberg M., Pletscher-Frankild S., Jensen L. J., and Mann M. (2015) Mass spectrometry of human leukocyte antigen class I peptidomes reveals strong effects of protein abundance and turnover on antigen presentation. Mol. Cell. Proteomics 14, 658–673 [DOI] [PMC free article] [PubMed] [Google Scholar]
- 49. Milner E., Gutter-Kapon L., Bassani-Strenberg M., Barnea E., Beer I., and Admon A. (2013) The effect of proteasome inhibition on the generation of the human leukocyte antigen (HLA) peptidome. Mol. Cell. Proteomics 12, 1853–1864 [DOI] [PMC free article] [PubMed] [Google Scholar]
- 50. Ishihama Y., Rappsilber J., and Mann M. (2006) Modular stop and go extraction tips with stacked disks for parallel and multidimensional Peptide fractionation in proteomics. J. Proteome Res. 5, 988–994 [DOI] [PubMed] [Google Scholar]
- 51. Bourdetsky D., Schmelzer C. E., and Admon A. (2014) The nature and extent of contributions by defective ribosome products to the HLA peptidome. Proc. Natl. Acad. Sci. U.S.A. 111, E1591–E1599 [DOI] [PMC free article] [PubMed] [Google Scholar]
- 52. Cox J., and Mann M. (2008) MaxQuant enables high peptide identification rates, individualized p.p.b.-range mass accuracies and proteome-wide protein quantification. Nat. Biotechnol. 26, 1367–1372 [DOI] [PubMed] [Google Scholar]
- 53. Cox J., Neuhauser N., Michalski A., Scheltema R. A., Olsen J. V., and Mann M. (2011) Andromeda: a peptide search engine integrated into the MaxQuant environment. J. Proteome Res. 10, 1794–1805 [DOI] [PubMed] [Google Scholar]
- 54. Vizcaino J. A., Csordas A., Del-Toro N., Dianes J. A., Griss J., Lavidas I., Mayer G., Perez-Riverol Y., Reisinger F., Ternent T., Xu Q. W., Wang R., and Hermjakob H. (2016) 2016 update of the PRIDE database and its related tools. Nucleic Acids Res. 44, D447–D456 [DOI] [PMC free article] [PubMed] [Google Scholar]
- 55. Trapnell C., Pachter L., and Salzberg S. L. (2009) TopHat: discovering splice junctions with RNA-Seq. Bioinformatics 25, 1105–1111 [DOI] [PMC free article] [PubMed] [Google Scholar]
- 56. Anders S., Pyl P. T., and Huber W. (2015) HTSeq–a Python framework to work with high-throughput sequencing data. Bioinformatics 31, 166–169 [DOI] [PMC free article] [PubMed] [Google Scholar]
- 57. Almeida L. G., Sakabe N. J., deOliveira A. R., Silva M. C., Mundstein A. S., Cohen T., Chen Y. T., Chua R., Gurung S., Gnjatic S., Jungbluth A. A., Caballero O. L., Bairoch A., Kiesler E., White S. L., Simpson A. J., Old L. J., Camargo A. A., and Vasconcelos A. T. (2009) CTdatabase: a knowledge-base of high-throughput and curated data on cancer-testis antigens. Nucleic Acids Res. 37, D816–D819 [DOI] [PMC free article] [PubMed] [Google Scholar]
- 58. Andreatta M., and Nielsen M. (2016) Gapped sequence alignment using artificial neural networks: application to the MHC class I system. Bioinformatics 32, 511–517 [DOI] [PMC free article] [PubMed] [Google Scholar]
- 59. Liu Y., and Aebersold R. (2016) The interdependence of transcript and protein abundance: new data-new complexities. Mol. Syst. Biol. 12, 856. [DOI] [PMC free article] [PubMed] [Google Scholar]
- 60. Wu C., Jin X., Tsueng G., Afrasiabi C., and Su A. I. (2016) BioGPS: building your own mash-up of gene annotations and expression profiles. Nucleic Acids Res. 44, D313–D316 [DOI] [PMC free article] [PubMed] [Google Scholar]
- 61. Wu C., Orozco C., Boyer J., Leglise M., Goodale J., Batalov S., Hodge C. L., Haase J., Janes J., Huss J. W. 3rd, and Su A. I. (2009) BioGPS: an extensible and customizable portal for querying and organizing gene annotation resources. Genome Biol. 10, R130. [DOI] [PMC free article] [PubMed] [Google Scholar]
- 62. Dutoit V., Taub R. N., Papadopoulos K. P., Talbot S., Keohan M. L., Brehm M., Gnjatic S., Harris P. E., Bisikirska B., Guillaume P., Cerottini J. C., Hesdorffer C. S., Old L. J., and Valmori D. (2002) Multiepitope CD8(+) T cell response to a NY-ESO-1 peptide vaccine results in imprecise tumor targeting. J. Clin. Invest. 110, 1813–1822 [DOI] [PMC free article] [PubMed] [Google Scholar]
- 63. Marchand M., van Baren N., Weynants P., Brichard V., Dreno B., Tessier M. H., Rankin E., Parmiani G., Arienti F., Humblet Y., Bourlond A., Vanwijck R., Lienard D., Beauduin M., Dietrich P. Y., Russo V., Kerger J., Masucci G., Jager E., De Greve J., Atzpodien J., Brasseur F., Coulie P. G., van der Bruggen P., and Boon T. (1999) Tumor regressions observed in patients with metastatic melanoma treated with an antigenic peptide encoded by gene MAGE-3 and presented by HLA-A1. Int. J. Cancer 80, 219–230 [DOI] [PubMed] [Google Scholar]
- 64. Rosenberg S. A., Yang J. C., Schwartzentruber D. J., Hwu P., Marincola F. M., Topalian S. L., Restifo N. P., Dudley M. E., Schwarz S. L., Spiess P. J., Wunderlich J. R., Parkhurst M. R., Kawakami Y., Seipp C. A., Einhorn J. H., and White D. E. (1998) Immunologic and therapeutic evaluation of a synthetic peptide vaccine for the treatment of patients with metastatic melanoma. Nat. Med. 4, 321–327 [DOI] [PMC free article] [PubMed] [Google Scholar]
- 65. Kalaora S., Barnea E., Merhavi-Shoham E., Qutob N., Teer J. K., Shimony N., Schachter J., Rosenberg S. A., Besser M. J., Admon A., and Samuels Y. (2016) Use of HLA peptidomics and whole exome sequencing to identify human immunogenic neo-antigens. Oncotarget 7, 5110–5117 [DOI] [PMC free article] [PubMed] [Google Scholar]
- 66. Kanaseki T., Lind K. C., Escobar H., Nagarajan N., Reyes-Vargas E., Rudd B., Rockwood A. L., Van Kaer L., Sato N., Delgado J. C., and Shastri N. (2013) ERAAP and tapasin independently edit the amino and carboxyl termini of MHC class I peptides. J. Immunol. 191, 1547–1555 [DOI] [PMC free article] [PubMed] [Google Scholar]
- 67. Rist M. J., Theodossis A., Croft N. P., Neller M. A., Welland A., Chen Z., Sullivan L. C., Burrows J. M., Miles J. J., Brennan R. M., Gras S., Khanna R., Brooks A. G., McCluskey J., Purcell A. W., Rossjohn J., and Burrows S. R. (2013) HLA peptide length preferences control CD8+ T cell responses. J. Immunol. 191, 561–571 [DOI] [PubMed] [Google Scholar]
- 68. Li J. J., and Biggin M. D. (2015) Gene expression. Statistics requantitates the central dogma. Science 347, 1066–1067 [DOI] [PubMed] [Google Scholar]
- 69. Schwanhausser B., Busse D., Li N., Dittmar G., Schuchhardt J., Wolf J., Chen W., and Selbach M. (2011) Global quantification of mammalian gene expression control. Nature 473, 337–342 [DOI] [PubMed] [Google Scholar]
- 70. Wang X., Liu Q., and Zhang B. (2014) Leveraging the complementary nature of RNA-Seq and shotgun proteomics data. Proteomics 14, 2676–2687 [DOI] [PMC free article] [PubMed] [Google Scholar]
- 71. Lange V., Picotti P., Domon B., and Aebersold R. (2008) Selected reaction monitoring for quantitative proteomics: a tutorial. Mol. Syst. Biol. 4, 222. [DOI] [PMC free article] [PubMed] [Google Scholar]
- 72. Lesur A., and Domon B. (2015) Advances in high-resolution accurate mass spectrometry application to targeted proteomics. Proteomics 15, 880–890 [DOI] [PubMed] [Google Scholar]
- 73. Admon A., and Bassani-Sternberg M. (2011) The Human Immunopeptidome Project, a suggestion for yet another postgenome next big thing. Mol. Cell. Proteomics 10, O111 011833 [DOI] [PMC free article] [PubMed] [Google Scholar]
- 74. Granados D. P., Sriranganadane D., Daouda T., Zieger A., Laumont C. M., Caron-Lizotte O., Boucher G., Hardy M. P., Gendron P., Cote C., Lemieux S., Thibault P., and Perreault C. (2014) Impact of genomic polymorphisms on the repertoire of human MHC class I-associated peptides. Nat. Commun. 5, 3600. [DOI] [PMC free article] [PubMed] [Google Scholar]
- 75. Lundegaard C., Lund O., and Nielsen M. (2012) Predictions versus high-throughput experiments in T-cell epitope discovery: competition or synergy? Expert Rev. Vaccines 11, 43–54 [DOI] [PMC free article] [PubMed] [Google Scholar]
- 76. Yeung J. T., Hamilton R. L., Ohnishi K., Ikeura M., Potter D. M., Nikiforova M. N., Ferrone S., Jakacki R. I., Pollack I. F., and Okada H. (2013) LOH in the HLA class I region at 6p21 is associated with shorter survival in newly diagnosed adult glioblastoma. Clin. Cancer Res. 19, 1816–1826 [DOI] [PMC free article] [PubMed] [Google Scholar]
Associated Data
This section collects any data citations, data availability statements, or supplementary materials included in this article.