

Abstract
Due to the need of high-speed and efficient biodosimetric assays for triage and therapy in the event of radiological or nuclear attack, a robotically based automated biodosimetry tool (RABiT) has been developed over the past few years. Adapting the micronucleus assay from filter plates to V-shaped plates presented challenges in the liquid handling, namely, cell splashing out of the V-shaped well plate during the cell harvesting, poor cell distribution on the bottom of the image plate during the dispensing, and cell loss from the image plate during the aspiration in the liquid handling process. Experimental and numerical investigations were carried out to better understand the phenomena and mitigate the problems. Surface tension and contact angle among the fluids and the plate wall were accounted for in the discrete and multiphase numerical models. Experimental conditions were optimized based on the numerical results showing the relationship between nozzle speed and amount of splashed liquid, and the relationship between aspiration speed and number of escaped cells. Using these optimized parameters, numbers of micronuclei in binucleated cells showed the same dose dependence in the RABiT-prepared samples as those in the manually prepared ones. Micronucleus assay protocol was fully realized on RABiT.
Keywords: automated biodosimetry tool, micronucleus assay, platform-dependent liquid handling
1. Background
1.1. Motivation.
The potential threat of radiological or nuclear spread always exists. Consider that a big city like New York is attacked by a radiological dispersal device; the attack will cause great social panic and people will need to know if they are exposed to high enough radiation dosage requiring further medical attention. Medical facilities will be overloaded with patients because manual processing of samples such as blood is too time-consuming, and many general medical facilities are not equipped to perform a cytogenetic biodosimetry assay. Thus, a rapid biodosimetric system that can examine samples from thousands of exposed individuals is needed to handle this situation. Throughout the past decade, many researchers have been working on designing an automated system based on robotic handling and high-speed imaging. From Kachel et al.'s research, a custom-made automated system was designed to isolate deoxyribonucleic acid (DNA) plasmids [1]. Meldrum et al. designed a system to prepare glass capillary sample [2]. The proposed solutions, however, only focused on sample handling and imaging system, but not automation of the entire protocol.
Due to the need of high-speed and efficient of biodosimetric assays for triage and therapy, a RABiT has been developed by the Center for High-Throughput Minimally Invasive Radiation Biodosimetry at Columbia University over the past few years [3–5]. Many improvements were achieved on the system, such as capillary pick-up error recognition, and redesign of the cell harvest process that increased reliability and significantly reduced the time to process samples. In a previous work, whole protocol of γ-H2AX assay and part of micronucleus assay were adapted on RABiT [5]. Both assays are currently used in radiation biodosimetry. The γ-H2AX biomarker is used to measure the number of DNA double strand breaks, which has a linear relationship with radiation dose [5]. The disadvantage of this biodosimetry biomarker is that after acute exposure the γ-H2AX signal is short lived and typically undetectable after ∼24–48 hrs. This assay therefore requires that the blood must be examined within 36 hrs of irradiation. For the micronucleus assay, lymphocytes are cultured to division: lymphocytes with chromosome damages form binuclei with one or more micronuclei containing chromosomal fragments (Fig. 1). The main advantage of micronucleus assay is that micronuclei typically have a half-life of 1 year and thus removes the necessity for the early acquisition of blood samples. In recent years, many researchers have been trying to automate the analysis of micronucleus assay. Tamizh et al.'s research used a microscope with a monitored scanning stage to automatically score the micronuclei [6]. Rodrigues et al. automated the analysis of cytokinesis-block micronuclei assay using imaging flow cytometry [7]. However, their systems are not designed to automate the entire protocol. In order to fully realize the micronuclei assay protocol, several changes need to be made on the RABiT system such as the platforms used for the micronuclei assay need to be switched to 96 V-shaped well plate and imaging plate, all the liquid handling processes need to be executed within the well, sequences of the system need to be changed to adapt the protocol and liquid handling process needs to be changed due to introducing more reagents. New challenges arise from these changes and increase the complexity of the process.
Fig. 1.

Optical microscopy of binuclei with micronuclei stained with DNA-specific fluorescent dye DAPI. Lymphocytes are cultured to division: lymphocytes with chromosome damage form binuclei with one or more micronuclei containing chromosomal fragments.
In this study, micronucleus assay protocol is fully adapted on RABiT system. Coupling multiphase fluids and discrete phase model, and considering factors like surface tension and contact angle, the numerical models successfully capture the physical phenomena. These phenomena include the experimentally observed cell splashing during cell harvesting process, poor cell distribution on the bottom of the image plate during dispensing process, and cell loss from the image plate during the aspiration in the liquid handling process. Numerical methods are then used to predict and optimize the experiment results to reduce trial and error attempts. Finally, the optimized conditions render the RABiT prepared samples the same quality as manually prepared samples. As a result, the scoring of micronuclei in binucleus cells under different doses of radiation shows the same trend for both preparations.
1.2. Overview of the RABiT System.
The RABiT is designed for handling the entire process from blood collection to imaging analysis at high speed. The system is composed of eight modules: input stage, service robot, centrifuge, cell harvesting, liquid handling, incubation, control system, and imaging system module (Fig. 2(a)). The general process steps are shown in Fig. 2(b).
Fig. 2.

(a) Layout of the RABiT. The system is composed of eight modules: input stage, service robot, centrifuge, cell harvesting, liquid handling, incubation, control system, and imaging system module. (b) General process steps of the system.
Capillaries are manually loaded with blood samples and inserted into the four buckets, which are placed at the input stage, where the service robot picks up the buckets. The service robot (RS80 SCARA, Staubli Robotics) is used to transfer the bucket and well plate between different modules. The centrifuge is used to separate the lymphocytes and red blood cells in the capillary. Cell harvest module cuts the capillary with a laser after the centrifuge module (5810 R, Eppendorf) and collects cells from the capillary to the well plate by using compressed air. Buckets loaded with capillary after centrifuging are placed at the input position of the cell harvest module. After centrifugation, the capillaries are picked up by capillary grippers mounted on the arm of cell harvest robot, and the arm rotates to transfer capillary to laser cutting position. After laser cutting, the nozzle above the capillary gripper blows the liquid in the upper part of the capillary into the well.
All the liquid handling processes are executed in the liquid handling module (Sciclone ALH 3000, Caliper Life Science): eight bulk reagent dispensers are used to add large amount of liquid; 96 cannulas are used to transfer the liquid; the gantry is used to transport the well plate at different locations in the liquid handling module. The incubation module is made of an incubator (Liconic STX220, Liconic U.S. Inc.), which is capable of receiving well plates, incubating under specific temperature, and exporting well plates after incubation. Control system module is the central master controller which controls, monitors, and records the operation of the RABiT globally. The imaging system module automatically processes the analysis of the cells in each well.
2. Platform Switching
The RABiT incorporates different well plates in the fully automated protocol from centrifuging to imaging. For example, 96 filter well plate with 0.4 μm pores in polycarbonate membrane film well bottoms are used in γ-H2AX protocol. The membrane allows for the disposing of liquid in the well when the top surface of plate is sealed and pressure is applied by the positive pressure unit. Doing so purges the blood plasma and separation medium through the filter membrane into the waste system while lymphocytes are left in the well. After liquid handling, the polycarbonate filter bottom is detached from the plate and transferred to an adhesive surface and sealed by a transparent, low-fluorescence adhesive film for imaging usage (Fig. 3(a)).
Fig. 3.

Three-dimensional drawing of (a) filter plate contains a polycarbonate membrane on the bottom of the well and a recessed underdrain beneath the membrane. (b) V-shaped well plate has a conic bottom which is made of polystyrene. (c) Imaging plate has a rectangular well and a transparent thin film sealing the bottom of the plate. (a) is the well plate used before, (b) and (c) are the well plates currently in use.
When the system is switched to the micronuclei protocol, increased amount of blood clogs the filter membrane. V-shaped well plate (Fig. 3(b)) and imaging plate (Fig. 3(c)) are introduced to fix the clogging problem and fully adapt micronuclei protocol on the system. Compared with the filter plate, new plates have several differences. For the V-shaped well plate, the bottom of the well is cone shaped, which is optimal for changing the liquid compared to U-shaped or flat bottom wells; and there is no filter membrane in it. Thus, the liquid handling has to be carried out inside the well and the reagents are exchanged and disposed by aspirating from the well. For the imaging plate, the shape of the well is close to rectangular and the bottom of the well is a transparent thin film, where the cells after liquid handling are transferred. The transparent thin film is examined by microscopy to process imaging analysis.
2.1. Challenges Arising From Switched Platform.
In the cell harvesting module, cells in the capillary are collected into a single well by compressed air from a nozzle. In the r-H2AX protocol, when lymphocyte band and separation media were blown to the filter plate, the liquid kept in the each single well with same amount. However, although air flow did shear the lymphocytes, it was at the level at which cell viability was unaffected, when switched to micronuclei protocol, liquid splashed from the V-shaped well, which led to the cross contamination and failure of collecting lymphocytes. The splash of a droplet impacting a surface has been studied in the past decade. For example, Bussmann et al.'s research [8] experimentally and numerically showed distinct splashing phenomena under different inject velocities and contact angles. The variables that affect splashing include geometry, wettability, liquid–gas surface tension, surface roughness, velocity, liquid density, etc [9–14]. In our case, there are two main differences between filter plate and V-shaped plate: the geometry of the well in filter plate is cylindrical with a flat bottom made of 0.4 μm pore polycarbonate membrane, and the V-shaped plate well has a cone-shaped bottom made of polystyrene. In order to keep high throughput biodosimetry, laser cutting and dispensing processes are carried out spontaneously. Adjusting the distance between the cannula and the well plates can also be one option to reduce the splashing phenomena; however, it requires the system to separate laser cutting and dispensing processes into two movements, which lowers the sample processing speed. Thus, the wettability, inlet velocity, and geometry differences are considered as the key factors leading to the splashing when V-shaped well plate is used.
In the previous protocol, a positive pressure module that can seal the top surface of the 96 filter well plate, apply compressed air into each of the wells, force the liquid to go through the membrane, and leave the lymphocytes in the well, is used to wash away the separation media from the lymphocytes. However, due to the increasing amount of blood in each sample and impermeable new plates for the micronucleus assays, 96 cannula module is used for dispensing, mixing, and aspiration. Instead, there are problems that need to be addressed when using 96 cannula module. When the cells are transferred from V-shaped well plate to imaging plate, the cells are more likely to be pushed to the edge, which leads to uneven cell distribution on the bottom of the well that significantly increases the difficulty of imaging analysis. When aspirating most of the liquid in the well during the wash process, the cells are likely to be brought out with the aspirated liquid, which leads to the loss of the cells.
3. Experiment Conditions and Procedures
The well plates used are V-shaped well plate (microplate, 96 well, Greiner Bio-One, Item 651261) and imaging plate (microplate, 96 well, ibiTreat, Item 89626). The blood is collected from donors at the age of 28–35. Blood samples (50 μl) are pipetted into heparin-coated polyvinyl chloride capillaries (Safe-T-Fill capillaries; RAM Scientific, Inc., Yonkers, NY) with 30 μl lymphocyte separation media (Histopaque-1083; Invitrogen, Eugene, OR). The blood samples are exposed to gamma rays (0, 2, 4, and 6 Gy) by using Gammacell 40 137C irradiator (Atomic Energy of Canada Ltd., Chalk River, ON, Canada). The centrifuge is used to isolate lymphocytes in the blood at the speed of 3750 rpm for 5 min. As can be seen from Fig. 4(a), after centrifuging, due to the difference of density, red blood cells are at the bottom of the capillary, separation media is in the middle, and lymphocytes band is located above the separation media and below plasma.
Fig. 4.

(a) Image of the capillary after centrifuging. Due to the difference of density, red blood cells are at the bottom of the capillary, separation media is in the middle, and lymphocytes band is located above the separation media and below plasma. Laser cutting position is 10 mm below the lymphocyte band. (b) Three-dimensional drawing of capillary gripper. Each capillary is picked up due to the friction force by the O rings in the collet. Plunger in the shaft is used to partially seal the capillary tip not to lose cells during transportation. Compressed air from the nozzle comes into the shaft from the top, pushing the liquid out of the capillary [3].
The standard micronucleus protocols [15] are optimized for adapting on RABiT system in terms of well plates and reagents. The modified protocol is summarized below.
Capillaries with blood samples are loaded manually into the buckets; service robot transfers the buckets into the centrifuge. After centrifuging, service robot loads the buckets onto cell harvesting module (Fig. 2(a)). Capillary grippers pick up capillaries one by one and then a laser cuts the capillaries. When the capillary is rotated in position above the well plate, a nozzle blows out compressed air for 0.5 s and the wells collect cells in the capillary(Fig. 4(b)).
After cell harvesting, service robot transfers well plate with cells onto the liquid handling module. 200 μl of culture medium (PB-MAX, Life Technologies) is added to each individual well. Then the well plate is transferred into the incubator at 37 °C with 5% carbon dioxide concentration for 44 hrs. The incubator automatically exports the well plate after cell culturing and the service robot transfers it back to liquid handling module. 25 μl of Cytochalasin B (concentration 60 μg/ml), which is to stop cell division and collect more cells in the binucleated form, is added to each well before incubation for another 26 hrs. Then the liquid in each well is aspirated from the well plate (leave about 50 μl of liquid with cells), and 150 μl of distilled water and 20 μl of 10 × phosphate buffered saline (PBS) are added and mixed with cells. Liquid with cells from V-shaped plate is aspirated then, dispensed to the imaging plate. After an hour wait, 25 μl 10 × Fixative is added and all liquid is aspirated (leave about 50 μl in the imaging plate). The final concentration of PBS is 1 × in cell solution, which is the standard solution for cells. Each single well is washed by 200 μl 1 × PBS twice before adding 200 μl staining solution 4′,6-diamidino-2-phenylindole (DAPI).
4. Numerical Modeling of Liquid Handling
Trial and error method used in the experiment is too time-consuming and costly. Numerical modeling is introduced to predict and improve experiment conditions and results.
4.1. Geometries.
For the cell splashing simulation, 2D cross sections of a single filter plate well (Fig. 5(a)) and a single V-shaped plate well (Fig. 5(b)) are used as the model geometry. Actual dimensions of the wells are used. The capillary with 1.12 mm inner diameter is placed 5 mm above the well.
Fig. 5.
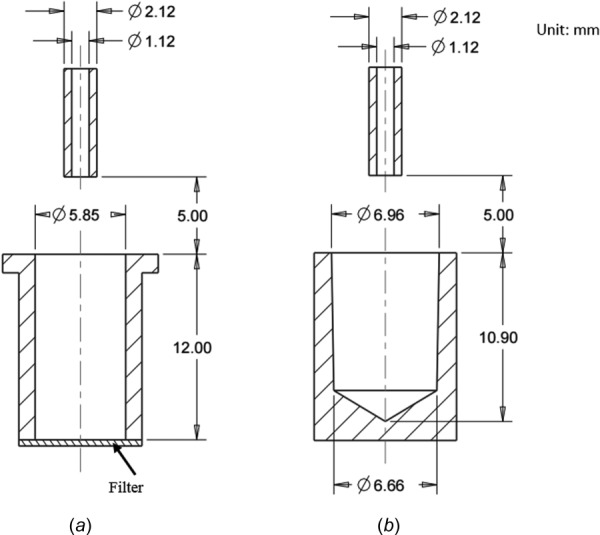
Well plate geometries used in the numerical modeling. (a) 2D cross section geometry of the filter plate, the bottom of which is made of polycarbonate membrane. (b) 2D cross section geometry of the V-shaped well plate with conic bottom.
For the dispensing and aspiration simulations, the geometry used is a 3D well the same size as the imaging plate (Fig. 6(b)). A 2D cross section geometry of the imaging plate is shown in Fig. 6(a). The cannula is placed at the center of the well and 1 mm away from the bottom of the well plate, which is a transparent thin film. The arrows represent the velocity field of the liquid region within the well and their magnitudes represent the current flow speed at specific points.
Fig. 6.

Imaging well plate geometries used in the numerical modeling. (a) 2D cross section geometry of the imaging well plate, bottom of which is a transparent thin film. (b) 3D geometry of the imaging plate; the cannula is placed 1 mm above the bottom and the arrows indicate the velocity field of the liquid region.
4.2. Multiphase Flow Theory.
In our case, there are two phases in the computational region, air and liquid. Thus, it leads to a multiphase flow problem. Multiphase flow represents a flow with different phases at the same time period. The mass conservation equation and the momentum equation, known as Navier–Stokes equations, are needed to describe the state of any type of flow and are generally solved in computational fluid dynamics modeling. Because of the complexity of multiphase flow, several approaches have been developed to solve this problem [16–18]: Euler–Lagrange approach, Euler–Euler approach, and volume of fluid approach. In the volume of fluid approach [18], the flow equations are volume averaged and the interface is tracked using a phase indicator function, which is also related to the volume fraction. In order to trace the interface between liquid and air, volume of fluid method is the best for the free boundaries because volume of fluids (VOF) model does not allow the phases to interpenetrate. The assumptions used in the VOF model are listed as follows: only two phases in this system, the fluids are continuum and immiscible, parameters like pressure and density are differentiable and all the variables are shared between phases. Hence, in the VOF, the governing equations are changed to [19]
| (1) |
| (2) |
where is the density, is the velocity of the fluid and t is time, p is the static pressure, is the viscous stress tensor, represents the effect of time-independent acceleration of the flow with respect to space, and is the gravitational body force. represents some external body force acting on the fluid such as surface tension [20].
Here, for m-phase system, the volume-fraction-averaged density is
| (3) |
where is the volume fraction of kth phase; if , the control volume is filled only with phase k.
And for two-phase flow in our cases, the surface tension term in the source term in momentum equation is
| (4) |
where is the curvature, which is defined as the divergence of the unit normal of the surface and is the surface tension coefficient.
The boundary condition of the geometry is set as a stationary wall
| (5) |
The outlet is set as pressure outlet with the absolute pressure equal to the operating pressure and the inlet is set as velocity inlet with volume fraction of liquid equal to 1.
4.3. Motion of Cells.
In our case, the cells within the liquid will deposit onto the bottom due to gravity or move around according to the situation of liquid region; so, they can be considered as inert particles with mass. The motion of the cells is predicted by integrating the force balance on the particles. This force balance equates the particle inertia with the forces acting on the particle [21] and the formula is
| (6) |
where is the particle velocity, is the fluid velocity, is the particle relaxation time [22], is the density of particle, is the fluid density, and is additional force term including forces due to the pressure gradient in the fluid, the first tem on the right hand right is related to the drag force and the second term is related to the gravity affect. This equation shows the forces required to accelerate the fluid surrounding the particles and forces due to pressure gradients in the fluid. In this study, a commercial software, fluent, is used to realize the numerical simulation of liquid handling. The material parameters used in the simulation are listed in Table 1.
Table 1.
| Surface tension of liquid | 73 dyn/cm |
| Contact angle for filter plate (polycarbonate membrane) | 30 deg |
| Contact angle for V-shaped plate (polystyrene) | 150 deg |
| Density of lymphocyte | 1.6 g/cm3 |
5. Results and Discussion
5.1. Splashing During Cell Harvesting Process.
From the experimental observation of the V-shaped well plate with collected liquid from capillaries after laser cutting, the amount of the liquid in each well was not equal. It was clearly observed that some liquid splashed into the neighboring well or the gap between wells led to the cross contamination. The inadequate amount of liquid collected led to the low number of cells in wells and statistically unreliable experiment data.
The splash of a droplet impacting a surface was related to the various factors. Gabriel et al.'s research [25] showed unique splashing dynamics when droplets impact various target cross-sectional geometry; thus, drop splashing could be controlled by optimizing target geometry features. Tatiana's work [26] investigated droplet impact on a porous substrate and found no obvious splashing experimentally. In our case, the inlet velocity, wettability, and geometric difference were considered as three main factors leading to our splashing phenomenon.
Figure 7(a) showed the simulation result of splashing in the filter plate using previous γ-H2AX protocol experiment conditions. The lower rectangular region was modeled using the actual size of the filter plate well. The upper horizontal lines represented the space between wells. The vertical lines represented the walls of the well. The black solid block above the center of the well represented the capillary. The inlet velocity was 1.4 m/s from the top surface of the capillary. The liquid was set with surface tension of 73 dyn and the contact angle between filter bottom and liquid was 30 deg. The walls of the well and the surface of the plate were considered as incomplete wetting and the contact angle was 90 deg. After being blown out from the capillary, the liquid steam in the capillary was likely to form droplets due to the surface tension. When the droplets hit the bottom of the filter plate, the compressed air pushed the droplets to the edge and the upper region along the wall of the filter plate. In the filter plate, the liquid remained in the filter plate region with no liquid on the surface of the well plate.
Fig. 7.

Numerical modeling of splashing phenomenon in (a) in the filter plate, the inlet velocity from the capillary (black solid block) was 1.4 m/s. The bottom of the well is a porous membrane filter. The contact angle between filter bottom and liquid was 30 deg. No splashing from the simulation matched the experimental observations; (b) in the V-shaped well plate, the inlet velocity was the same as that of (a). The wettability of the V-shaped well plate was set as a contact angle of 150 deg. Due to the differences of geometry and wettability, with the same inlet speed, liquid splashed in the V-shaped well plate; (c) The inlet velocity reduced from 1.4 m/s to 0.65 m/s and the same amount of liquid was collected from the capillary. Under this condition, no cell splashing occurred.
As a comparison, Fig. 7(b) was the simulation result of liquid splashing in the V-shaped well plate. The lower part of the figure was the V-shaped well with its actual dimensions. The upper part represented the shoulders between the well and the boundary of the computational region. The capillary was placed 5 mm above the center of the well. The inlet velocity was 1.4 m/s and the surface tension of the liquid was 73 dyn, which were the same as those used in the filter plate. The wettability of the V-shaped well plate was set as a contact angle of 150 deg. Consequently, Figs. 7(a) and 7(b) differed only in the geometry of the well and the wettability on the bottom of the well. As can be seen from Fig. 7(b), the liquid in the capillary formed droplets as it fell and they kept their bead shapes due to their poor wettability between the well and the liquid even after hitting the bottom. The high inlet velocity pushed the liquid toward the opening of the well along the wall, and most of the liquid was pushed out of the well onto the shoulder region. This simulated numerical result of splashing outside the well matched the physical phenomenon observed experimentally.
Different inlet velocity conditions ranging from 0.4 m/s to 1.4 m/s were simulated; as the inlet velocity decreased, percent of liquid splashed out of the well also decreased. As can be seen from Fig. 7(c), the V-shaped well plate collected the same amount of liquid from capillary without splashing when the inlet velocity changed to 0.65 m/s. The relationship between percent of liquid splashed out of the V-shaped well and inlet velocity was plotted in Fig. 8. Based on Fig. 8, using a speed of 1.4 m/s led to more than 80% of the liquid splashed, the percent splashed decreases linearly with the inlet velocity, and no splashing was expected at a speed of 0.65 m/s. Typical images in Fig. 8 showed the nonsplashing at low velocity (left image) and the splashing at high velocity (right image). With the guidance of this simulation result, the cell harvesting process was optimized and V-shaped well plate could be used to collect lymphocytes in the experiment successfully.
Fig. 8.

The relationship between percent of liquid splashed out of the V-shaped well and inlet velocity obtained from the numerical modeling. Typical image cases, no splashing at low velocity (left), and splashing at high velocity (right) are superposed for qualitative comparison. Dye is used to enhance the contrast, and in real process, the separation medium is colorless.
5.2. Dispensing During Liquid Handling Process.
In the liquid handling module, reagents were added by using eight bulk reagent dispensers or 96 cannulas. When the cells were transferred from V-shaped well plate to imaging plate, 96 cannula module was used to aspirate and dispense the liquid containing cells. The cells were more likely to be pushed to the edge of the well due to the spreading of droplet on the bottom surface and capillary force between the plate walls and the liquid. Uneven distribution of cells on the bottom of the imaging plate made counting cells significantly more difficult.
In the first stage of the experiment, uneven distribution of cells was observed when dispensing cells into the imaging plate. Optical microscopy of cell distribution at different positions in the imaging plate can be seen in Fig. 9: (a) at corners and edges of the well and (b) in the center of the well. The bright gray area was the wall of the well, and it was attached to the transparent thin film on the bottom of the imaging plate to prevent contamination. The black region was the region with transparent thin film and the bright dots within black area were nuclei of the cells. While Fig. 9(a) showed huge amount of cells clustered in the corner and along the edges of the imaging plate, Fig. 9(b) showed very few cells in the central area. It was obvious that cell distribution was uneven. The morphology of the cell distribution from Figs. 9(a) and 9(b) suggested that when cells were dispensed into the imaging plate, they were pushed from the center to the edges with the spreading of the liquid; the cells accumulated along the edge as the speed of the liquid slowed down near the edge.
Fig. 9.
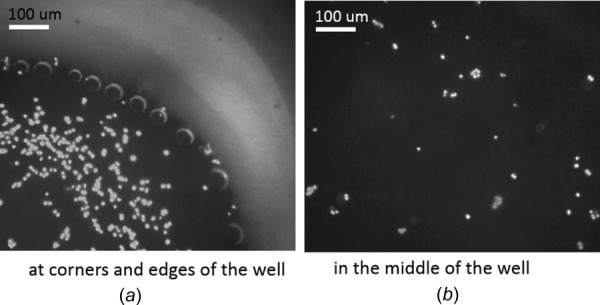
Optical microscopy of poor cell distribution at different positions in the imaging plate: (a) at corners and edges and (b) in the middle of the well. (a) Huge amount of cells gathered and created clusters at corners and along the edge. (b) Only a few of cells were in the middle area. The density of cells in the middle was much less than that at the corner and along the edge, which indicated the poor cell distribution.
The dispensing during liquid handling process was simulated to reduce trial and error attempts to save time and experiment materials. The model must be effective to capture the physical phenomenon under both poor conditions and optimized conditions.
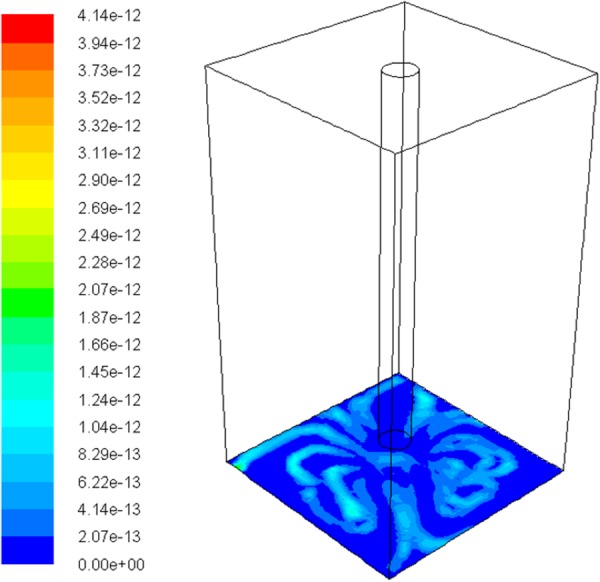
In Fig. 10, the volume was of the same size as the well of the imaging plate; the tubing in the middle represented one tip of the 96 cannula module. In order to observe the cell distribution, only the bottom surface of the well plate was shown in the figure. Cells were considered as sphere particles with diameter of 10 μm and density of 1.6 g/cm3. The injection position of cells was set at the nodes of the inlet surface (upper surface of cannula) and the cells were injected into the imaging plate with the dispensed liquid. The color contour showed the distribution of the cells on the bottom surface of imaging plate; the color bar represented the density of the cells at any location. It clearly showed that the cells gathered along the edges and much more cells were found near the edge than in the central area. This matched the experimental observation in Fig. 9.
Fig. 10.

Numerical modeling of poor cell distribution during liquid dispensing in the imaging plate. Cells were considered as sphere particles with diameter of 10 μm and density of 1.6 g/cm3. The dispensing speed is 0.05 m/s. The color contour showed the distribution of the cells on the bottom surface of imaging plate; the bar represented the density of the cells at any location. It clearly showed that the cells gathered along the edges and much more cells were found near the edge than in the central area.
By adjusting the dispensing velocity of the cannula, different patterns of cell distributions were found on the bottom of well plate. Figure 11 showed the cell distribution result with low dispensing speed. Much more evenly distributed cells were found under this condition: the cells located throughout the entire surface with little variation in cell density. With the guidance of the simulation results, experiment conditions were adjusted accordingly. Prepared using optimized conditions, Fig. 12 was the optical microscopy of cell distribution (a) at corners and edges of the well and (b) in the middle of the well. Compared with corresponding positions in Fig. 9, the corners and edges of the well still had plenty of cells in Fig. 12(a), but the density of cells was slightly lower and fewer clusters of cells were found. The major difference was in the central area, where Fig. 12(b) had evenly distributed cells with similar density to cells along the edge and corner. The numerical simulation results and experimental observations strongly indicated that the poor cell distribution was well captured by the model. Experiment conditions were optimized using the numerical simulation results and the cell distribution was significantly improved.
Fig. 11.
Numerical modeling of improved cell distribution during liquid dispensing in the imaging plate. The dispensing speed is 0.03 m/s. Much more evenly distributed cells were found under this condition: the cells located throughout the entire surface with little variation in cell density.
Fig. 12.

Optical microscopy of improved cell distribution at different positions in the imaging plate: (a) at corners and edges and (b) in the middle. (a) Plenty of cells were observed but the density of cells was slightly lower than that in Fig. 9(a); (b) evenly distributed cells were observed in the center with higher cell density than that in Fig. 9(b).
5.3. Cell Loss Due to Aspiration.
During the wash process in the liquid handling module, PBS solution was added and then aspirated from the well. Each tip of the 96 cannula module was put extremely close to the bottom of the imaging in order to aspirate as much liquid as possible. Although the cells were supposed to stay at the bottom of the well, if the aspiration speed is large enough, the cells at the bottom can be drawn to the cannula, leading to the loss of cells.
After using the optimized conditions for dispensing, adding, and aspirating PBS from the well, the central area of the well was examined by the optical microscopy. Compared with Fig. 12(b), the density of the cells in this region after aspiration was much lower than that right after dispensing, which indicated that cells were brought out with the aspirated PBS and disposed as waste liquid. The aspiration during the liquid handling was also simulated by using numerical model to reduce the trial and error needed in the experiment. The same geometry used as in the dispensing model was used here. However, additional initial conditions were required to simulate the PBS solution before aspiration; a liquid region with 3 mm depth was patched in the well and 1371 cells represented by spherical particles were evenly distributed on the bottom of the well plate. Figure 13(a) showed the cell loss under high aspiration speed. The particles were represented by the dots. In this case, the forces caused by viscosity and velocity gradient of the fluid were large enough to overcome the weight and fluid resistance of the cells, rendering the cells able to move with the fluid. Figure 13(a) was a snapshot at the end of the aspiration process (0.05 m/s): cells gathered in the central area and the aspiration speed was so high that cells escaped from the well through the cannula tip. As a comparison, Fig. 13(b) was a snapshot of the cell distribution at the end of a low-speed aspiration (0.03 m/s). In this case, the amount of aspirated liquid was the same as in Fig. 13(a), but there was no cell loss. The particles on the bottom of the well slightly changed their positions and moved closer to the central area, but they were not able to overcome their own weight and escape from the well. Thus, a successful aspiration was achieved under lower aspiration speeds. Figure 14 was constructed by tracking the number of escaped particles from the well during the aspiration process under various aspiration speeds. The figure indicated that between an aspiration speed from 0 m/s to 0.03 m/s, the percent of escaped cells rose from 0% to around 8%; when the aspiration speed reached 0.05 m/s, almost 93% of cells escaped from the well. Since the system is a high-throughput tool, high sample processing speed was expected and around 8% of cell loss was acceptable. Based on this criterion, the optimal aspiration speed was adjusted to 0.03 m/s in the experiment to reduce the possibility of cell loss.
Fig. 13.
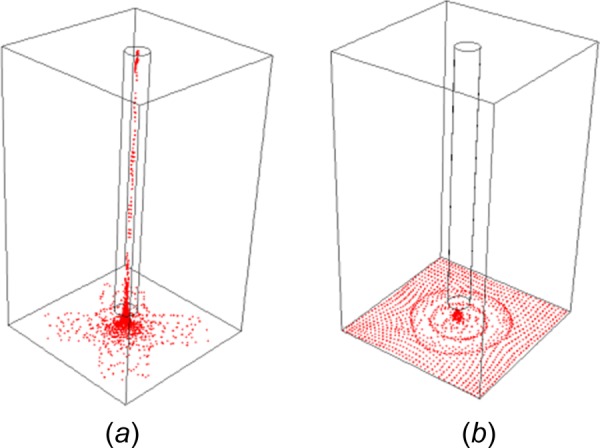
Numerical modeling of cell loss during liquid aspiration in the imaging plate with (a) high aspiration speed (0.05 m/s) and (b) low aspiration speed (0.03 m/s). The cells were modeled by 1371 spherical particles evenly distributed on the bottom of the well plate initially. The simulation used in (a) had an aspiration speed high enough that cells began to escape from the bottom of the well through the cannula tip. Model (b) used a lower aspiration speed. The particles on the bottom of the well slightly changed their positions and moved closer to the central area when the liquid was being aspirated, but they were not able to overcome their own gravity and escape from the well.
Fig. 14.

The relationship between the aspiration speed and the number of escaped cells in the numerical modeling. Typical images that show the cell loss at low (left) and high (right) aspiration speeds in the plate are superposed for qualitative comparison.
5.4. Confirming the Quality of RABiT Prepared Samples.
With the optimized experiment conditions (summarized in Table 1), problems of cell loss, cell clusters, and cell uneven distribution were significantly improved, resulting in the detectable micronuclei; however, the quality of the micronuclei samples prepared by the optimized RABiT protocol needed to match those prepared manually. To test the quality of the samples, blood from each donor was divided into two sample sets for RABiT and manual preparations. Both sets of samples were exposed to same radiation doses, prepared using the same reagents, and stained with a DNA-specific fluorescent dye DAPI before their binuclei and micronuclei were imaged and counted. The dose response curves in Fig. 15 were constructed based on the data from RABiT and manually prepared samples (Table 2).
Fig. 15.
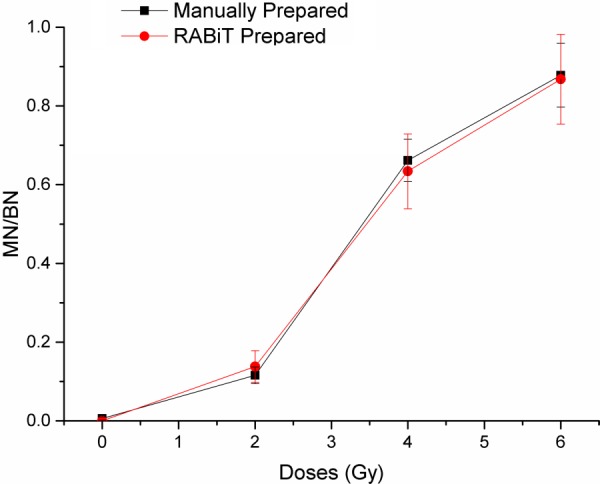
Chart of the detected level of micronuclei with increasing radiation by two prepared methods from the same donor with standard error bars. Both manually prepared samples and RABiT prepared samples show the same trend: the curves increase monotonically.
Table 2.
Results from scoring the cells
| Doses (Gy) | micronuclei/binuclei (manually prepared) | Standard error | micronuclei/binuclei (RABiT prepared) | Standard error |
|---|---|---|---|---|
| 0 | 0.0059 | 0.0041 | 0 | 0 |
| 2 | 0.11587 | 0.0209 | 0.138 | 0.04 |
| 4 | 0.6615 | 0.0536 | 0.634 | 0.095 |
| 6 | 0.878 | 0.081 | 0.868 | 0.1139 |
Both the RABiT and manually prepared samples showed a monotonic relationship with doses up to 6 Gy, and both sets of data closely matched. The ratio of micronuclei to binuclei leveled off when the doses were higher than 4 Gy, but this phenomenon was expected due to the dramatic effect on cell proliferation by high radiation doses—Karyokinesis does not occur in heavily damaged cells [27]. The data from both preparation method indicated that not only the samples had the same frequency of micronuclei in binuclei, but they also had the same quality to be imaged and counted readily.
6. Conclusion
Necessary well plate platforms were successfully integrated into RABiT, and fully automated micronuclei assay was made possible. Difficulties in adapting the well plates were overcome with adjustments derived from proper numerical models that account for inlet velocity, wettability, and geometric factors. The accurate numerical simulations not only captured the protocol's failures in the preexisting system but also offered appropriate extrapolations and solutions leading to optimized throughput and quality. The optimized parameters allowed for no cell splashing, good cell distributions, and minimal cells loss. Furthermore, comparison between RABiT and manually prepared samples showed the same trends and results. Successful models were constructed to fully realize a high throughput and reliable RABiT system.
Acknowledgment
This work was supported by Grant No. U19-AI067773 to the Center for High-Throughput Minimally Invasive Radiation Biodosimetry from the National Institute of Allergy and Infectious Diseases (NIAID).
Contributor Information
Dakai Bian, Department of Mechanical Engineering, , Columbia University, , New York, NY 10027 , e-mail: db2875@columbia.edu.
Jason C. Tsui, Department of Mechanical Engineering, , Columbia University, , New York, NY 10027
Mikhail Repin, Center for Radiological Research, , Columbia University Medical Center, , New York, NY 10032.
Guy Garty, Center for Radiological Research, , Columbia University Medical Center, , New York, NY 10032.
Helen Turner, Center for Radiological Research, , Columbia University Medical Center, , New York, NY 10032.
Y. Lawrence Yao, Department of Mechanical Engineering, , Columbia University, , New York, NY 10027
David J. Brenner, Center for Radiological Research, , Columbia University Medical Center, , New York, NY 10032
References
- [1]. Kachel, V. , Sindelar, G. , and Grimm, S. , 2006, “ High-Throughput Isolation of Ultra-Pure Plasmid DNA by a Robotic System,” BMC Biotechnol., 6(9). 10.1186/1472-6750-6-9 [DOI] [PMC free article] [PubMed] [Google Scholar]
- [2]. Meldrum, D. R. , Holl, M. R. , Fisher, C. H. , Saini, M. S. , McGuire, S. K. , Ren, T. T. H. , Pence, W. H. , Moody, S. E. , Cunningham, D. L. , Donaldson, D. A. , and Wiktor, P. J. , 2005, “ Sample Preparation in Glass Capillaries for High-Throughput Biochemical Analyses,” International Conference on Automation Science and Engineering, Edmonton, AB, Canada, pp. 7–12. [Google Scholar]
- [3]. Chen, Y. , Zhang, J. , Wang, H. , Garty, G. , Xu, Y. , Lyulko, O. V. , Turner, H. C. , Randers-Pehrson, G. , Simaan, N. , Yao, Y. L. , and Brenner, D. J. , 2010, “ Development of a Robotically-Based Automated Biodosimetry Tool for High-Throughput Radiological Triage,” Int. J. Biomechatronics Biomed. Rob., 1(2), pp. 115–125. 10.1504/IJBBR.2010.033029 [DOI] [Google Scholar]
- [4]. Garty, G. , Chen, Y. , Salerno, A. , Turner, H. , Zhang, J. , Lyulko, O. V. , Xu, Y. , Wang, H. , Simaan, N. , Randers-Pehrson, G. , Yao, Y. L. , Amundson, S. A. , and Brenner, D. J. , 2010, “ The RABIT: A Rapid Automated BIodosimetry Tool for Radiological Triage,” Health Phys., 98(2), pp. 209–217. 10.1097/HP.0b013e3181ab3cb6 [DOI] [PMC free article] [PubMed] [Google Scholar]
- [5]. Turner, H. C. , Brenner, D. J. , Chen, Y. , Bertucci, A. , Zhang, J. , Wang, H. , Lyulko, O. V. , Xu, Y. , Schaefer, J. , Simaan, N. , Randers-Pehrson, G. , Yao, Y. L. , and Garty, G. , 2011, “ Adaptation of the g-H2AX Assay for Automated Processing in Human Lymphocytes,” Radiat. Res., 175(3), pp. 282– 290. 10.1667/RR2125.1 [DOI] [PMC free article] [PubMed] [Google Scholar]
- [6]. Tamizh, S. G. , Chaudhury, N. K. , and Venkatachalam, P. , 2015, “ Comparison of Results of the Manual and Automated Scoring of Micronucleus Frequencies in Co-Irradiated Peripheral Blood Lymphocytes for Triage Dosimetry,” Appl. Radiat. Isot., 97, pp. 70–77. 10.1016/j.apradiso.2014.12.018 [DOI] [PubMed] [Google Scholar]
- [7]. Rodrigues, M. A. , Beaton-Green, L. A. , Kutzner, B. C. , and Wilkins, R. C. , 2014, “ Automated Analysis of the Cytokinesis-Block Micronucleus Assay for Radiation Biodosimetry Using Image Flow Cytometry,” Radiat. Environ. Biophys., 53(2), pp. 273–282. 10.1007/s00411-014-0525-x [DOI] [PubMed] [Google Scholar]
- [8]. Bussmann, M. , Chandra, S. , and Mostaghimi, J. , 2000, “ Modeling the Splash of a Droplet Impacting a Solid Surface,” Phys. Fluids, 12(12), p. 3121. 10.1063/1.1321258 [DOI] [Google Scholar]
- [9]. Liow, J. L. , 2001, “ Splash Formation by Spherical Drops,” J. Fluid Mech., 427, pp. 73–105. 10.1017/S0022112000002500 [DOI] [Google Scholar]
- [10]. Jens, T. , Klaus, L. , and Wolfgang, B. , 1997, “ Determination of the Surface Tension of Microporous Membranes Using Contact Angle Measurements,” J. Colloid Interface Sci., 194(2), pp. 281–286. 10.1006/jcis.1997.5087 [DOI] [PubMed] [Google Scholar]
- [11]. Kannan, R. , and Sivakumar, D. , 2008, “ Impact of Liquid Drops on a Rough Surface Comprising Microgrooves,” Exp. Fluids, 44(6), pp. 927–938. 10.1007/s00348-007-0451-7 [DOI] [Google Scholar]
- [12]. Shuai, M. , Rui, Y. , Jian, W. , and Hui, Z. , 2014, “ Simulation of Droplet Spreading on Porous Substrates Using Smoothed Particle Hydrodynamics,” Int. J. Heat Mass Transfer, 77, pp. 828–833. 10.1016/j.ijheatmasstransfer.2014.05.056 [DOI] [Google Scholar]
- [13]. Frank, X. , and Perre, P. , 2012, “ Droplet Spreading on a Porous Surface: A Lattice Boltzmann Study,” Phys. Fluids, 24(4), p. 042101. 10.1063/1.3701996 [DOI] [Google Scholar]
- [14]. Jens, E. , Marco, A. F. , Christophe, J. , and Stephane, Z. , 2010, “ Drop Dynamics After Impact on a Solid Wall: Theory and Simulations,” Phys. Fluids, 22(6), p. 062101. 10.1063/1.3432498 [DOI] [Google Scholar]
- [15]. Fenech, M. , 2007, “ Cytokinesis-block micronucleus cytome assay,” Nature Protocols, 2(5), pp. 1084–1104. 10.1038/nprot.2007.77 [DOI] [PubMed] [Google Scholar]
- [16]. Elin, S. , 2013, “ On Multiphase Flow Models in ANSYS CFD Software,” Master thesis, Chalmers University of Technology, Gothenburg, Sweden.
- [17]. Afkhami, S. , and Bussmann, M. , 2009, “ Height Functions for Applying Contact Angles to 3D VOF Simulations,” Int. J. Numer. Methods Fluids, 61(8), pp. 827–847. 10.1002/fld.1974 [DOI] [Google Scholar]
- [18]. Hirt, C. W. , and Nichols, B. D. , 1981, “ Volume of Fluid (VOF) Method for the Dynamics of Free Boundaries,” J. Comput. Phys., 39(1), pp. 201–225. 10.1016/0021-9991(81)90145-5 [DOI] [Google Scholar]
- [19]. Gopala, V. R. , and van Wachem, B. G. M. , 2008, “ Volume of Fluid Methods for Immiscible-Fluid and Free-Surface Flows,” Chem. Eng. J., 141(1–3), pp. 204–221. 10.1016/j.cej.2007.12.035 [DOI] [Google Scholar]
- [20]. Brackbill, J. U. , Kothe, D. B. , and Zemach, C. , 1992, “ A Continuum Method for Modeling Surface Tension,” J. Comput. Phys., 100(2), pp. 335–354. 10.1016/0021-9991(92)90240-Y [DOI] [Google Scholar]
- [21]. Ji, S.-M. , Xiao, F.-Q. , and Tan, D.-P. , 2010, “ Analytical Method for Softness Abrasive Flow Field Based on Discrete Phase model,” Sci. China Technol. Sci., 53(10), pp. 2867–2877. 10.1007/s11431-010-4046-9 [DOI] [Google Scholar]
- [22]. Gosman, A. D. , and Ioannides, E. , 1983, “ Aspects of Computer Simulation of Liquid-Fuelled Combustors,” J. Energy, 7(6), pp. 482–490. 10.2514/3.62687 [DOI] [Google Scholar]
- [23]. Cairo, J. M. , 2013, Mosby's Respiratory Care Equipment, 9th ed., Elsevier, Cambridge, MA. [Google Scholar]
- [24]. Cogoli, A. , 1991, “ Changes Observed in Lymphocyte Behavior During Gravitational Unloading,” ASGSB Bull., 4(2), pp. 107–115. [PubMed] [Google Scholar]
- [25]. Gabriel, J. , Thomai, G. , Zhang, Y. B. , Michael, L. S. , and Paulo, E. A. , 2012, “ Splash Control of Drop Impacts With Geometric Targets,” Phys. Rev., 85(2), p. 026319. 10.1103/PhysRevE.85.026319 [DOI] [PubMed] [Google Scholar]
- [26]. Tatiana, G. R. , 2014, “ Liquids on Porous Layers: Wetting, Imbibition and Transport Process,” Curr. Opin. Colloid Interface Sci., 19(4), pp. 320–335. 10.1016/j.cocis.2014.09.001 [DOI] [Google Scholar]
- [27]. Muller, W. U. , and Rode, A. , 2002, “ The Micronucleus Assay in Human Lymphocytes After High Radiation Doses (5-15 Gy),” Mutat. Res., 502(1–2), pp. 47–51. 10.1016/S0027-5107(02)00022-2 [DOI] [PubMed] [Google Scholar]