Abstract
In this work, we present a novel method for the derivation of the unloaded geometry of an abdominal aortic aneurysm (AAA) from a pressurized geometry in turn obtained by 3D reconstruction of computed tomography (CT) images. The approach was experimentally validated with an aneurysm phantom loaded with gauge pressures of 80, 120, and 140 mm Hg. The unloaded phantom geometries estimated from these pressurized states were compared to the actual unloaded phantom geometry, resulting in mean nodal surface distances of up to 3.9% of the maximum aneurysm diameter. An in-silico verification was also performed using a patient-specific AAA mesh, resulting in maximum nodal surface distances of 8 μm after running the algorithm for eight iterations. The methodology was then applied to 12 patient-specific AAA for which their corresponding unloaded geometries were generated in 5–8 iterations. The wall mechanics resulting from finite element analysis of the pressurized (CT image-based) and unloaded geometries were compared to quantify the relative importance of using an unloaded geometry for AAA biomechanics. The pressurized AAA models underestimate peak wall stress (quantified by the first principal stress component) on average by 15% compared to the unloaded AAA models. The validation and application of the method, readily compatible with any finite element solver, underscores the importance of generating the unloaded AAA volume mesh prior to using wall stress as a biomechanical marker for rupture risk assessment.
Keywords: blood vessel, AAA, patient-specific, unloaded geometry, FEA
1. Introduction
An abdominal aortic aneurysm (AAA) is a focal enlargement of the abdominal aorta, commonly developed below the renal arteries and above the aorto-iliac bifurcation. It is clinically defined as a segmental, full-thickness dilatation of the abdominal aorta 1.5 times greater than the normal diameter of the aorta, although an aneurysm diameter of 3.0 cm is commonly regarded as the threshold [1]. AAA is prevalent in 8.8% in the population above the age of 65 [2], and men are affected four times more often than women [3]. Rupture of aortic aneurysms is responsible for an estimated 15,000 deaths per year, and it is considered the 13th leading cause of death in the U.S. [4]. Aneurysms are mostly asymptomatic and can remain undiagnosed until they rupture. If an AAA is diagnosed during routine clinical examination, the clinicians assess the risk of rupture to the risk of surgical intervention and may recommend watchful surveillance if the aneurysm size is small. The most challenging aspect in the clinical management of this disease is the evaluation of the rupture risk of the aneurysm and making an informed decision on the need for surgical intervention based on this evaluation. Currently, a maximum diameter of 5.5 cm and an expansion rate of 1 cm/yr are used as the critical thresholds to recommend elective repair [5], though these quantitative guidelines differ among clinical centers.
The rationale for using the same critical maximum diameter for all AAA patients is debatable as clinical studies reveal that small aneurysms do rupture and large aneurysms can remain stable for years. Recent research has shown that assessing the rupture potential using patient-specific biomechanical parameters such as peak wall stress is a feasible and promising alternative [6–10]. However, for this method to be accepted as a clinical standard, it is necessary to have a framework for the accurate prediction of the biomechanical endpoints (i.e., stress and strain). The accuracy of this computational method is dependent on the accurate reconstruction of the arterial geometry, realistic boundary conditions, precise numerical methods, and physiologically relevant tissue material properties. Most previous studies have developed computational AAA geometries from patient-specific computed tomography (CT) images and calculated wall stress by finite element analysis (FEA) with a standard peak systolic pressure applied uniformly on the AAA sac. Nonetheless, as the aneurysm wall is subject to nonuniform fluid pressure, the strong interaction between the solid and fluid domains should be taken into account in the analysis [11,12]. Consequently, methods based on decoupled and fully coupled fluid–structural interaction (FSI) applied to patient-specific geometries [13–20] and development of anisotropic tissue material properties [21] have been proposed to advance the field of AAA rupture risk assessment.
Patient-specific computational models of the vasculature are typically reconstructed from multiple slices of medical images that are either acquired at one instant (gated) or multiple instants of the cardiac cycle. Therefore, the resulting reconstructed geometries correspond to a pressurized state of the blood vessel at an unknown intraluminal pressure. The application of an arbitrary pressure boundary condition on the endoluminal surface of these geometries compromises the accuracy of wall stress estimations. Ideally, the pressure boundary condition should be applied to the unloaded vascular geometry or the geometry corresponding to a zero internal pressure to obtain physiologically realistic stresses. Thus, we conjecture that the derivation of the patient-specific unloaded AAA geometry will increase the accuracy of the biomechanics-based approach for AAA rupture risk assessment.
When the unloaded AAA geometry is loaded with the diastolic blood pressure, the deformed AAA should match the AAA geometry reconstructed from CT images. This constraint implicitly defines the shape of the unloaded AAA geometry. A number of approaches have been proposed to solve this problem [22–28]. One alternative relies on inverse elastostatic methods. These methods were first introduced by Shield [29] for elastically homogeneous materials and zero body forces, and later generalized by Carlson [30] for elastic materials of any grade. Godvinjee and Mihalic [28] provided a more suitable finite element formulation of the method. Their improved formulation involved minor changes to elements designed for traditional FEA and can be applied to nearly incompressible materials. This formulation was used by Lu et al. [25] to estimate the unloaded AAA geometry. It is noted that the inverse method requires manipulations on the finite element matrices, which offers an important limitation when used with commercial finite element solvers. In addition, many of these approaches considered shell models of the AAA geometry [23,25], and all of them investigated only isotropic constitutive material formulations for the aneurysm wall. Only the work by Riveros et al. [27] accounts for both the anisotropic behavior of the arterial wall and the presence of intraluminal thrombus (ILT) when predicting the unloaded AAA geometry.
In the present work, we introduce a formal validation of the algorithm described by Riveros et al. [27] for estimating the unloaded AAA geometry from the initial, pressurized geometry obtained from diagnostic or follow-up CT images. The approach described herein is based on an iterative algorithm implemented on a commercial finite element solver capable of generating the unloaded solid meshes. We validate the approach using an aneurysm phantom of known constitutive material properties, which is subject to intraluminal loading at various pressures from which the unloaded geometry is estimated with the aforementioned algorithm. In addition, the algorithm is also validated with two patient-specific geometries subjected to intraluminal diastolic pressure from which the unloaded geometry is estimated. The algorithm is then applied to 12 exemplary patient-specific image-based AAA meshes to generate the individual unloaded AAA models.
2. Methods
2.1. Clinical Image Acquisition and 3D Reconstruction.
Twelve patient-specific abdominal aortic aneurysm (AAA) models were developed for this study, corresponding to unruptured aneurysms from patients treated at Allegheny General Hospital (AGH, Pittsburgh, PA). The term unruptured is used in the context that all the CT images were acquired following a standard protocol before the subjects underwent surgical or endovascular repair, or during the surveillance period after AAA diagnosis. The CT images acquired were gated to the end-diastolic phase of the cardiac cycle. The aforementioned protocol was approved by the Institutional Review Boards at University of Texas at San Antonio and AGH. The contrast enhanced CT images were obtained in a standard DICOM format with the following parameters: (i) image resolution = 512 × 512 pixels; (ii) average pixel size = 0.7693 mm (0.6172–0.9688 mm); (iii) pixel intensity = 0–2000; and (iv) average slice thickness = 3.0 mm.
The DICOM files of the CT images were imported in the ScanIP module of simpleware (Simpleware Ltd., Exeter, UK) for segmentation and further processing. A semi-automatic methodology was followed to segment and create the masks for the three domains (i.e., lumen, intra luminal thrombus (ILT), and AAA wall). The lumen was automatically segmented using an intensity-based threshold technique that differentiates blood from the surrounding tissues in the CT image [31–33]. The ILT was manually segmented, while a uniform AAA wall was developed by dilation of the lumen–ILT boundary by two pixels after performing a combination of Boolean operations on the masks. A two-pixel thickness results in a wall thickness of 1.54 mm, which is comparable to other AAA in vivo measurements that report median wall thickness measurements of 1.48 mm [34]. Once all the CT slices were segmented, the 3D geometry was reconstructed from the masks to generate the patient-specific model.
2.2. Finite Element Modeling for Patient-Specific AAA.
The wall and the ILT were meshed with solid tetrahedral elements (four nodes each). The meshing was performed in the ScanFE module in simpleware and later exported as an input (*.inp) file. An in-house conversion code written in C was used to convert this file into a Nastran file format (*.nas) and then imported into the adina solver (Adina R&D Inc., Watertown, MA) for FEA. Following the results of a mesh sensitivity study, the total number of tetrahedral elements used was within the range of 300 × 103 to 1.1 × 10⁶ elements to obtain accurate wall stresses within reasonable computational times [27]. The meshes were then subjected to an intraluminal pressure loading corresponding to the average physiological diastolic/systolic pressures, 80/120 mm Hg. Patient-specific systolic/diastolic cuff pressures at the time of the follow-up radiological imaging exam were available for two subjects: for AAA1, the cuff pressure was 154/74 mm Hg, while for AAA2 it was 144/90 mm Hg. The pressures were applied uniformly on the lumen–ILT and lumen–wall interfaces of the structural model. The node sets at the inlet of the model and at the outlet of the bifurcated common iliac arteries were fully constrained of any motion, i.e., all six degrees-of-freedom for translation and rotation were fixed. The materials for the AAA wall and the ILT were assumed to be nonlinear, isotropic, hyperelastic materials with densities of = 1.2 g/cm3 and = 1.1 g/cm3, respectively. As the AAA wall is known to be stiffer than the normal aortic wall and undergoes small deformation and strains [35,36], we used the finite strain constitutive material model described by Raghavan and Vorp [8] This is a two-parameter Mooney–Rivlin hyperelastic model developed from uniaxial tensile testing of tissue specimens obtained from 69 AAA patients. For the ILT material, we used the Mooney–Rivlin hyperelastic model proposed by Van de Geest et al. [21] This model is obtained from biaxial tensile testing of ILT specimens obtained from nine AAA patients. The strain energy functions (SEF) for these constitutive material models are given by Eq. (1) for the AAA wall and Eq. (2) for the ILT
| (1) |
| (2) |
where represents the first invariant of the modified left Cauchy–Green tensor, and , i = 1,2 are the Mooney–Rivlin coefficients obtained by fitting the experimental data reported in Refs. [8,21], and κ is the volumetric modulus. The coefficients for Eq. (1) are = 17.4 N/cm2 and = 188.1 N/cm2, and for Eq. (2) = 7.98 N/cm2 and = 8.71 N/cm2. A value of κ = 5 × 10⁵ N/cm2 was used in all computations. FEA simulations were performed with the solver adina on a Linux quad-core processor with 32 GB of RAM.
2.3. Unloaded Geometry Derivation Algorithm.
The algorithm allows a user to estimate the unloaded geometry of the AAA wall and ILT () and lumen () from a CT image-based geometry (). The underlying assumptions for the method are that corresponds to a pressurized state at some known intraluminal pressure and that there is an unloaded geometry, , which when loaded with the same unknown intraluminal pressure will yield within a reasonable margin of error. Based on these assumptions, we propose a two-step algorithm to estimate and , as described in Fig. 1. In the first step, an extrapolation scheme was designed to obtain the first approximation of the unloaded configuration (); in the second step, a fixed point iteration scheme was applied to perform iterative corrections on to obtain the final unloaded configuration ().
Fig. 1.
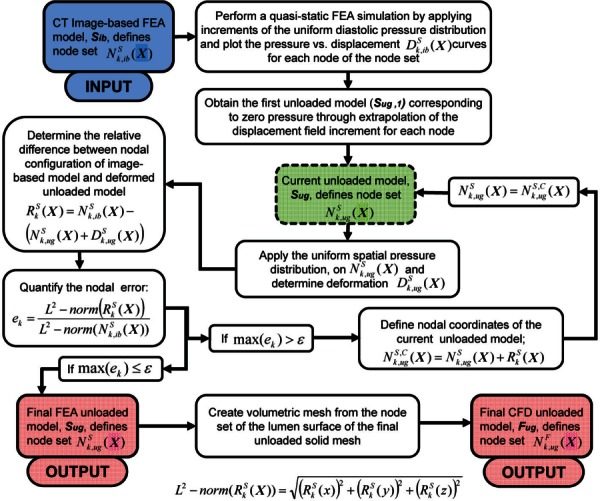
Flowchart of the proposed iterative algorithm to generate a predicted unloaded geometry of the solid domain (), i.e., AAA wall and ILT, and the fluid domain (), i.e., AAA lumen, from a CT image-based geometry ()
During radiological imaging, the CT images were gated to the end-diastolic phase of the cardiac cycle; therefore, the patient-specific CT image-based models () correspond to a pressurized state where the intraluminal pressure is the patient-specific diastolic pressure. The algorithm starts by recording the nodal configuration [] of the initial CT image-based FEA mesh of the solid domain. In the first stage of the algorithm, uniform pressure is applied on the endoluminal surface through increments starting from 0 to the diastolic pressure in a quasi-static FE simulation. From the FEA results, the displacement of each node of the solid mesh [] is obtained. The displacement components in the three Cartesian coordinates (, , and ) are recorded at each node for the last three pressure increments and fitted separately to quadratic curves to form three displacement–pressure plots (i.e., , , and plots). The displacement components corresponding to the unloaded configuration for each node are obtained by extrapolating the corresponding displacement–pressure plots to the zero pressure. Figure 2 shows the displacements of the last three increments for a random node in model AAA1. The displacements are extrapolated by second-order quadratic fitting (solid lines) and were found to be nonlinear. Linear extrapolation (dashed lines) is also shown for qualitative comparison with the quadratic fit. The calculated displacement components are then added to the initial spatial coordinates to obtain the first approximation of the nodal coordinates of the unloaded geometry (). In the second step, the is subject to corrections using a fixed point iteration scheme to reconstruct the final unloaded geometry. is first subjected to the same diastolic pressure distribution and boundary conditions. Nodal displacements [] are then recorded from the FEA simulation results. According to our assumptions, the nodal configuration of the deformed unloaded geometry [] should match the nodal configuration of the initial CT image-based geometry [] within a user specified tolerance. We characterized the mismatch between these two geometries by measuring the relative L2-norm error of the nodal positions.
Fig. 2.
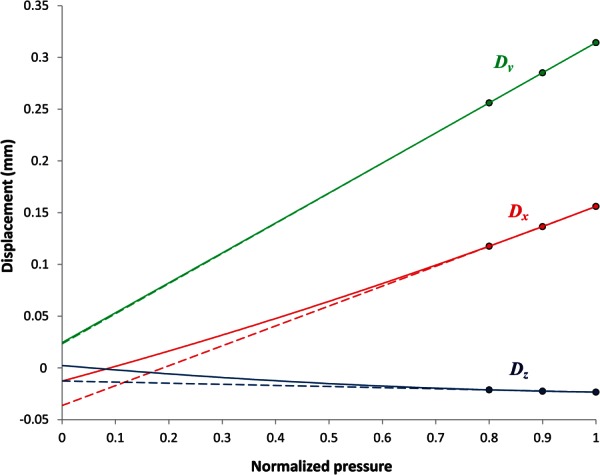
The displacements of a selected node in the principal directions, Dx, Dy, and Dz, are drawn against the pressure, which is normalized to the diastolic pressure. The displacements are extrapolated by second-order quadratic fitting (solid lines) and were found to be nonlinear in varying degrees. Linear extrapolation (dashed lines) is also shown for comparison.
The relative difference in nodal configurations [] between and was measured at each node as given by Eq. (3). The relative error () was characterized at the node by calculating the L2-norm error according to Eq. (4)
| (3) |
| (4) |
If the maximum nodal error is greater than a prescribed error tolerance, further FEA iterations were necessary to obtain the desired unloaded AAA geometry. Thus, the deformed is considered the current unloaded model , and the iterative process continues until the error at the last iteration is less than ε.
The proposed computational algorithm was applied on 12 patient-specific AAA meshes to obtain the respective solid unloaded geometries. We performed stress analysis with the CT image-based mesh and the reconstructed unloaded mesh with assumed standard systolic/diastolic pressures of 120/80 mm Hg and compared the stress/strain distributions. These results demonstrate the importance of utilizing unloaded geometries in the assessment of AAA wall mechanics. In addition, the impact of the patient-specific diastolic pressures (affecting the unloaded geometry) in the stress analysis is evaluated in two of the aneurysms (AAA1 and AAA2) for which this information was available.
2.4. Validation of the Algorithm.
The algorithm has been subjected to an in-silico verification protocol and an experimental validation protocol, which are described in Secs. 2.4.1 and 2.4.2, respectively.
2.4.1. In-Silico Verification of the Algorithm.
The algorithm was verified in-silico with a patient-specific AAA (model AAA12 in Table 1), as shown in Fig. 3. Using the known constitutive material properties (Eqs. (1) and (2)), the AAA was subject to intraluminal loading at a diastolic pressure of 80 mm Hg, and a deformed configuration was obtained. This deformed configuration was then assumed to be the image-based geometry, Sib, from which the unloaded geometry (original model geometry) is estimated with the aforementioned algorithm. The performance of the algorithm is quantified by measuring the maximum nodal distance between the original model geometry and the unloaded geometry, Sug, computed by the algorithm.
Table 1.
Maximum diameter and peak wall stress (PWS) in N/cm2 obtained with the CT image based, Sib, and unloaded, Sug, geometries for the 12 patient-specific AAA models (AAA1–AAA12). Also shown is the total number of iterations required by the algorithm to obtain the unloaded geometry.
| AAA model | Maximum diameter (mm) | PWS, Sib (N/cm2) | PWS, Sug (N/cm2) | Number of iterations |
|---|---|---|---|---|
| AAA1 | 51 | 46.0 | 67.0 | 6 |
| AAA2 | 50 | 37.0 | 44.0 | 6 |
| AAA3 | 47 | 9.1 | 11.3 | 6 |
| AAA4 | 51 | 25.0 | 28.0 | 8 |
| AAA5 | 47 | 29.0 | 30.0 | 7 |
| AAA6 | 50 | 23.0 | 27.0 | 6 |
| AAA7 | 50 | 25.0 | 31.0 | 7 |
| AAA8 | 46 | 17.0 | 18.5 | 5 |
| AAA9 | 47 | 25.0 | 35.0 | 7 |
| AAA10 | 48 | 19.0 | 20.0 | 5 |
| AAA11 | 47 | 32.0 | 39.0 | 6 |
| AAA12 | 54 | 21.0 | 21.0 | 5 |
Fig. 3.
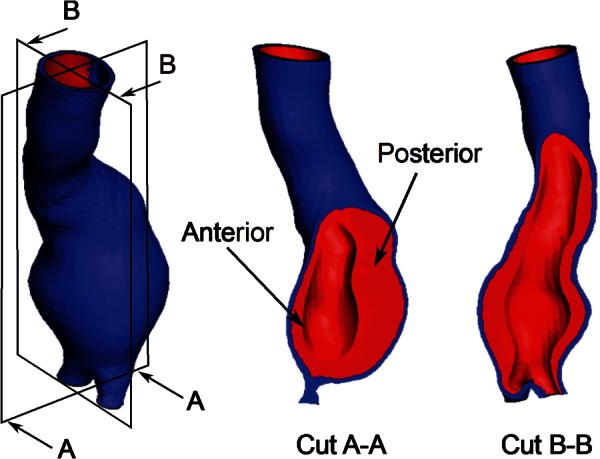
Model AAA12 used for the in-silico verification of the algorithm. Wall geometry and ILT distribution are shown.
2.4.2. Experimental Validation of the Algorithm.
A phantom representing an idealized AAA geometry (Fig. 4(a)) with a mean aneurysmal wall thickness of 1.365 mm and a maximum diameter of 4.7 cm was used for validating the algorithm. The phantom was developed using a silicone elastomer (Applied Silicone Corp., Santa Paula, CA) following the method described by Seong and colleagues [37]. The mechanical property of the silicone elastomer was characterized through planar biaxial tensile testing using a CellScale biotester (CellScale Biomaterials Testing, Waterloo, ON). The experimental data were best fitted to a Mooney–Rivlin constitutive equation, Eq. (5), with = 22.44 N/cm2 and = 0.431 N/cm2
Fig. 4.
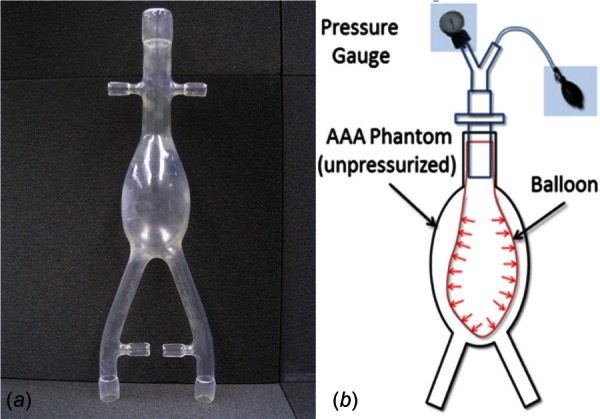
AAA phantom for the experimental validation: (a) phantom representing a 4.7 cm aneurysm and (b) schematic of pressure loading of the phantom for validation of the unloaded geometry algorithm
| (5) |
As shown in the schematic (Fig. 4(b)), a balloon was inserted into the phantom's sac and pressurized using a manual pump until the desired intraluminal pressure was achieved at the pressure gauge. The phantom was then imaged with a μCT scanner (Skyscan 1076 in vivo scanner, Bruker Corporation, MA) at the unloaded condition (0 mm Hg) and subsequently for three different loading conditions (80 mm Hg, 120 mm Hg, and 140 mm Hg gauge). Each scan resulted in approximately 3000 images with a pixel size of 35 μm and slice spacing of 35 μm, which were segmented with mimics (Materialise NV, Belgium). The pressure differences across the balloon wall were measured at 45, 49, and 52 mm Hg for the three loading conditions, respectively. ansys icem cfd (Ansys Inc., Canonsburg, PA) was used to mesh the phantom geometries with linear tetrahedral elements. The element size was optimized following a mesh sensitivity study with mesh sizes in the range of 31 × 103 to 5 × 10⁶ elements and a 120 mm Hg equivalent loading. Based on the quantification of mean wall displacement and its deviation from the most refined mesh, meshes in the range of 250 × 103 to 300 × 103 elements were considered optimal for validating the algorithm (see Fig. 5). The use of mean wall displacement as the metric for assessing mesh independency is justified by the fact that the unloaded geometry algorithm computes the surface to surface wall nodal distances.
Fig. 5.
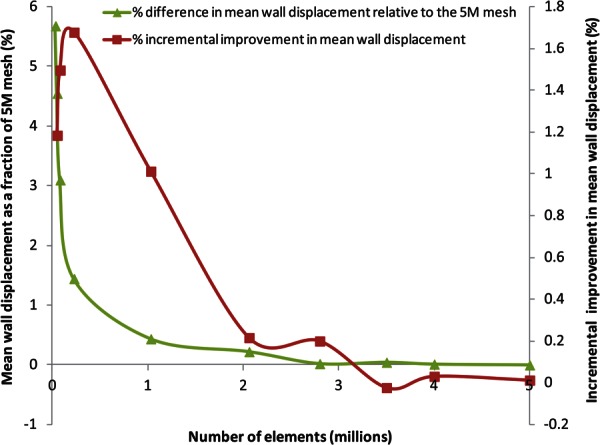
Mesh sensitivity study of the unloaded AAA phantom subject to 120 mm Hg equivalent loading. The mean wall displacement converged within 2% of the 5 × 10⁶ element mesh (5 M) with 150,000 volume elements. However, a mesh size in the range of 250,000–300,000 elements is preferred to execute the unloaded geometry algorithm, since the incremental improvement in mean wall displacement, which is measured as its percentage deviation by a mesh relative to the immediately finer mesh, is highest (1.7%) in this size range.
The pressurized phantom meshes were used with the unloaded geometry algorithm, which was coded in matlab, and the structural simulations were carried out using the finite element solver adina (Adina R&D Inc., Watertown, MA). For each of the meshes, the algorithm was executed until the iteration error tolerance (ε) was less than 0.1%. The inner wall surface of the predicted unloaded geometries () was then compared with the inner wall surface of the phantom at the actual unloaded condition (UG), qualitatively and quantitatively. The overlap of the wall surfaces was visualized using a part comparison feature in 3-matic (Materialise NV, Belgium). The Hausdorff distance (), which is the largest of the minimum distances from a node on UG to the surface, was calculated to quantify the mismatch. Area mean and root mean square (RMS) averages of this distance were also quantified. The corresponding FEA simulations were postprocessed using ensight (CEI Inc., Apex, NC).
3. Results
3.1. In-Silico Verification.
The algorithm was applied until the relative error () was less than 0.5%, which was equivalent to a difference in maximum nodal distance of 8 μm. Convergence to the zero-pressure geometry was achieved after five iterations. Figure 6 shows the maximum and average nodal distances with respect to the actual unloaded geometry for each iteration of the algorithm. Insets in Fig. 6 show the unloaded geometry estimated at iterations 0, 2, and 4. Noteworthy is that most of the corrections to the initial geometry occur during the first few iterations of the algorithm. In fact, for this verification, at the fifth iteration, the maximum nodal distance was already reduced to less than 40 μm. In addition, the iterative procedure was also found to be globally volume preserving. For this validation, the percentage difference between the volumes of the final unloaded geometry and the CT-based geometry was less than 0.02%.
Fig. 6.
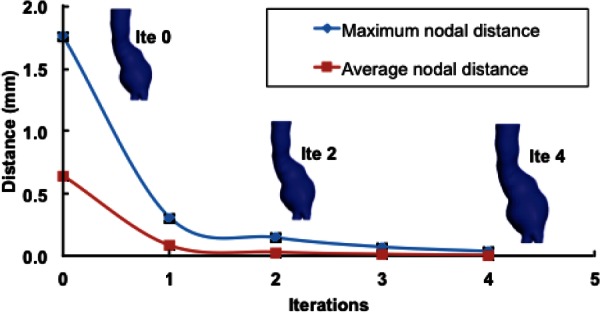
Convergence of the algorithm for the AAA12 model. Maximum and average nodal distances between the estimated and the actual unloaded geometries are depicted. The inset shows the unloaded geometry of the aneurysm at each iteration.
3.2. Experimental Validation.
The actual (UG) and predicted () AAA phantom geometries matched each other on visual inspection, but a quantitative comparison was performed to assess the degree of deviation of Sug relative to UG. As expected, the errors increase as the loading is increased. The maximum deviation () was 2.6% of the maximum aneurysm diameter when the loading was 80 mm Hg gauge and increased to 3.5% and 3.9% for 120 mm Hg and 140 mm Hg gauge, respectively. Table 2 reports on , the area mean (), and the RMS averages () of the surface to surface distance between UG and for the three loading conditions. A qualitative visualization of the surface to surface distances is illustrated in Fig. 7; the deviation is small throughout the AAA sac with the exception of the distal region of the anterior wall, indicated by the arrow in the figure.
Table 2.
The discrepancy between the actual unloaded geometry (UG) and the predicted unloaded geometry () is quantified in terms of surface to surface distances of the AAA phantom inner wall surface. The latter is estimated at three different intraluminal pressure gauge readings and the distances assessed by the following metrics: Hausdorff (), mean (), and average RMS () distances.
| Distance metric (mm) | 80 mm Hg | 120 mm Hg | 140 mm Hg |
|---|---|---|---|
| 1.223 | 1.634 | 1.847 | |
| relative to maximum diameter (%) | (2.6) | (3.5) | (3.9) |
| 0.380 | 0.642 | 0.764 | |
| 0.459 | 0.749 | 0.844 |
Fig. 7.
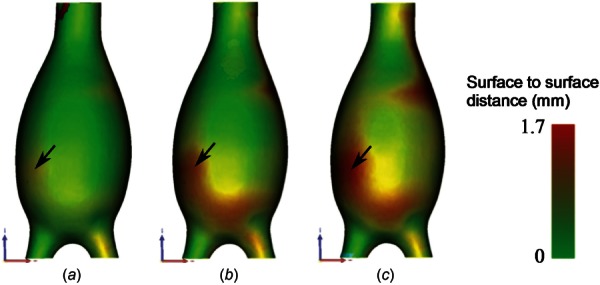
Qualitative visualization of the distance distribution between the predicted unloaded geometry () estimated from the three pressurized states (80 mm Hg (a), 120 mm Hg (b), and 140 mm Hg (c) gauge) and the actual unloaded geometry (UG). The maximum distance was obtained along the distal anterior wall for all three loading conditions (see black arrow), and it is evident that higher pressures lead to larger distances between the surfaces.
Figure 8 shows the distribution of the first principal stress for the predicted unloaded geometry (), the actual unloaded geometry (UG), and the μCT image-based geometry () based on their corresponding finite element models. The stresses are overpredicted by the and FE models, except for the 80 mm Hg condition and the FE model for which the maximum principal stress is underpredicted by a 5.3%. The distal anterior wall exhibited the peak stress for all models and at all loading conditions. The maximum first principal and Von Mises stresses are presented in Table 3, showing that the model leads to larger maximum principal stress with respect to the geometry. The same trend was observed between the model and the actual unloaded geometry, UG.
Fig. 8.
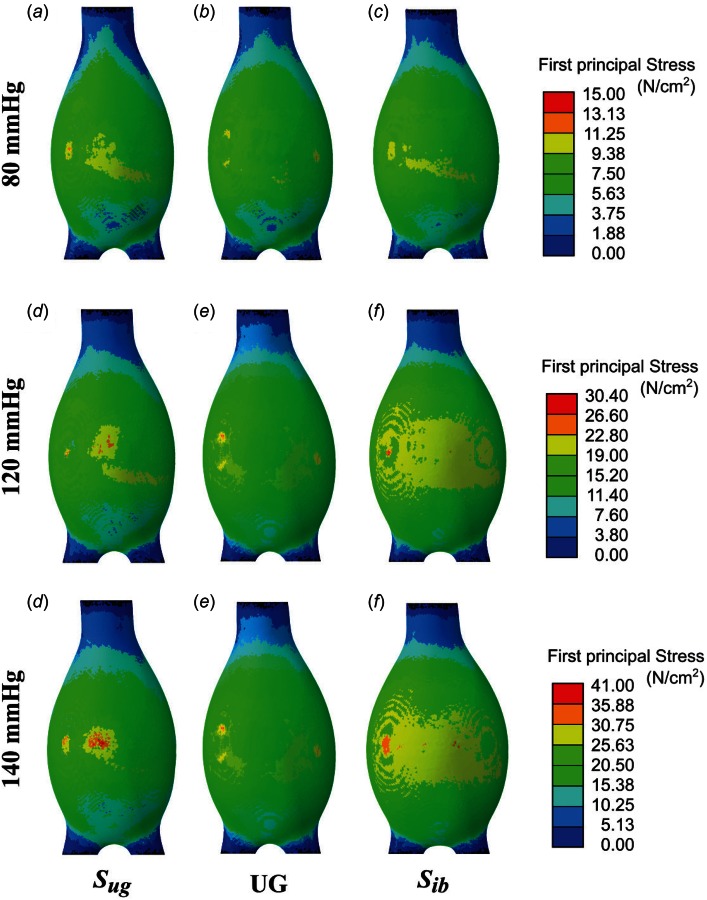
Comparison of the predicted unloaded geometry () ((a), (d), and (g)), the actual unloaded geometry (UG) ((b), (e), and (h)), and the μCT image-based geometry () ((c), (f), and (i)) of the AAA phantom based on the first principal stress distribution. The applied intraluminal pressure was equivalent to 80 mm Hg for (a)–(c); 120 mm Hg for (d)–(f); and 140 mm Hg gauge for (g)–(i).
Table 3.
Maximum first principal stress () and Von Mises stress () when the actual unloaded geometry (UG), the predicted unloaded geometry (), and the μCT image-based geometry () of the AAA phantom are loaded with intraluminal pressures of 80, 120, and 140 mm Hg gauge (percentage differences in parentheses are calculated based on the UG stresses)
| Gauge pressure (mm Hg) | AAA phantom geometry | (N/cm2) | (N/cm2) |
|---|---|---|---|
| 80 | UG | 13.2 | 10.3 |
| 14.3 (+8.3%) | 10.2 (−0.01%) | ||
| 12.5 (−5.3%) | 9.9 (−3.8%) | ||
| 120 | UG | 28.1 | 21.9 |
| 30.4 (+8.2%) | 21.8 (−0.01%) | ||
| 29.5 (+4.9%) | 21.9 (0.0) | ||
| 140 | UG | 36.4 | 28.4 |
| 41.3 (+13.5%) | 29.7 (+4.5%) | ||
| 36.9 (+1.4%) | 30.1 (+5.9%) |
3.3. Application of the Algorithm to Patient-Specific AAA.
The iterative algorithm was implemented with a series of FEA simulations performed in adina along with numerical iterations performed in matlab. This computational algorithm was successfully applied to the 12 patient-specific AAA cases (AAA1–AAA12) given in Table 1. The performance of the algorithm is demonstrated by the percentage relative error plots for three of the cases and the number of iterations needed to achieve the final unloaded geometries. The algorithm successfully converged in less than five iterations (less than ten iterations for the remaining models) for all three cases after which the final unloaded geometries were obtained. The errors [] obtained at the end of the iterations were normalized with respect to the final error and converted to percentage relative differences. Figure 9(a) shows the logarithmic plots of the percentage relative differences, and Fig. 9(b) shows an exemplary original CT image-based geometry and its corresponding unloaded geometry, for AAA1. The average CPU time for a single FEA simulation was 30 min on the quad-core Pentium processor, indicating the algorithm was computationally inexpensive.
Fig. 9.
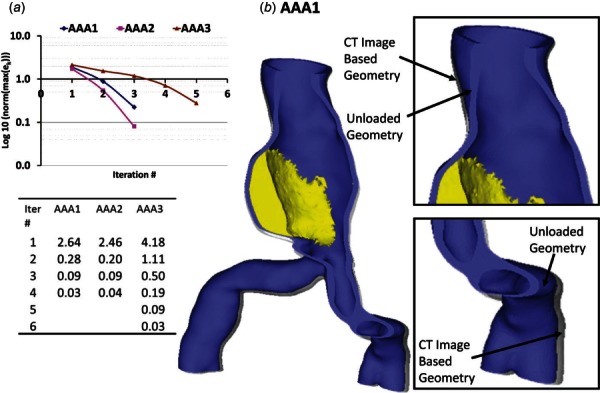
(a) Logarithmic representation and normalized relative L2-norm errors of the nodal distances between the CT image-based geometry () and the predicted diastolic geometry obtained with the unloaded geometry () when pressurized to the diastolic pressure, with the number of iterations as a measure of performance of the algorithm for the AAA1, AAA2, and AAA3 meshes. (b) of AAA1 with overlapping demonstrating the differences in the geometries.
The initial CT image-based and unloaded geometries for each patient-specific AAA were subjected to a systolic pressure of 120 mm Hg for stress analysis to study the effect of the unloaded geometry in the FE analysis. The computed peak wall stress (PWS) was 240 ± 47 kPa and 277 ± 70 kPa for the CT image-based geometry and the unloaded geometries, respectively (see Table 1). Figure 10 shows the maximum principal stress in the AAA wall obtained for both CT image-based geometry and unloaded geometries. As shown, using the initial CT image-based geometry underpredicts the maximum principal stress. In fact, a Kolgomorov–Smirnov two-side test shows this difference to be significant (p < 0.001). In general, these results demonstrate that the CT image-based geometries underestimate the peak wall stress.
Fig. 10.
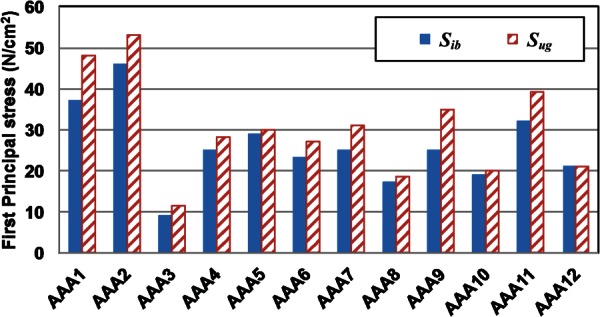
Predicted peak wall stress with the CT-based (solid blue bars) and the unloaded (striped red bars) geometries at their stress-free reference configurations
To complete the analysis, we evaluated the impact of using the patient-specific diastolic pressures to identify the unloaded geometry instead of the average diastolic pressure (80 mm Hg). The average systolic pressure was used in the FEA simulations. Models AAA1 and AAA2 were considered for this analysis, since the required clinical data were only available for these two AAA at the time of the follow-up imaging examination. Figure 11 shows the first principal stress distribution, obtained from the unloaded and imaged-based geometries, for both models with the average and patient-specific diastolic pressures. These results indicate that the location of the PWS for both geometries and sets of diastolic/systolic pressures remains the same whereas the actual stress differs, although slightly. Analyzing the spatial distributions of stress and strain can be concluded that the peak stresses and strains are seldom found at the same location. For AAA1, the peak stress and strain were observed at the same location along the right anterior wall. For AAA2, the peak stress and strain were found in two separate regions near the proximal aneurysm neck. The peak stress for the different combinations is presented in Table 4. To characterize the relative differences due to the use of the patient-specific diastolic pressures, we calculated the percentage difference of the maxima with respect to the average diastolic pressure of 80 mm Hg. The results in Table 4 demonstrate that the use of image-based models underestimates the peak stress, as also seen graphically in Fig. 10. In addition, as expected, the use of the patient-specific (cuff) pressure impacts the ensuing peak wall stress. This suggests that the PWS increases/decreases proportionally to the increase/decrease in diastolic pressure. Nevertheless, for the two cases considered in this study, a ± 10% variation in diastolic pressure causes a variation of less than ± 3% in the PWS.
Fig. 11.
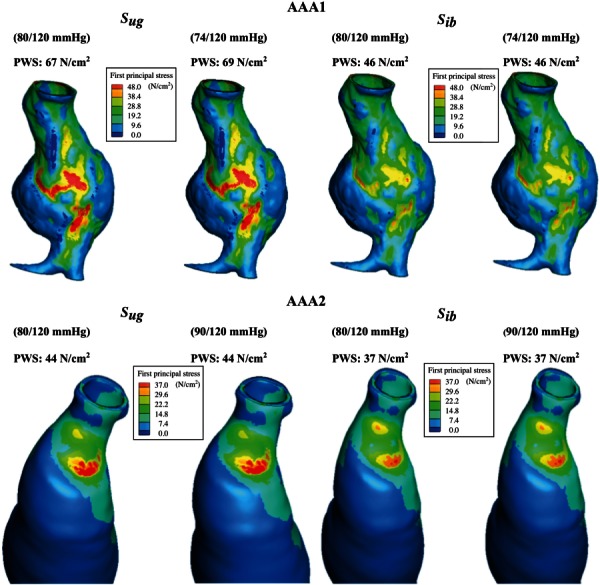
Views of the CT image-based () and unloaded () FE models for aneurysms AAA1 and AAA2 showing the distribution of first principal stress at the normal physiological systolic pressures. For the Sug cases, the unloaded geometries have been estimated with the patient-specific diastolic pressures and the normal physiological systolic pressure.
Table 4.
Peak wall stress (N/cm2) for two patient-specific AAA models exposed to patient-specific diastolic and average systolic pressures compared to average diastolic and systolic pressures. Stresses are shown for the initial CT image-based geometry () and the unloaded geometry (). The percentage differences are calculated with respect to the average diastolic pressure loading condition.
|
AAA1 PWS (N/cm2) |
AAA2 PWS (N/cm2) |
|||||
|---|---|---|---|---|---|---|
| At 120/80 mm Hg | At 120/74 mm Hg | Percentage difference | At 120/80 mm Hg | At 120/90 mm Hg | Percentage difference | |
| 46 | 46 | (0.0) | 37 | 37 | (0.0) | |
| 67 | 69 | (+2.9) | 44 | 43 | (−2.3) | |
4. Discussion
The importance of estimating the unloaded geometry of an AAA is indicated by a number of recent studies [22–27], and it is generally accepted that PWS estimations that use the CT-based geometries lead to errors in the interpretation of the true mechanical state of stress. In this work, we present an algorithm that can be used to estimate the unloaded or zero-pressure geometry of an AAA accounting for the presence of the ILT. An experimental validation of said algorithm with a bench-top vascular phantom of an idealized shape and an in-silico verification using a patient-specific AAA geometry are also presented. The importance of accounting for the unloaded geometry is demonstrated with a sample of 12 patient-specific AAA geometries. The method can be readily extended to obtain the unloaded geometry of any blood vessel subject to physiological loading conditions. Noteworthy is that if the geometry would be intended for a FSI simulation, the fluid domain can be easily obtained. In brief, when the final unloaded geometry for the solid domain is obtained, the luminal surface is created from the nodes at the lumen–wall/ILT interface of the solid mesh (). The luminal surface and fluid inlet and outlets are then converted to a volume and meshed with linear tetrahedral elements to obtain the unloaded AAA fluid geometry (). Hence, the methodology allows for generating multidomain meshes that include the AAA lumen, intraluminal thrombus (ILT), and the AAA wall, which can be used for subsequent FEA, computational fluid dynamics (CFD), or fluid–structure interaction (FSI) simulations.
Previous studies have reported different techniques for deriving an unloaded vascular geometry. A computational technique to estimate the zero-pressure geometry of an AAA from dynamic magnetic resonance images was presented by Marra et al. [22]. This method assumed a constant normalized displacement field, from which the nodal coordinates of the zero-pressure configuration corresponding to the diastolic pressure were determined. Raghavan et al. [23] describe a similar method to recover the zero-pressure configuration of an aneurysm reconstructed from gated CT images. The rationale for their protocol was that the shape change in the AAA is trivial, whereas the size change is nonlinear such that an iterative method can successfully approximate the zero-pressure geometry. The method was based on finding an optimized scaling factor used along the displacement vector and applied onto the surface nodes of the structural mesh to resize the geometry. They reported that the error in von Mises stress between the CT image-based model and the zero-pressure model is less than 3%, and thus, the conventional approach of using CT image-based model for stress analysis is justified. However, our results suggest that the variability in the relative difference in maximum stress obtained from the two configurations can be as high as 34% depending on the patient-specific AAA. The technique described in Ref. [23] works well for membrane type elements but is not suitable for 3D solid element types and also lacked the ability to incorporate intraluminal thrombus in the FE model. Lu and colleagues report on an advanced and theoretically sound method for recovering the zero-pressure geometry using an inverse elastostatic approach [24,25], following a technique proposed by Govindjee and Mihalic [28] This approach is considered superior to the previously reported methods in the literature, but requires modification of the FE solution scheme, and thus, integration with current commercially available solvers remains a challenge.
DePutter et al. [26] proposed a backward incremental (BI) method that accounted for the initial stress present in the diastolic geometry. The method was validated with idealized geometries and then applied to three patient-specific diastolic AAA geometries. Not including the initial stress and unloaded geometry leads to overestimation of AAA volume and an underestimation of wall curvature and wall stress. The BI method, however, was based on a neo-Hookean material model, and the differences between this model and other nonlinear hyperelastic material models such as those proposed by Raghavan and Vorp [8] and Rodriguez et al. [38] were not investigated. Recently, Speelman et al. [39] incorporated the initial stress estimation on the patient-specific AAA stress analysis and evaluated the contribution of the nonlinear constitutive wall material. Their study estimated an increase in 21% on the peak stress after inclusion of the initial stress, albeit in the absence of intraluminal thrombus. Another prestressing method based on a modified updated Lagrangian formulation was proposed by Gee et al. [40,41] where its applicability and accuracy were compared to the inverse design analysis method to calculate a stress-free reference configuration. Hsu and Bazilevs [42] also proposed an iterative procedure for obtaining a prestress model for vascular FSI simulations, where the solid model of the FSI formulation was modified to account for the tissue prestress by employing an additive decomposition of the second Piola–Kirchoff stress tensor. Their results suggest that the model without prestress tends to over inflate resulting in significant differences in the magnitude and spatial distribution of wall shear stress and wall tension.
The present method of generating an unloaded AAA geometry is highly reliable, having undergone a rigorous experimental validation. Our results on 12 patient-specific models indicate that maximum principal stresses from CT image-based geometries are underestimated by approximately 15% compared to their counterparts calculated from unloaded geometries. These results demonstrate that using CT image-based models for computational stress analysis will yield a significant underestimation of the maximum wall biomechanical parameters, and thus, the development of an unloaded geometry becomes necessary. Noteworthy is that PWS calculated using the identified unloaded geometry were found to be well below the range of failure stress reported in the literature. For example, Raghavan et al. [34] report a range of 33.6 to 235.1 N/cm2 with a median of 126.6 N/cm2 for ruptured and nonruptured aneurysms, while Di Martino et al. [43] report 82.0 ± 9.0 N/cm2 for electively repaired aneurysms. In addition, our results corroborate the need for using patient-specific diastolic/systolic pressures for the accurate estimation of the aneurysm wall mechanics. The computational cost of generating the unloaded geometry is low when using the matlab graphical user interface, where the running time was within 2 h on a standard desktop computer starting with the wall mesh to generate and perform the subsequent FEA simulations with the mesh. Our approach aims to address the limitations of previous methodologies with the objective of reconstructing a 3D volume mesh of an unloaded AAA multidomain geometry (wall, ILT, and lumen) using a commercial FE solver. With the application to 12 patient-specific AAA models, we demonstrated that the individual unloaded geometry can be reconstructed within a 0.5% numerical error in 5–8 iterations following the proposed algorithm. The methodology was implemented with the FEA solver adina, but can be easily transported to other FE solver as it does not involve changes in the FE solution schemes. In addition, the proposed approach can be applied to volume meshes with nonuniform wall thickness without further modification and extended to anisotropic hyperelastic material models [27].
The development of the algorithm is subject to important limitations. As the methodology reconstructs the model by updating the nodal coordinates of the structural mesh, the initial mesh quality plays a critical role in the quality of the final unloaded mesh. Therefore, for successful convergence, we recommend against using an excessively coarse mesh or a mesh with higher-order elements. Our study was conducted with linear tetrahedral elements, and the optimal mesh size was in the range of 300 × 103 to 1.1 × 10⁶ elements. However, the appropriate mesh size will depend on the size and shape irregularity of the AAA wall and ILT. The algorithm can also be improved in several ways. We have assumed that the CT images are obtained at the patient-specific diastolic cuff pressure, and a uniform pressure distribution is applied on the CT image-based endoluminal boundary. However, a nonuniform pressure distribution obtained from a FSI simulation with patient-specific inlet/outlet boundary conditions could be applied to the structural mesh to account for a more realistic boundary condition.
The experimental validation of the algorithm is subject to the following limitations. Results obtained with the phantom showed the same trend as the patient-specific AAA models. However, significant discrepancies between the first principal stress obtained with the actual unloaded geometry and the estimated unloaded geometry were found. A possible explanation for this discrepancy is warranted. While applying the intraluminal pressure loading to the AAA phantom with a balloon, only the aneurysm sac was subjected to the loading during the μCT scan, thus the region distal to the aorto-iliac bifurcation shows shrinkage in the model. On the contrary, the FE simulations assumed a uniform pressure distribution on the entire luminal surface of the phantom. Therefore, the discrepancies found with the experimental validation can be attributed to differences in the boundary conditions applied to the numerical model of the phantom. The unloaded phantom geometry was found to be insignificantly smaller, in volume, than the actual unloaded geometry, which is likely due to the nearly incompressible material model used for the FEA simulations in the iterative algorithm. In addition, there may be a slight discrepancy in the material properties of the silicone elastomer used for the AAA phantom and those that characterize the specimens used for planar biaxial tensile testing, since the production lots were different. Moreover, the AAA phantom could have hardened over time until it was used in the scanner, as hardening is common among elastomers.
In summary, we can conclude from the present work that it would be reasonable to infer that estimated unloaded vascular geometries will lead to more physiologically realistic finite element models based on their geometric similarity with the actual undeformed geometry and, therefore, will provide with a more accurate estimation of the AAA wall mechanics.
Acknowledgment
We acknowledge research funding from NIH Grant Nos. R21EB007651, R15HL087268, and R21EB008804, and the University of Texas System Board of Regents' Science and Technology Acquisition and Retention (STARS) program. We are also grateful to Dr. Barry Lieber and Dr. Jaehoon Seong for the construction of the aneurysm phantom, and to Dr. Hai-Chao Han for allowing access to his laboratory equipment to conduct the biaxial tensile tests of the silicone specimens.
Contributor Information
Santanu Chandra, Department of Biomedical Engineering, , University of Texas at San Antonio, , San Antonio, TX 78249.
Vimalatharmaiyah Gnanaruban, Department of Biomedical Engineering, , University of Texas at San Antonio, , San Antonio, TX 78249.
Fabian Riveros, Aragon Institute of Engineering Research, , Universidad de Zaragoza, , Zaragoza 50018, Spain.
Jose F. Rodriguez, Aragon Institute of Engineering Research, , Universidad de Zaragoza, , Zaragoza 50018, Spain; Department of Chemistry, Materials, and , Chemical Engineering “Giulio Natta,” , Politecnico di Milano, , Milano 20133, Italy
Ender A. Finol, Department of Mechanical Engineering, , University of Texas at San Antonio, , EB 3.04.23, , One UTSA Circle, , San Antonio, TX 78249 , e-mail: ender.finol@utsa.edu.
References
- [1]. Kent, K. C. , 2014, “ Abdominal Aortic Aneurysms,” N. Engl. J. Med., 371(22), pp. 2101–2108. 10.1056/NEJMcp1401430 [DOI] [PubMed] [Google Scholar]
- [2]. Newman, A. B. , Arnold, A. M. , Burke, G. L. , O'Leary, D. H. , and Manolio, T. A. , “ Cardiovascular Disease and Mortality in Older Adults With Small Abdominal Aortic Aneurysms Detected by Ultrasonography: The Cardiovascular Health Study,” Ann. Intern. Med., 134(3), pp. 182–190. 10.7326/0003-4819-134-3-200102060-00008 [DOI] [PubMed] [Google Scholar]
- [3]. Karkos, C. , Mukhopadhyay, U. , Papakostas, I. , Ghosh, J. , Thomson, G. , and Hughes, R. , 2000, “ Abdominal Aortic Aneurysm: The Role of Clinical Examination and Opportunistic Detection,” Eur. J. Vasc. Endovasc. Surg., 19(3), pp. 299–303. 10.1053/ejvs.1999.1002 [DOI] [PubMed] [Google Scholar]
- [4]. Brown, L. C. , and Powell, J. T. , 1999, “ Risk Factors for Aneurysm Rupture in Patients Kept Under Ultrasound Surveillance, UK Small Aneurysm Trial Participants,” Ann. Surg., 230(3), pp. 289–296; discussion 296–297. 10.1097/00000658-199909000-00002 [DOI] [PMC free article] [PubMed] [Google Scholar]
- [5]. Limet, R. , Sakalihassan, N. , and Albert, A. , 1991, “ Determination of the Expansion Rate and Incidence of Rupture of Abdominal Aortic Aneurysms,” J. Vasc. Surg., 14(4), pp. 540–548. 10.1016/0741-5214(91)90249-T [DOI] [PubMed] [Google Scholar]
- [6]. Fillinger, M. F. , Raghavan, M. L. , Marra, S. P. , Cronenwett, J. L. , and Kennedy, F. E. , 2002, “ In Vivo Analysis of Mechanical Wall Stress and Abdominal Aortic Aneurysm Rupture Risk,” J. Vasc. Surg., 36(3), pp. 589–597. 10.1067/mva.2002.125478 [DOI] [PubMed] [Google Scholar]
- [7]. Fillinger, M. F. , Marra, S. P. , Raghavan, M. L. , and Kennedy, F. E. , 2003, “ Prediction of Rupture Risk in Abdominal Aortic Aneurysm During Observation: Wall Stress Versus Diameter,” J. Vasc. Surg., 37(4), pp. 724–732. 10.1067/mva.2003.213 [DOI] [PubMed] [Google Scholar]
- [8]. Raghavan, M. L. , and Vorp, D. A. , 2000, “ Toward a Biomechanical Tool to Evaluate Rupture Potential of Abdominal Aortic Aneurysm: Identification of a Finite Strain Constitutive Model and Evaluation of Its Applicability,” J. Biomech., 33(4), pp. 475–482. 10.1016/S0021-9290(99)00201-8 [DOI] [PubMed] [Google Scholar]
- [9]. Thubrikar, M. J. , Al-Soudi, J. , and Robicsek, F. , 2001, “ Wall Stress Studies of Abdominal Aortic Aneurysm in a Clinical Model,” Ann. Vasc. Surg., 15(3), pp. 355–366. 10.1007/s100160010080 [DOI] [PubMed] [Google Scholar]
- [10]. Truijers, M. , Pol, J. A. , Schultzekool, L. J. , van Sterkenburg, S. M. , Fillinger, M. F. , and Blankensteijn, J. D. , 2007, “ Wall Stress Analysis in Small Asymptomatic, Symptomatic and Ruptured Abdominal Aortic Aneurysms,” Eur. J. Vasc. Endovasc. Surg., 33(4), pp. 401–407. 10.1016/j.ejvs.2006.10.009 [DOI] [PubMed] [Google Scholar]
- [11]. Di Martino, E. S. , Guadagni, G. , Fumero, A. , Ballerini, G. , Spirito, R. , Biglioli, P. , and Redaelli, A. , 2001, “ Fluid-Structure Interaction Within Realistic Three-Dimensional Models of the Aneurysmatic Aorta as a Guidance to Assess the Risk of Rupture of the Aneurysm,” Med. Eng. Phys., 23(9), pp. 647–655. 10.1016/S1350-4533(01)00093-5 [DOI] [PubMed] [Google Scholar]
- [12]. Finol, E. A. , and Amon, C. H. , 2002, “ Flow-Induced Wall Shear Stress in Abdominal Aortic Aneurysms: Part II—Pulsatile Flow Hemodynamics,” Comput. Methods Biomech. Biomed. Eng., 5(4), pp. 319–328. 10.1080/1025584021000009751 [DOI] [PubMed] [Google Scholar]
- [13]. Figueroa, A. , Vignon-Clementel, I. , Jansen, K. , Hughes, T. J. R. , and Taylor, C. A. , 2005, “ Simulation of Blood Flow and Vessel Deformation in Three-Dimensional, Patient-Specific Models of the Cardiovascular System Using a Novel Method for Fluid-Solid Interactions,” Fluid Structure Interaction and Moving Boundary Problems: No. 3, Chakrabarti S., Hernandez S., and Brebbia C. A., eds., WIT Press, Ashurst, UK, pp. 143–152.http://www.witpress.com/elibrary/wit-transactions-on-engineering-sciences/84/15721 [Google Scholar]
- [14]. Wolters, B. J. , Rutten, M. C. , Schurink, G. W. , Kose, U. , de Hart, J. , and van de Vosse, F. N. , 2005, “ A Patient-Specific Computational Model of Fluid-Structure Interaction in Abdominal Aortic Aneurysms,” Med. Eng. Phys., 27(10), pp. 871–883. 10.1016/j.medengphy.2005.06.008 [DOI] [PubMed] [Google Scholar]
- [15]. Leung, J. H. , Wright, A. R. , Cheshire, N. , Crane, J. , Thom, S. A. , Hughes, A. D. , and Xu, X. Y. , 2006, “ Fluid Structure Interaction of Patient Specific Abdominal Aortic Aneurysms: A Comparison With Solid Stress Models,” Biomed. Eng. Online, 5, p. 33. 10.1186/1475-925X-5-33 [DOI] [PMC free article] [PubMed] [Google Scholar]
- [16]. Papaharilaou, Y. , Ekaterinaris, J. A. , Manousaki, E. , and Katsamouris, A. N. , 2007, “ A Decoupled Fluid Structure Approach for Estimating Wall Stress in Abdominal Aortic Aneurysms,” J. Biomech., 40(2), pp. 367–377. 10.1016/j.jbiomech.2005.12.013 [DOI] [PubMed] [Google Scholar]
- [17]. Bluestein, D. , Dumont, K. , De Beule, M. , Ricotta, J. , Impellizzeri, P. , Verhegghe, B. , and Verdonck, P. , 2009, “ Intraluminal Thrombus and Risk of Rupture in Patient Specific Abdominal Aortic Aneurysm—FSI Modelling,” Comput. Methods Biomech. Biomed. Eng., 12(1), pp. 73–81. 10.1080/10255840802176396 [DOI] [PubMed] [Google Scholar]
- [18]. Rissland, P. , Alemu, Y. , Einav, S. , Ricotta, J. , and Bluestein, D. , 2009, “ Abdominal Aortic Aneurysm Risk of Rupture: Patient-Specific FSI Simulations Using Anisotropic Model,” ASME J. Biomech. Eng., 131(3), p. 031001. 10.1115/1.3005200 [DOI] [PubMed] [Google Scholar]
- [19]. Scotti, C. M. , Jimenez, J. , Muluk, S. C. , and Finol, E. A. , 2008, “ Wall Stress and Flow Dynamics in Abdominal Aortic Aneurysms: Finite Element Analysis vs. Fluid-Structure Interaction,” Comput. Methods Biomech. Biomed. Eng., 11(3), pp. 301–322. 10.1080/10255840701827412 [DOI] [PubMed] [Google Scholar]
- [20]. Chandra, S. C. , Raut, S. S. , Jana, A. , Biederman, R. W. , Doyle, M. , Muluk, S. C. , and Finol, E. A. , 2013, “ Fluid Structure Interaction Modeling of Abdominal Aortic Aneurysms: The Impact of Patient Specific Inflow Conditions and Fluid/Solid Coupling,” ASME J. Biomech. Eng., 135(8), p. 081001. 10.1115/1.4024275 [DOI] [PMC free article] [PubMed] [Google Scholar]
- [21]. Vande Geest, J. P. , Sacks, M. S. , and Vorp, D. A. , 2006, “ A Planar Biaxial Constitutive Relation for the Luminal Layer of Intra-Luminal Thrombus in Abdominal Aortic Aneurysms,” J. Biomech., 39(13), pp. 2347–2354. 10.1016/j.jbiomech.2006.05.011 [DOI] [PubMed] [Google Scholar]
- [22]. Marra, S. P. , Raghavan, M. L. , Whittaker, D. R. , Fillinger, M. F. , Chen, D. T. , Dwyer, J. M. , Tsapakos, M. J. , and Kennedy, F. E. , 2005, “ Estimation of the Zero-Pressure Geometry of Abdominal Aortic Aneurysms From Dynamic Magnetic Resonance Imaging,” 2005 Summer Bioengineering Conference, Vail, CO, June 22–26, American Society of Mechanical Engineers, Abstract 298571. [Google Scholar]
- [23]. Raghavan, M. L. , Ma, B. , and Fillinger, M. F. , 2006, “ Non-Invasive Determination of Zero-Pressure Geometry of Arterial Aneurysms,” Ann. Biomed. Eng., 34(9), pp. 1414–1419. 10.1007/s10439-006-9115-7 [DOI] [PubMed] [Google Scholar]
- [24]. Lu, J. , Zhou, X. , and Raghavan, M. L. , 2008, “ Inverse Method of Stress Analysis for Cerebral Aneurysms,” Biomech. Model. Mechanobiol., 7(6), pp. 477–486. 10.1007/s10237-007-0110-1 [DOI] [PubMed] [Google Scholar]
- [25]. Lu, J. , Zhou, X. , and Raghavan, M. L. , 2007, “ Inverse Elastostatic Stress Analysis in Pre-Deformed Biological Structures: Demonstration Using Abdominal Aortic Aneurysms,” J. Biomech., 40(3), pp. 693–696. 10.1016/j.jbiomech.2006.01.015 [DOI] [PubMed] [Google Scholar]
- [26]. de Putter, S. , Wolters, B. J. , Rutten, M. C. , Breeuwer, M. , Gerritsen, F. A. , and van de Vosse, F. N. , 2007, “ Patient-Specific Initial Wall Stress in Abdominal Aortic Aneurysms With a Backward Incremental Method,” J. Biomech., 40(5), pp. 1081–1090. 10.1016/j.jbiomech.2006.04.019 [DOI] [PubMed] [Google Scholar]
- [27]. Riveros, F. , Chandra, S. C. , Finol, E. A. , Gasser, T. C. , and Rodriguez, J. F. , 2013, “ A Pull-Back Algorithm to Determine the Unloaded Vascular Geometry in Anisotropic Hyperelastic AAA Passive Mechanics,” Ann. Biomed. Eng., 41(4), pp. 694–708. 10.1007/s10439-012-0712-3 [DOI] [PubMed] [Google Scholar]
- [28]. Govindjee, S. , and Mihalic, P. A. , 1996, “ Computational Methods for Inverse Finite Elastostatics,” Comput. Methods Appl. Mech. Eng., 136(1–2), pp. 47–57. 10.1016/0045-7825(96)01045-6 [DOI] [Google Scholar]
- [29]. Shield, R. T. , 1967, “ Inverse Deformation Results in Finite Elasticity,” Z. Angew. Math. Phys., 18(4), pp. 490–500. 10.1007/BF01601719 [DOI] [Google Scholar]
- [30]. Carlson, D. E. , 1969, “ Inverse Deformation Results for Elastic Materials,” Z. Angew. Math. Phys., 20(2), pp. 261–263. 10.1007/BF01595564 [DOI] [Google Scholar]
- [31]. Shum, J. , Di Martino, E. S. , Goldhammer, A. , Goldman, D. , Acker, L. , Patel, G. , Ng, J. H. , Martufi, G. , and Finol, E. A. , 2010, “ Semi-Automatic Vessel Wall Detection and Quantification of Wall Thickness in Computed Tomography Images of Human Abdominal Aortic Aneurysms,” Med. Phys., 37(2), pp. 638–648. 10.1118/1.3284976 [DOI] [PubMed] [Google Scholar]
- [32]. Shum, J. , Martufi, G. , Di Martino, E. S. , Washington, C. B. , Grisafi, J. , Muluk, S. C. , and Finol, E. A. , 2011, “ Quantitative Assessment of Abdominal Aortic Aneurysm Geometry,” Ann. Biomed. Eng., 39(1), pp. 277–286. 10.1007/s10439-010-0175-3 [DOI] [PMC free article] [PubMed] [Google Scholar]
- [33]. Shum, J. , Xu, A. , Chatnuntawech, I. , and Finol, E. A. , 2011, “ A Framework for the Automatic Generation of Surface Topologies for Abdominal Aortic Aneurysm Models,” Ann. Biomed. Eng., 39(1), pp. 249–259. 10.1007/s10439-010-0165-5 [DOI] [PMC free article] [PubMed] [Google Scholar]
- [34]. Raghavan, M. L. , Kratzberg, J. , Castro de Tolosa, E. M. , Hanaoka, M. M. , Walker, P. , and da Silva, E. S. , 2006, “ Regional Distribution of Wall Thickness and Failure Properties of Human Abdominal Aortic Aneurysm,” J. Biomech., 39(16), pp. 3010–3016. 10.1016/j.jbiomech.2005.10.021 [DOI] [PubMed] [Google Scholar]
- [35]. Bihari, P. , Shelke, A. , New, T. H. , Mularczyk, M. , Nelson, K. , Schmandra, T. , Knez, P. , and Schmitz-Rixen, T. , 2013, “ Strain Measurement of Abdominal Aortic Aneurysm With Real-Time 3D Ultrasound Speckle Tracking,” Eur. J. Vasc. Endovasc. Surg., 45(4), pp. 315–323. 10.1016/j.ejvs.2013.01.004 [DOI] [PubMed] [Google Scholar]
- [36]. Goergen, C. J. , Azuma, J. , Barr, K. N. , Magdefessel, L. , Kallop, D. Y. , Gogineni, A. , Grewall, A. , Weimer, R. M. , Connolly, A. J. , Dalman, R. L. , Taylor, C. A. , Tsao, P. S. , and Greve, J. M. , 2011, “ Influences of Aortic Motion and Curvature on Vessel Expansion in Murine Experimental Aneurysms,” Arterioscler. Thromb. Vasc. Biol., 31(2), pp. 270–279. 10.1161/ATVBAHA.110.216481 [DOI] [PMC free article] [PubMed] [Google Scholar]
- [37]. Seong, J. , Sadasivan, C. , Onizuka, M. , Gounis, M. J. , Christian, F. , Miskolczi, L. , Wakhloo, A. K. , and Lieber, B. B. , 2005, “ Morphology of Elastase-Induced Cerebral Aneurysm Model in Rabbit and Rapid Prototyping of Elastomeric Transparent Replicas,” Biorheology, 42(5), pp. 345–361.http://content.iospress.com/articles/biorheology/bir370 [PubMed] [Google Scholar]
- [38]. Rodriguez, J. F. , Ruiz, C. , Doblare, M. , and Holzapfel, G. A. , 2008, “ Mechanical Stress in Abdominal Aortic Aneurysms: Influence of Diameter, Asymmetry, and Material Anisotropy,” ASME J. Biomech. Eng., 130(2), p. 021023. 10.1115/1.2898830 [DOI] [PubMed] [Google Scholar]
- [39]. Speelman, L. , Bosboom, E. M. , Schurink, G. W. , Buth, J. , Breeuwer, M. , Jacobs, M. J. , and van de Vosse, F. N. , 2009, “ Initial Stress and Nonlinear Material Behavior in Patient-Specific AAA Wall Stress Analysis,” J. Biomech., 42(11), pp. 1713–1719. 10.1016/j.jbiomech.2009.04.020 [DOI] [PubMed] [Google Scholar]
- [40]. Gee, M. W. , Reeps, C. , Eckstein, H. H. , and Wall, W. A. , 2009, “ Prestressing in Finite Deformation Abdominal Aortic Aneurysm Simulation,” J. Biomech., 42(11), pp. 1732–1739. 10.1016/j.jbiomech.2009.04.016 [DOI] [PubMed] [Google Scholar]
- [41]. Gee, M. W. , Forster, C. , and Wall, W. A. , 2010, “ A Computational Strategy for Prestressing Patient-Specific Biomechanical Problems Under Finite Deformation,” Int. J. Numer. Methods Biomed. Eng., 26(1), pp. 52–72. 10.1002/cnm.1236 [DOI] [Google Scholar]
- [42]. Hsu, M. C. , and Bazilevs, Y. , 2011, “ Blood Vessel Tissue Prestress Modeling for Vascular Fluid-Structure Interaction Simulation,” Finite Elem. Anal. Des., 47(6), pp. 593–599. 10.1016/j.finel.2010.12.015 [DOI] [Google Scholar]
- [43]. DiMartino, E. S. , Bohra, A. , VandeGeest, J. P. , Gupta, N. Y. , Makaroun, M. S. , and Vorp, D. A. , 2006, “ Biomechanical Properties of Ruptured Versus Electively Repaired Abdominal Aortic Aneurysm Wall Tissue,” J. Vasc. Surg., 43(3), pp. 570–576. 10.1016/j.jvs.2005.10.072 [DOI] [PubMed] [Google Scholar]


