

Abstract
Objectives
To evaluate the prevalence and determinants of anxiety and depression and to assess their impact on glycaemic control in participants with type 2 diabetes mellitus.
Design
A cross-sectional study.
Setting
Community-based investigation in Xuzhou, China.
Participants
893 Chinese men and women aged 18–84 years who fulfilled the inclusion criteria.
Methods
People with type 2 diabetes completed the Pittsburgh Sleep Quality Index and the Zung Self-Rating Anxiety and Depression Scales. Demographic and physiological characteristics were recorded. Multiple logistic regression was used to evaluate the combined effect of factors associated with anxiety and depression and to assess the effects of anxiety and depression on glycaemic control.
Results
The prevalence of depressive symptoms and anxiety symptoms was 56.1% and 43.6%, respectively. Multivariate logistic regression analysis indicated that anxiety symptoms were associated with being woman, low income, chronic disease, depressive symptoms and poor sleep quality. Depressive symptoms were associated with being woman, older age, low education level, being single, diabetes complications, anxiety symptoms and poor sleep quality. Glycaemic control was not related to anxiety symptoms (OR=1.31, 95% CIs 0.94 to 1.67) or depressive symptoms (OR=1.23, 95% CI 0.85 to 1.63). A combination of depressive symptoms and anxiety symptoms was associated with poor glycaemic control (relative excess risk due to interaction: 4.93, 95% CI 2.09 to 7.87; attributable proportion due to interaction: 0.27, 95% CI 0.12 to 0.45).
Conclusions
There was a high prevalence of depressive and anxiety symptoms in this Chinese sample of participants, although depression and anxiety were not singly associated with glycaemic control. However, a combination of depressive and anxiety symptoms was negatively correlated with glycaemic control in participants with type 2 diabetes.
Keywords: DIABETES & ENDOCRINOLOGY
Strengths and limitations of this study.
To describe the prevalence and determinants of anxiety and depression, and to explore the effect of anxiety and depression on glycaemic control in Xuzhou, China.
Neither anxiety nor depression is singly linked with poorer glycaemic control.
A strength of the study is the use of a community-based design and random sampling.
A limitation of the study is the cross-sectional design.
Introduction
Type 2 diabetes mellitus (T2DM) is a group of metabolic diseases that pose a serious challenge to governments and to society. T2DM leads to decreased quality of life, increasing care costs and a reduction in life expectancy. Approximately 592 million people worldwide will suffer from diabetes mellitus by 2035.1 According to one national survey,2 3 the prevalence of diabetes in China has increased from 0.9% in 1980 to 11.6% in 2010. More than 1 in 10 people in China have diabetes, and there are >100 million adults with the disease, a figure higher than in any other country.4
Diabetes is associated with an increased risk of psychological disorders; depression and anxiety are two of the most common comorbidities. Epidemiological evidence suggests that at least one-third of people with diabetes suffer from clinically relevant depressive disorders.5 People with diabetes are twice as likely to be diagnosed with anxiety and depression than those without diabetes.6 7 Research shows that gender, age, education, diabetes complications and poor glycaemic control are related to anxiety and depression in people with T2DM.6–10 Comorbid depression and anxiety are associated with negative health outcomes, such as increased diabetes-related complications,8 increased physical morbidity,11 higher blood glucose levels,6 7 poorer quality of life12–15 and premature death, compared with depression or anxiety alone.16
Chinese people are particularly susceptible to T2DM because of physiological, cultural and societal factors.4 However, little research has been conducted in tertiary hospitals or hospitals in Chinese metropolitan cities on the prevalence of, and factors related to, depressive and anxiety symptoms in patients with T2DM, or on how these symptoms affect glycaemic control.9 17–19 An additional problem is that any such research may not be representative of people with T2DM in the community.
Our study aimed to assess the prevalence of, and the factors related to, depressive and anxiety symptoms in participants with T2DM, and to assess the effects (singly and in combination) of depressive and anxiety symptoms on glycaemic control.
Materials and methods
Study design and recruitment criteria
The sampling method of this cross-sectional study has been described previously.20 Briefly, participants with T2DM who were registered at 37 community clinics and who met the criteria of the Chinese Type 2 Diabetes Prevention and Control 2010 Guidelines21 were selected using multistage cluster sampling. Participants who were diagnosed with T2DM by physicians at least 6 months prior using baseline clinical information and laboratory data were recruited in our study. Exclusion criteria were as follows: (1) type 1 diabetes; (2) painful diabetic sensory neuropathology; (3) diagnosed sleep disorders prior to diabetes; (4) mental illness or use of any kind of psychotropic medication; (5) working in nights shifts in the last 3 months or travelling across time zones within 1 month; (6) other endocrine disorders, such as thyroid disease or chronic use of glucocorticoids; (7) age <18 years and (8) pregnancy or lactation.
We aimed to select a minimum of 690 patients, assuming a 25% estimation prevalence of anxiety and depression in patients with T2DM16 with 90% power, a significance level of 0.05 (a two-sided type I error of 5%), a design effect of 2.5 and allowing for a dropout rate of 20%. The study was conducted between August and December 2013.
A total of 963 eligible patients with T2DM aged 25–92 years were invited to participate in the study. Among them, 42 dropped out because of work, 15 declined to take part in the study and 13 failed to complete the questionnaire. The response rate was 91.7%. Overall, 893 people with T2DM participated in the study.
Written informed consent was obtained from all participants. The study protocol was approved by Xuzhou Center for Disease Control and Prevention. The procedures followed were in accordance with the standards of the ethics committee of Xuzhou Center for Disease Control and Prevention and with the Declaration of Helsinki (1975, revised 2000).
Assessment of depressive and anxiety symptoms
Depressive and anxiety symptoms were assessed using the Zung Self-Rating Depression Scale and the Zung Self-Rating Anxiety Scale, respectively.22 23 All the symptoms were reported by patients .Each of these scales comprises 20 items scored on a frequency scale of 1, rarely; 2, some of the time; 3, very often/often; 4, almost/always. The total score for the 20 questions was multiplied by 1.25, with the integer score as a standard score. A standard score below 50 was considered to indicate absence of depressive and anxiety symptoms. These scales are valid and reliable instruments for use with Chinese samples.24 25
Assessment of glycaemic control
All fasting venous blood samples were drawn between 08:00 and 09:00. HbA1c level was assayed using high-performance liquid chromatography (Bio-Rad Diagnostic Group, California, USA) and was used as the index for glycaemic control. A level of HbA1c <7.0% (54 mmol/mol) was defined as good glycaemic control based on the Chinese Type 2 Diabetes Prevention and Control 2010 Guidelines; a level of HbA1c ≥7.0% was considered poor glycaemic control.21
Assessment of other variables
Age, sex, marital status, physical activities, net household income, level of education, cigarette smoking, alcohol consumption, years since diabetes diagnosis, number of comorbidities, number of diabetic complications and insulin use were assessed using a standardised questionnaire. The number of diabetic complications was determined by participants' reports of diagnosed coronary artery disease, peripheral vascular disease, stroke, nephropathy, retinopathy or neuropathy. Body height (to the nearest 0.1 cm) and weight (to the nearest 0.1 kg) in light indoor clothing were measured. Body mass index (kg/m2) was calculated, and categorised as underweight (<18.5 kg/m2), normal weight (18.5–23.9 kg/m2) and overweight/obese (≥24.0 kg/m2).26
Sleep quality was assessed with the Pittsburgh Sleep Quality Index (PSQI).27 Previous research with Chinese participants indicates that PSQI scores of <7 and ≥7 can be defined as ‘good sleep quality’ and ‘poor sleep quality’, respectively, and that the scale has a diagnostic sensitivity of 98.3% and specificity of 90.2% in differentiating between people with sleep quality problems and those without.28
Statistical analysis
All statistical analyses were performed using SPSS V.16.0 (SPSS, Chicago, USA). Continuous variables were expressed as mean±SD. Categorical variables were expressed as absolute values and percentages. Differences in continuous variables were tested using the F test or the t-test, and differences in categorical variables were assessed using the Pearson χ2 test. Logistic regression analysis was used to evaluate depressive and anxiety symptoms, singly or combination, in relation to glycaemic control, adjusted for age (continuous), sex (male or female), educational level (lower than high school, high school or greater), marital status, physical activities (yes or no), net household income (continuous), cigarette smoking (yes or no), alcohol consumption (yes or no), years since diabetes diagnosis (continuous), comorbidities (yes or no), diabetic complications (yes or no), poor sleep quality (yes or no) and insulin use (yes or no). ORs and 95% CIs were calculated. Variance was calculated using the Taylor series linearisation method, which leads to an asymptotically unbiased estimate. The minimum statistical significance level for all analyses was p<0.05.
To estimate the interaction between depressive symptoms and anxiety symptoms, we created three new variables: (1) anxiety symptoms score <50=no and depressive symptoms=yes versus other confounders; (2) anxiety symptoms score ≥50=yes and depressive symptoms=no versus other confounders; and (3) anxiety symptoms score ≥50=yes and depressive symptoms=yes versus other confounders.29 30
The relative excess risk due to interaction (RERI), the attributable proportion due to interaction (AP) and the synergy index (S) were used to estimate biological interactions.30 The RERI is the excess risk attributed to interaction relative to the risk without exposure. AP refers to the attributable proportion of disease caused by interaction in participants with both exposures. S is the excess risk from both exposures when there is a biological interaction relative to the risk from both exposures without interaction. In the absence of additive interactions, RERI and AP are equal to 0.31 The current study refined the criteria as either a statistically significant RERI >0 or S >1, AP >0 to indicate biological interactions.
Results
General characteristics of participants
The mean age of participants was 63.9±10.2 years, and 58.6% were women. The mean age of non-respondents was 64.5±10.3 years, and 58.9% were women. There were no significant age or sex differences between participants and non-respondents (p>0.05). Table 1 shows the general characteristics of participants.
Table 1.
Distribution of general characteristics of the participants
| Anxiety |
Depression |
||||||
|---|---|---|---|---|---|---|---|
| Variables | All (n=893) | Yes (501) | No (392) | p Value | Yes (389) | No (504) | p Value |
| Sex (female) | 523 (58.6) | 336 (67.1) | 187 (47.7) | <0.01 | 313 (80.5) | 210 (41.7) | <0.01 |
| Age (years) | 63.9±10.2 | 65.1±10.3 | 62.3±9.9 | <0.01 | 65.4±10.1 | 62.7±10.4 | <0.01 |
| Above high school | 82 (9.2) | 35 (7.0) | 47 (11.6) | <0.05 | 17 (4.4) | 65 (12.9) | <0.01 |
| No spouse | 136 (15.2) | 62 (12.4) | 74 (18.9) | <0.01 | 84 (21.6) | 52 (10.3) | <0.01 |
| Regular exercise | 684 (76.6) | 393 (78.4) | 291 (74.2) | >0.05 | 281 (72.2) | 403 (80.0) | <0.01 |
| Income above population average (%) | 220 (24.6) | 106 (21.2) | 114 (29.1) | <0.01 | 71 (18.3) | 149 (29.6) | 0.21 |
| BMI, mean (SD) | 23.9±2.7 | 24.2±2.9 | 23.1±2.6 | <0.01 | 24.4±3.0 | 23.3±2.7 | <0.01 |
| Disease duration in years, median (SD) | 5.6±5.1 | 6.4±5.2 | 4.7±4.2 | <0.01 | 6.1±5.1 | 5.2±4.8 | 0.006 |
| Comorbidities | 326 (36.5) | 201 (40.1) | 125 (31.8) | <0.05 | 165 (42.4) | 161 (31.9) | <0.01 |
| Complications | 232 (26.0) | 147 (29.3) | 85 (21.7) | <0.01 | 135 (34.7) | 97 (19.2) | <0.01 |
| Smokers | 133 (14.9) | 87 (17.4) | 46 (11.7) | <0.05 | 71 (18.3) | 62 (12.3) | <0.05 |
| Drinkers | 112 (12.5) | 72 (14.4) | 40 (10.2) | >0.05 | 37 (9.5) | 75 (14.9) | 0.03 |
| Depression | 389 (43.6) | 342 (68.3) | 47 (11.98) | <0.01 | – | – | – |
| Anxiety | 501 (56.1) | – | – | – | 342 (87.9) | 47 (9.3) | <0.01 |
| PSQI ≥7 | 305 (34.2) | 236 (47.1) | 69 (17.6) | <0.01 | 216 (55.5) | 89 (17.7) | <0.01 |
| Using insulin | 117 (13.1) | 69 (13.8) | 48 (12.2) | 0.11 | 51 (13.1) | 66 (13.1) | 0.42 |
‘Comorbidities’ refers to diseases accompanying diabetes and ‘Complications’ refers to diseases caused by diabetes. All figures are n (%) unless otherwise indicated.
BMI, body mass index; PSQI, Pittsburgh Sleep Quality Index.
Prevalence and factors associated with depressive and anxiety symptoms
Of the 893 participants, 56.1% (501) had anxiety symptoms and 43.6% (389) had depressive symptoms (table 1). Table 2 shows factors related to depressive and anxiety symptoms among participants with T2DM. Participants who were women, with lower income, chronic disease, depression and poor sleep quality were more likely to show anxiety symptoms. Participants who were women, older, single, with a low educational level, more diabetes complications, anxiety symptoms and poor sleep quality were more likely to show depressive symptoms.
Table 2.
Results of logistic regression analysis showing risk factors associated with anxiety and depression symptoms in patients with diabetes
| Variable | β | SE | Wald | p Value | OR | 95% CI |
|---|---|---|---|---|---|---|
| Anxiety | ||||||
| Female | 0.523 | 0.208 | 6.31 | 0.01 | 1.687 | 1.122 to 2.538 |
| Income above population average | −0.562 | 0.255 | 4.87 | 0.03 | 0.570 | 0.346 to 0.939 |
| Long disease duration | 0.759 | 0.259 | 8.62 | 0.00 | 2.136 | 1.287 to 3.546 |
| Depression | 1.113 | 0.215 | 26.88 | 0.00 | 3.044 | 1.999 to 4.637 |
| Poor sleep quality | 0.523 | 0.182 | 8.46 | 0 | 1.687 | 1.186 to 2.401 |
| Age | 0.186 | 0.114 | 2.73 | 0.10 | 1.188 | 0.969 to 1.472 |
| No spouse | 0.145 | 0.113 | 1.62 | 0.20 | 1.153 | 0.933 to 1.442 |
| Above high school | −0.089 | 0.172 | 0.271 | 0.60 | 0.914 | 0.653 to 1.281 |
| Regular exercise | −0.021 | 0.083 | 0.09 | 0.77 | 0.983 | 0.834 to 1.153 |
| BMI | 0.330 | 0.462 | 0.51 | 0.47 | 1.391 | 0.562 to 3.443 |
| Smoking | 0.368 | 0.250 | 2.16 | 0.14 | 1.444 | 0.884 to 2.359 |
| Drinking | 0.207 | 0.242 | 0.73 | 0.39 | 1.230 | 0.765 to 1.978 |
| Comorbidities | 0.124 | 0.173 | 0.52 | 0.47 | 1.133 | 0.880 to 1.588 |
| Complications | 0.850 | 0.543 | 2.44 | 0.12 | 2.339 | 0.816 to 6.785 |
| Using insulin | 0.007 | 0.076 | 0.01 | 0.93 | 1.007 | 0.867 to 1.168 |
| Depression | ||||||
| Female | 0.523 | 0.18 | 8.46 | 0 | 1.687 | 1.186 to 2.401 |
| Age (year) | 0.64 | 0.276 | 5.37 | 0.02 | 1.896 | 1.104 to 3.257 |
| Primary school and illiteracy | 0.999 | 0.479 | 4.36 | 0.04 | 2.717 | 1.063 to 6.940 |
| No spouse | 0.503 | 0.254 | 3.92 | 0.05 | 1.654 | 1.005 to 2.721 |
| Complications | 0.574 | 0.159 | 13.08 | 0 | 1.775 | 1.301 to 2.423 |
| Anxiety | 1.285 | 0.164 | 61.3 | 0 | 3.616 | 2.621 to 4.988 |
| Poor sleep quality | 0.929 | 0.285 | 10.65 | 0 | 2.532 | 1.449 to 4.424 |
| Income above population average | −0.378 | 0.237 | 2.54 | 0.11 | 0.685 | 0.431 to 1.091 |
| Regular exercise | −0.415 | 0.227 | 3.26 | 0.07 | 0.661 | 0.423 to 1.031 |
| BMI | 0.066 | 0.198 | 1.09 | 0.74 | 1.068 | 0.724 to 1.575 |
| Long disease duration | 0.259 | 0.213 | 1.48 | 0.22 | 1.296 | 0.854 to 1.967 |
| Smoking | 0.049 | 0.062 | 0.64 | 0.42 | 1.051 | 0.931 to 1.186 |
| Drinking | −0.210 | 0.239 | 0.77 | 0.38 | 0.811 | 0.508 to 1.294 |
| Comorbidities | 0.793 | 0.613 | 1.670 | 0.19 | 2.210 | 0.664 to 7.354 |
| Using insulin | 0.084 | 0.228 | 0.135 | 0.71 | 1.087 | 0.696 to 1.699 |
BMI, body mass index.
Impact of depressive and anxiety symptoms on glycaemic control
Table 3 shows the general characteristics of glycaemic control. The rate of good glycaemic control was 23.9% (213/893). The rates were 19.8% (99/501) and 29.1% (114/392) in participants with and without anxiety symptoms, respectively (χ2=10.52, p<0.01), with an OR of 1.42 (95% CI 1.07 to 1.85, p=0.012) after adjustment for age, sex, educational level, marital status, physical activities, net household income, cigarette smoking, alcohol consumption, poor sleep quality, depressive symptoms, years since diabetes diagnosis, comorbidities, diabetic complications and insulin use. The rates of good glycaemic control were 19.3% (75/389) and 27.4% (138/504) in participants with and without depressive symptoms, respectively (χ2=7.93, p<0.01), with an OR of 1.41 (95% CI 1.02 to 1.67, p=0.036) after adjustment for age, sex, educational level, marital status, physical activities, net household income, cigarette smoking, alcohol consumption, poor sleep quality, anxiety symptoms, years since diabetes diagnosis, comorbidities, diabetic complications and insulin use. For the combination of depressive symptoms and anxiety symptoms, the rate of good glycaemic control was 29.9% (103/345) in patients with neither depressive symptoms nor anxiety symptoms, 22.0% (35/159) in those with anxiety symptoms only (χ2=3.37, p>0.05), 23.4% (11/47) in those with depressive symptoms only (χ2=0.83, p>0.05) and 18.7% (64/342) in those with depressive symptoms and anxiety symptoms (χ2=11.59, p<0.01; figure 1).
Table 3.
General characteristics of glycaemic control in participants
| Glycated haemoglobin |
||||
|---|---|---|---|---|
| Variables | All (n=893) | <7.0% (n=213) | ≥7.0% (n=680) | p Value |
| Sex (female) | 523 (58.6) | 112 (52.6) | 411 (60.4) | 0.003 |
| Age (SD) | 63.9±10.2 | 60.51±10.01 | 65.01±10.26 | <0.01 |
| Above high school | 82 (9.2) | 24 (11.3) | 58 (8.5) | 0.17 |
| No spouse | 136 (15.2) | 19 (8.9) | 117 (17.2) | 0.006 |
| Regular exercise | 684 (76.6) | 177 (83.1) | 507 (74.6) | <0.05 |
| Income above population average (%) | 220 (24.6) | 50 (23.5) | 170 (25.0) | 0.80 |
| BMI, mean (SD) | 23.9±2.7 | 22.9±2.6 | 24.4±2.9 | <0.01 |
| Disease duration in years, median (SD) | 5.6±5.1 | 5.4±4.9 | 5.9±5.3 | 0.218 |
| Comorbidities | 326 (36.5) | 75 (35.2) | 251 (36.9) | 0.79 |
| Complications | 232 (26.0) | 48 (22.5) | 184 (27.1) | 0.48 |
| Smokers | 133 (14.9) | 33 (15.5) | 100 (14.7) | 0.51 |
| Drinkers | 112 (12.5) | 35 (16.4) | 77 (11.3) | 0.02 |
| Anxiety ≥50 | 501 (56.1) | 99 (46.5) | 402 (59.1) | <0.01 |
| Depression ≥50 | 389 (43.6) | 75 (35.2) | 314 (46.2) | <0.01 |
| PSQI ≥8 | 305 (34.2) | 52 (24.4) | 253 (37.2) | <0.01 |
All figures are n (%) unless otherwise indicated.
BMI, body mass index; PSQI, Pittsburgh Sleep Quality Index.
Figure 1.
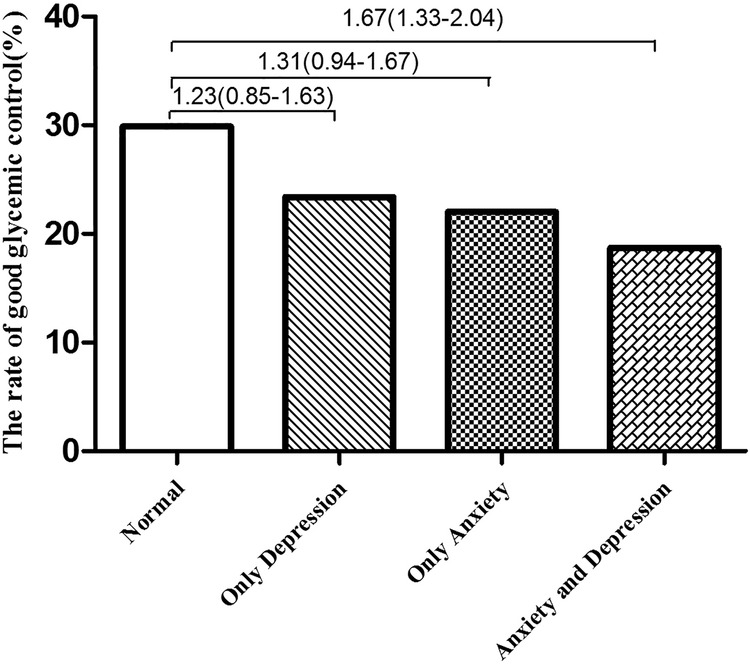
Odds ratios for the association between depression and glycaemic control by anxiety symptoms in participants with T2DM. T2DM, type 2 diabetes mellitus.
Compared with patients with neither depressive symptoms nor anxiety symptoms, those with depressive symptoms or anxiety symptoms only did not have a higher risk of poor glycaemic control. Participants with depressive symptoms and anxiety symptoms had a 1.67-fold increased risk of poor glycaemic control compared with those with neither depressive symptoms nor anxiety symptoms (figure 1).
There was an additive interaction between depressive symptoms and anxiety symptoms (RERI: 4.93, 95% CI 2.09 to 7.87; AP: 27%, 95% CI 12% to 45%) in relation to glycaemic control (table 4). Therefore, the OR of poor glycaemic control in participants with depressive symptoms and anxiety symptoms was 4.93 times higher owing to the additive interaction, compared with participants with neither depressive symptoms nor anxiety symptoms, with 27% of poor glycaemic control attributed to the interaction of depressive symptoms and anxiety symptoms. The S was 1.41 (95% CI 1.22 to 1.66); the 1.41-fold excess risk of poor glycaemic control could be explained by the combination of depressive symptoms and anxiety symptoms.
Table 4.
Estimates of biological interaction between anxiety and depression symptoms and their effects on glycaemic control in participants with T2DM
| Measures of biological interaction | Estimate (95% CI) |
|---|---|
| RERI | 4.93 (2.09 to 7.87) |
| AP | 0.27 (0.12 to 0.45) |
| S | 1.41 (1.22 to 1.66) |
Reference group: anxiety symptom score <50 and depressive symptom score <50. Models were adjusted for age, sex, education level, marital status, exercise, income, BMI, disease duration, comorbidity, complications, smoking, drinking, insulin use and poor sleep quality.
AP, attributable proportion due to interaction; BMI, body mass index; RERI, relative excess risk due to interaction; S, synergy index; T2DM, type 2 diabetes mellitus.
Discussion
In contrast with previous findings,17 18 our Chinese participants with T2DM had a higher prevalence of depressive and anxiety symptoms, and we identified different factors associated with depressive and anxiety symptoms. Furthermore, there was an additive interaction between depressive and anxiety symptoms in relation to poor glycaemic control.
We found that the prevalence of anxiety and depressive symptoms in patients with T2DM was 56.1% and 43.6%, respectively; these figures are consistent with reports from other countries.32 33 However, we found a higher prevalence of anxiety symptoms in patients with T2DM than that reported in other Chinese studies.17 18 The prevalence of depressive symptoms was consistent with previous findings from China,33 34 but higher than results reported from a Shanghai study9 and studies from four other major Chinese cities.19 These discrepancies might be a result of different living habits, good health management and treatment in large Chinese cities,35 or differences in screening instruments or sampling methods.
Our results provide evidence that patients with T2DM with depressive and anxiety symptoms can experience poor sleep quality. Although no relationship between poor sleep quality and anxiety or depressive symptoms has been reported for the general population or for people with chronic diseases,36 37 poor sleep quality may be more common in patients with T2DM.20
Our findings are consistent with research showing an association between being woman and anxiety or depressive symptoms.6 10 32 38 This sex difference could be due to lifestyle differences. In Chinese society, women normally spend most of their time at home, which may lead to lower physical activity and poor eating habits.39 It is also possible that women's social role allows them to be more emotional and extroverted than men.32 Hormone theory may also provide a useful framework for interpreting this finding. After the age of 30 years, oestrogen gradually decreases in women,40 resulting in a decline in well-being.40 41 According to this theory, disorders may result from a combination of genetic and environmental factors. For disorders that show sex differences in prevalence rates (as is the case for anxiety disorders in people with diabetes), the sex with the lower prevalence demonstrates a higher threshold, and thus requires a greater number of environmental factors or genetic defects to manifest the disorder. Another possible reason for the sex difference in our findings is that the survey data for men were not reliable.
Trento et al38 reported an association between comorbid anxiety disorders and increased depressive symptoms in patients with T2DM. Our study also showed an association between anxiety symptoms and depressive symptoms. One potential interpretation is that anxiety symptoms and depressive symptoms are positively correlated in chronic diseases.42 Depression-related symptoms can magnify symptoms of anxiety.43
Our results revealed a negative association between higher income and anxiety symptoms in participants with T2DM. Research indicates that sources of stress such as greater levels of poverty, financial difficulties and other economic problems could cause feelings of insecurity, thereby increasing the risk of developing anxiety symptoms.32 44
Consistent with other studies,10 31 we found that diabetes duration was significantly associated with higher anxiety scores. This may be because chronic disease significantly increases the risk of developing diabetic complications and increases healthcare expenditure;45 as a result, such patients are more likely to develop psychological illnesses.46
In the present study, age was an independent factor associated with depressive symptoms, consistent with previous findings.32 47 Older people face many challenges, such as isolation and increased health problems and disabilities, making them more likely to develop psychological problems.48
Consistent with previous research findings,32 49 we found that a lower educational level was associated with a higher depression rate. In developing countries, lower educational level is associated with a lack of social security,49 poorer understanding and knowledge about the prevention and control of diabetes and an increased likelihood of developing depression.
Mikaliu¯kštiene˙ et al reported that marital status was associated with depression prevalence;37 this is consistent with the present results. The older a person is, the more likely they are to be a widow or widower. Older people are therefore more likely to be single and to experience psychological disorders.
Complications of diabetes are associated with depression46 and we found that this was an independent predictor of depressive symptoms. Diabetes complications such as sexual dysfunction, painful peripheral neuropathy, neuropathy and nephropathy may increase susceptibility to depression.50 51
Previous cross-sectional and longitudinal studies are inconclusive regarding the associations between anxiety or depressive symptoms and glycaemic control. Some studies have reported that anxiety and depressive symptoms are associated with poorer glycaemic control.52–54 Consistent with our own results, other studies have found no association between anxiety or depressive symptoms and glycaemic control.55–58 However, our findings indicate a combined impact of depressive symptoms and anxiety symptoms on glycaemic control. One possibility is that the coexistence of depressive and anxiety symptoms aggravates the dysregulation of the hypothalamic–pituitary–adrenal axis,52 59 resulting in elevated blood glucose. The dysregulation of the hypothalamic–pituitary–adrenal axis is weaker when experiencing anxiety or depression singly; this impairs diabetes self-management but does not necessarily lead to poor blood sugar control.
The strengths of the current study are that we used a community-based multistage sampling design, large sample size and randomly selected participants. However, the study has several limitations. First, the cross-sectional design does not allow us to determine causal relationships between depressive symptoms, anxiety symptoms and poor glycaemic control. Second, it is possible that some participants were misclassified, as self-report instruments were used to assess anxiety and depression symptoms. Third, we did not measure dietary intake, which may partly contribute to anxiety and depression.60 61
Conclusions
In summary, our study revealed a high prevalence of depressive and anxiety symptoms in a large sample of the Chinese population suffering from T2DM. Female patients and those with poor sleep quality were more likely to show depressive and anxiety symptoms. In addition, anxiety symptoms were more frequent in participants with low income and chronic diseases, and depressive symptoms were more frequent in older, single participants, and those with low educational level and diabetes complications. Depressive or anxiety symptoms are not singly associated with poor glycaemic control in patients with T2DM; however, there is a combined impact of depressive symptoms and anxiety symptoms on poor glycaemic control. It is necessary to screen depressive and anxiety symptoms using psychiatric diagnoses to prevent and control these symptoms in patients with T2DM.
Footnotes
Contributors: NS participated in writing the title and abstract, reviewed the text and contributed to writing of the title, abstract and manuscript. PL conceived the study, participated in the study design, writing the title and abstract, editing the text, data extraction and analysis, and drafting the manuscript. YS and PZ performed literature searches, participated in writing the title and abstract and reviewing the text, and contributed to the manuscript drafts. JW, GC and CS were the lead authors of the original review, responsible for the conception of the study and contributed to the manuscript drafts. All authors read and approved the final manuscript.
Funding: This research was funded by the Preventive Medicine research projects of Jiangsu Province Health Department in 2015 (Y2015010), the Science and Technology project of Xuzhou City in 2015 (KC15SM046) and the Double-Hundred Talents Project of Xuzhou City in 2012 (BRA201224).
Competing interests: None declared.
Patient consent: Obtained.
Ethics approval: The study protocol was approved by Xuzhou Center for Disease Control and Prevention.
Provenance and peer review: Not commissioned; externally peer reviewed.
References
- 1.Guariguata L, Whiting DR, Hambleton I et al. Global estimates of diabetes prevalence for 2013 and projections for 2035. Diabetes Res Clin Pract 2014;103:137–49. 10.1016/j.diabres.2013.11.002 [DOI] [PubMed] [Google Scholar]
- 2.National Diabetes Prevention and Control Cooperative Group. A mass survey of diabetes mellitus in a population of 300,000 in 14 provinces and municipalities in China. Zhonghua Nei Ke Za Zhi 1981;20:678–83. [PubMed] [Google Scholar]
- 3.Xu Y, Wang L, He J et al. , 2010 China Noncommunicable Disease Surveillance Group. Prevalence and control of diabetes in Chinese adults. JAMA 2013;310:948–59. 10.1001/jama.2013.168118 [DOI] [PubMed] [Google Scholar]
- 4.Diabetes in China: mapping the road ahead. Lancet Diabetes Endocrinol 2014;2:923 10.1016/S2213-8587(14)70189-5 [DOI] [PubMed] [Google Scholar]
- 5.Lloyd CE, Pambianco G, Orchard TJ. Does diabetes-related distress explain the presence of depressive symptoms and/or poor self-care in individuals with Type 1 diabetes? Diabet Med 2010;27:234–7. 10.1111/j.1464-5491.2009.02896.x [DOI] [PMC free article] [PubMed] [Google Scholar]
- 6.Roy T, Lloyd CE. Epidemiology of depression and diabetes: a systematic review. J Affect Disord 2012;142(Suppl):S8–21. 10.1016/S0165-0327(12)70004-6 [DOI] [PubMed] [Google Scholar]
- 7.Bouwman V, Adriaanse MC, van 't Riet E et al. Depression, anxiety and glucose metabolism in the general Dutch population: the new Hoorn study. PLoS One 2010;5:e9971 10.1371/journal.pone.0009971 [DOI] [PMC free article] [PubMed] [Google Scholar]
- 8.Oztürk ZA, Yesil Y, Kuyumcu ME et al. Association of depression and sleep quality with complications of type 2 diabetes in geriatric patients. Aging Clin Exp Res 2015;27:533–8. 10.1007/s40520-014-0293-0 [DOI] [PubMed] [Google Scholar]
- 9.Wang L, Song R, Chen Z et al. Prevalence of depressive symptoms and factors associated with it in type 2 diabetic patients: a cross-sectional study in China. BMC Public Health 2015;15:188 10.1186/s12889-015-1567-y [DOI] [PMC free article] [PubMed] [Google Scholar]
- 10.Mikaliūkštienė A, Žagminas K, Juozulynas A et al. Prevalence and determinants of anxiety and depression symptoms in patients with type 2 diabetes in Lithuania. Med Sci Monit 2014;20:182–90. 10.12659/MSM.890019 [DOI] [PMC free article] [PubMed] [Google Scholar]
- 11.Egede LE. Diabetes, major depression, and functional disability among U.S. adults. Diabetes Care 2004;27:421–8. 10.2337/diacare.27.2.421 [DOI] [PubMed] [Google Scholar]
- 12.Santos MA, Ceretta LB, Réus GZ et al. Anxiety disorders are associated with quality of life impairment in patients with insulin-dependent type 2 diabetes: a case-control study. Rev Bras Psiquiat 2014;36:298–304. 10.1590/1516-4446-2013-1230 [DOI] [PubMed] [Google Scholar]
- 13.Kohen D, Burgess AP, Catalán J et al. The role of anxiety and depression in quality of life and symptom reporting in people with diabetes mellitus. Qual Life Res 1998;7:197–204. 10.1023/A:1008817812520 [DOI] [PubMed] [Google Scholar]
- 14.Ali S, Stone M, Skinner TC et al. The association between depression and health-related quality of life in people with type 2 diabetes: a systematic literature review. Diabetes Metab Res Rev 2010;26:75–89. 10.1002/dmrr.1065 [DOI] [PubMed] [Google Scholar]
- 15.Verma SK, Luo N, Subramaniam M et al. Impact of depression on health related quality of life in patients with diabetes. Ann Acad Med Singapore 2010;39:913–19. [PubMed] [Google Scholar]
- 16.Park M, Katon WJ, Wolf FM. Depression and risk of mortality in individuals with diabetes: a meta-analysis and systematic review. Gen Hosp Psychiatry 2013;35:217–25. 10.1016/j.genhosppsych.2013.01.006 [DOI] [PMC free article] [PubMed] [Google Scholar]
- 17.Lee S, Chiu A, Tsang A et al. Treatment-related stresses and anxiety-depressive symptoms among Chinese outpatients with type 2 diabetes mellitus in Hong Kong. Diabetes Res Clin Pract 2006;74:282–8. 10.1016/j.diabres.2006.03.026 [DOI] [PubMed] [Google Scholar]
- 18.Zhang CX, Chen YM, Chen WQ. Association of psychosocial factors with anxiety and depressive symptoms in Chinese patients with type 2 diabetes. Diabetes Res Clin Pract 2008;79:523–30. 10.1016/j.diabres.2007.10.014 [DOI] [PubMed] [Google Scholar]
- 19.Zhang Y, Ting RZ, Yang W et al. , China Depression in Chinese Patients with Type 2 Diabetes (DD2) Study Group. Depression in Chinese patients with type 2 diabetes: associations with hyperglycemia, hypoglycemia, and poor treatment adherence. J Diabetes 2015;76:800–8. 10.1111/1753-0407.12238 [DOI] [PMC free article] [PubMed] [Google Scholar]
- 20.Lou P, Qin Y, Zhang P et al. Association of sleep quality and quality of life in type 2 diabetes mellitus: a cross-sectional study in China. Diabetes Res Clin Pract 2015;107:69–76. 10.1016/j.diabres.2014.09.060 [DOI] [PubMed] [Google Scholar]
- 21.Chinese Medical Association Diabetes Branch. Chinese Type 2 diabetes prevention and control guidelines (2010 edition). Chin J Diabetes 2012;201:s1–36. [Google Scholar]
- 22.Zung WW. A rating instrument for anxiety disorders. Psychosomatics 1971;12:371–9. 10.1016/S0033-3182(71)71479-0 [DOI] [PubMed] [Google Scholar]
- 23.Zung WW. A self-rating depression scale. Arch Gen Psychiatry 1965;12:63–70. 10.1001/archpsyc.1965.01720310065008 [DOI] [PubMed] [Google Scholar]
- 24.Zhang J, Xu CP, Wu HX et al. Comparative study of the influence of diabetes distress and depression on treatment adherence in Chinese patients with type 2 diabetes: a cross-sectional survey in the People's Republic of China. Neuropsychiatr Dis Treat 2013;9:1289–94. 10.2147/NDT.S49798 [DOI] [PMC free article] [PubMed] [Google Scholar]
- 25.Zhang Z. Manual of behavioral medicine scale. Chin J Behav Med Sci 2001;104–17. [Google Scholar]
- 26.Cooperative Meta-analysis Group of China Obesity Task Force. Predictive values of body mass index and waist circumference to risk factors of related disease in Chinese adult population. Zhonghua Liu Xing Bing Xue Za Zhi 2002;23:5–10. [PubMed] [Google Scholar]
- 27.Buysse DJ, Reynolds CF III, Monk TH et al. The Pittsburgh Sleep Quality Index: a new instrument for psychiatric practice and research. Psychiatry Res 1989;28:193–213. 10.1016/0165-1781(89)90047-4 [DOI] [PubMed] [Google Scholar]
- 28.Liu X, Tang M, Hu L et al. Reliability and validity of the Pittsburgh sleep quality index. Chin J Psychiatry 1996;29:103–7. [Google Scholar]
- 29.Ahlbom A, Alfredsson L. Interaction: a word with two meanings creates confusion. Eur J Epidemiol 2005;20:563–4. 10.1007/s10654-005-4410-4 [DOI] [PubMed] [Google Scholar]
- 30.Andersson T, Alfredsson L, Källberg H et al. Calculating measures of biological interaction. Eur J Epidemiol 2005;20:575–9. 10.1007/s10654-005-7835-x [DOI] [PubMed] [Google Scholar]
- 31.Knol MJ, VanderWeele TJ, Groenwold RH et al. Estimating measures of interaction on an additive scale for preventive exposures. Eur J Epidemiol 2011;26:433–8. 10.1007/s10654-011-9554-9 [DOI] [PMC free article] [PubMed] [Google Scholar]
- 32.Khuwaja AK, Lalani S, Dhanani R et al. Anxiety and depression among outpatients with type 2 diabetes: a multi-centre study of prevalence and associated factors. Diabetol Metab Syndr 2010;2:72 10.1186/1758-5996-2-72 [DOI] [PMC free article] [PubMed] [Google Scholar]
- 33.Liu Y, Maier M, Hao Y et al. Factors related to quality of life for patients with type 2 diabetes with or without depressive symptoms—results from a community-based study in China. J Clin Nurs 2013;22:80–8. 10.1111/jocn.12010 [DOI] [PubMed] [Google Scholar]
- 34.Mezuk B, Chen Y, Yu C et al. Depression, anxiety, and prevalent diabetes in the Chinese population: findings from the China Kadoorie Biobank of 0.5 million people. J Psychosom Res 2013;75:511–17. 10.1016/j.jpsychores.2013.09.008 [DOI] [PMC free article] [PubMed] [Google Scholar]
- 35.Jiang Y, Dong W, Mao F et al. Evaluation on the status quo of self monitoring of blood glucose and self-efficacy of diabetes patients in community. Zhonghua Yu Fang Yi Xue Za Zhi 2014;48:710–14. [PubMed] [Google Scholar]
- 36.Neckelmann D, Mykletun A, Dahl AA. Chronic insomnia as a risk factor for developing anxiety and depression. Sleep 2007;30:873–80. [DOI] [PMC free article] [PubMed] [Google Scholar]
- 37.Li Y, Zhang S, Zhu J et al. Sleep disturbances are associated with increased pain, disease activity, depression, and anxiety in ankylosing spondylitis: a case-control study. Arthritis Res Ther 2012;14:R215 10.1186/ar4054 [DOI] [PMC free article] [PubMed] [Google Scholar]
- 38.Trento M, Trevisan M, Raballo M et al. Depression, anxiety, cognitive impairment and their association with clinical and demographic variables in people with type 2 diabetes: a 4-year prospective study. J Endocrinol Invest 2014;37:79–85. [DOI] [PubMed] [Google Scholar]
- 39.Al-Tuwijri A, Al-Doghether M, Akturk Z et al. Quality of life of people with diabetes attending primary care health centres in Riyadh: bad control good quality? Qual Prim Care 2007;15:307–14. [Google Scholar]
- 40.Lord C, Buss C, Lupien SJ et al. Hippocampal volumes are larger in postmenopausal women using estrogen therapy compared to past users, never users and men: a possible window of opportunity effect. Neurobiol Aging 2008;29:95–101. 10.1016/j.neurobiolaging.2006.09.001 [DOI] [PubMed] [Google Scholar]
- 41.Sherwin BB. Estrogen and cognitive functioning in women. Endocr Rev 2003;24:133–51. 10.1210/er.2001-0016 [DOI] [PubMed] [Google Scholar]
- 42.Ryu YJ, Chun EM, Lee JH et al. Prevalence of depression and anxiety in outpatients with chronic airway lung disease. Korean J Intern Med 2010;25:51–7. 10.3904/kjim.2010.25.1.51 [DOI] [PMC free article] [PubMed] [Google Scholar]
- 43.Light RW, Merrill EJ, Despars JA et al. Prevalence of depression and anxiety in patients with COPD. Relationship to functional capacity. Chest 1985;87:35–8. [DOI] [PubMed] [Google Scholar]
- 44.Mirza I, Jenkins R. Risk factors, prevalence, and treatment of anxiety and depressive disorders in Pakistan: systematic review. BMJ 2004;328:794 10.1136/bmj.328.7443.794 [DOI] [PMC free article] [PubMed] [Google Scholar]
- 45.Khowaja LA, Khuwaja AK, Cosgrove P. Cost of diabetes care in out-patient clinics of Karachi, Pakistan. BMC Health Serv Res 2007;7:189 10.1186/1472-6963-7-189 [DOI] [PMC free article] [PubMed] [Google Scholar]
- 46.Tovilla-Zárate C, Juárez-Rojop I, Peralta Jimenez Y et al. Prevalence of anxiety and depression among outpatients with Type 2 diabetes in the Mexican population. PLoS One 2012;7:e36887. [DOI] [PMC free article] [PubMed] [Google Scholar]
- 47.Almawi W, Tamim H, Al-Sayed N et al. Association of comorbid depression, anxiety and stress disorders with type 2 diabetes in Bahrain, a country with a very high prevalence of type 2 diabetes. J Endocrinol Invest 2008;31:1020–4. 10.1007/BF03345642 [DOI] [PubMed] [Google Scholar]
- 48.Ganatra HA, Zafar SN, Qidwai W et al. Prevalence and predictors of depression among an elderly population of Pakistan. Aging Ment Health 2008;12:349–56. 10.1080/13607860802121068 [DOI] [PubMed] [Google Scholar]
- 49.Bensbaa S, Agerd L, Boujraf S et al. Clinical assessment of depression and type 2 diabetes in Morocco: economical and social components. J Neurosci Rural Pract 2014;5:250–3. 10.4103/0976-3147.133576 [DOI] [PMC free article] [PubMed] [Google Scholar]
- 50.de Groot M, Anderson R, Freedland KE et al. Association of depression and diabetes complications: a meta-analysis. Psychosom Med 2001;63:619–30. 10.1097/00006842-200107000-00015 [DOI] [PubMed] [Google Scholar]
- 51.van Steenbergen-Weijenburg KM, van Puffelen AL, Horn EK et al. More co-morbid depression in patients with Type 2 diabetes with multiple complications. An observational study at a specialized outpatient clinic. Diabetes Med 2011;28:86–9. [DOI] [PubMed] [Google Scholar]
- 52.Fisher L, Skaff MM, Mullan JT et al. A longitudinal study of affective and anxiety disorders, depressive affect and diabetes distress in adults with Type 2 diabetes. Diabetes Med 2008;25:1096–101. 10.1111/j.1464-5491.2008.02533.x [DOI] [PMC free article] [PubMed] [Google Scholar]
- 53.Bot M, Pouwer F, de Jonge P et al. Differential associations between depressive symptoms and glycaemic control in outpatients with diabetes. Diabetes Med 2013;30:e115–22. 10.1111/dme.12082 [DOI] [PubMed] [Google Scholar]
- 54.Schmitt A, Reimer A, Kulzer B et al. Negative association between depression and diabetes control only when accompanied by diabetes-specific distress. J Behav Med 2015;38:556–64. 10.1007/s10865-014-9604-3 [DOI] [PubMed] [Google Scholar]
- 55.Engum A. The role of depression and anxiety in onset of diabetes in a large population-based study. J Psychosom Res 2007;62: 31–8. 10.1016/j.jpsychores.2006.07.009 [DOI] [PubMed] [Google Scholar]
- 56.Paschalides C, Wearden AJ, Dunkerley R et al. The associations of anxiety, depression and personal illness representations with glycaemic control and health-related quality of life in patients with type 2 diabetes mellitus. J Psychosom Res 2004;57:557–64. 10.1016/j.jpsychores.2004.03.006 [DOI] [PubMed] [Google Scholar]
- 57.Pouwer F, Geelhoed-Duijvestijn PH, Tack CJ et al. Prevalence of comorbid depression is high in out-patients with Type 1 or Type 2 diabetes mellitus. Results from three out-patient clinics in the Netherlands. Diabet Med 2010;27:217–24. 10.1111/j.1464-5491.2009.02903.x [DOI] [PubMed] [Google Scholar]
- 58.Alonso-Morán E, Satylganova A, Orueta JF et al. Prevalence of depression in adults with type 2 diabetes in the Basque Country: relationship with glycaemic control and health care costs. BMC Public Health 2014;14:769 10.1186/1471-2458-14-769 [DOI] [PMC free article] [PubMed] [Google Scholar]
- 59.Soravia LM, Heinrichs M, Aerni A et al. Glucocorticoids reduce phobic fear in humans. Proc Natl Acad Sci USA 2006;103: 5585–90. 10.1073/pnas.0509184103 [DOI] [PMC free article] [PubMed] [Google Scholar]
- 60.Oliver G, Wardle J. Perceived effects of stress on food choice. Physiol Behav 1999;66:511–15. 10.1016/S0031-9384(98)00322-9 [DOI] [PubMed] [Google Scholar]
- 61.Sanchez-Villegas A, Henriquez P, Bes-Rastrollo M et al. Mediterranean diet and depression. Public Health Nutr 2006;9:1104–9. 10.1017/S1368980007668578 [DOI] [PubMed] [Google Scholar]