The first interpretable X-ray scattering data concerning lateral (radial) packing of bone collagen molecules is presented, which indicates that bone contains spatially discrete collagen microfibrils. A spatially discrete microfibril model supports structure–function-based explanations for internal fibril mineralization and for the unique pattern of collagen post-translational modifications in mineralized tissues.
Keywords: bone, supramolecular structure, collagen, X-ray scattering, cross-linking
Abstract
The evolution of vertebrates required a key development in supramolecular evolution: internally mineralized collagen fibrils. In bone, collagen molecules and mineral crystals form a nanocomposite material comparable to cast iron in tensile strength, but several times lighter and more flexible. Current understanding of the internal nanoscale structure of collagen fibrils, derived from studies of rat tail tendon (RTT), does not explain how nucleation and growth of mineral crystals can occur inside a collagen fibril. Experimental obstacles encountered in studying bone have prevented a solution to this problem for several decades. This report presents a lateral packing model for collagen molecules in bone fibrils, based on the unprecedented observation of multiple resolved equatorial reflections for bone tissue using synchrotron small-angle X-ray scattering (SAXS; ∼1 nm resolution). The deduced structure for pre-mineralized bone fibrils includes features that are not present in RTT: spatially discrete microfibrils. The data are consistent with bone microfibrils similar to pentagonal Smith microfibrils, but are not consistent with the (nondiscrete) quasi-hexagonal microfibrils reported for RTT. These results indicate that collagen fibrils in bone and tendon differ in their internal structure in a manner that allows bone fibrils, but not tendon fibrils, to internally mineralize. In addition, the unique pattern of collagen cross-link types and quantities in mineralized tissues can be can be accounted for, in structural/functional terms, based on a discrete microfibril model.
1. Introduction
Most vertebrate tissues depend on the tensile strength of collagen fibrils for resistance to tearing or breaking. Organically, human bone consists of about 90–95% genetic type I collagen molecules, organized into rope-like fibrils that typically range from around 30 to 100 nm in diameter. The inorganic component of bone, apatite crystals, contributes compressive strength, as well as rigidity, or resistance to bending. However, random spatial arrangements of collagen and apatite will not produce a material with the properties of bone. Its physiological and mechanical characteristics require a specific nanocomposite architecture of collagen molecules and apatite crystals (Glimcher, 1998 ▸, 2006 ▸), the details of which are currently unknown. The mechanical properties of bone further depend on a particular pattern of intermolecular collagen cross-linking, which differs substantially from cross-linking patterns for nonmineralized tissues (Eyre & Weis, 2013 ▸; Knott & Bailey, 1998 ▸; Yamauchi & Sricholpech, 2012 ▸). The functions served by the specific cross-linking structures present in mature bone are also currently unknown.
In a normal physiological environment, bone, dentin and calcified cartilage are mineralized after collagen fibril formation is complete. Normal mineralization occurs both inside and outside collagen fibrils (Glimcher, 1959 ▸, 1998 ▸, 2006 ▸; Lee & Glimcher, 1991 ▸), in contrast to ectopic calcification, an aberrant, deleterious process of mineral deposition in normally nonmineralized tissues that occurs only between or on the surfaces of collagen fibrils. The presence or absence of mineral deposition in a tissue is subject to local regulation by cell-specific production of enhancers or inhibitors of this process. Alteration of the normal production of these factors is one circumstance that can result in ectopic calcification of normally mineral-free tissues (Murshed et al., 2005 ▸). However, the specialized ability of bone fibrils to accommodate mineral in the interior of the fibril (Glimcher, 1959 ▸, 1998 ▸, 2006 ▸; Lee & Glimcher, 1991 ▸) has, to our knowledge, never been observed in normally nonmineralized collagen. This report addresses the spatial arrangement of collagen molecules and apatite crystals inside bone fibrils.
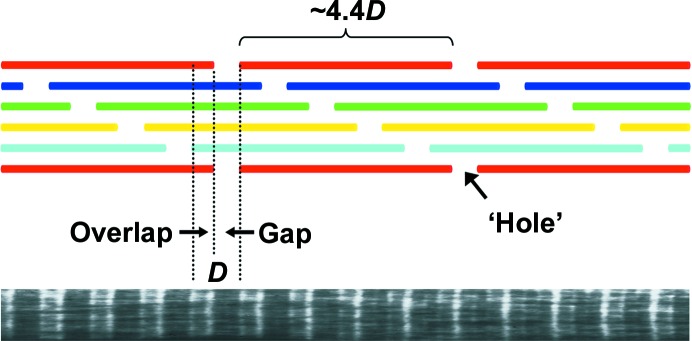
Early small-angle X-ray scattering (SAXS) studies of tendon collagen (Bear, 1944 ▸) showed equidistant meridional reflections that were spaced by about 67 nm. This result indicated the presence of a periodic structure with a high degree of long-range order in the longitudinal (axial) dimension, and was consistent with the fibril banding pattern observed by transmission electron microscopy (TEM; Schmitt et al., 1942 ▸). Based on these observations, the ‘quarter-stagger’ model of longitudinal collagen packing was proposed by Hodge and Petruska (Fig. 1 ▸). It specifies that collagen molecules are aligned with their ends displaced relative to their lateral (radial) neighbours by a multiple of 67 nm, defined as D (Hodge & Petruska, 1963 ▸). In the fibril axis direction, ‘gap’ and ‘overlap’ regions are evident in TEM images (Fig. 1 ▸). According to the Hodge–Petruska model, these regions are partially unoccupied and more completely occupied areas in the collagen scaffold, respectively. Their combined length constitutes the fibril banding period (D ≃ 67 nm). Since collagen molecules have a length of about 4.4D, they have four D-length segments, with the C-terminal being 0.4D, and each molecule is separated axially from the N-terminus of its neighbor by a ‘hole’ of length 0.6D. This five-segment composition suggested the possibility of a five-stranded microfibril with a pentagonal cross-section, having all nearest-neighbor molecules staggered by 1D (and 4D) (Smith, 1968 ▸). Historically, two five-stranded microfibrils have been the leading contenders as possible collagen fibril components: the pentagonal or ‘Smith’ microfibril and the quasi-hexagonal (q-h) or ‘compressed’ microfibril (Trus & Piez, 1980 ▸).
Figure 1.
The Hodge–Petruska model (Hodge & Petruska, 1963 ▸) of longitudinal packing of collagen molecules. Rods in the same color represent collagen molecules with the same (or 5nD) axial shift, where n is an integer and D is the longitudinal period (∼67 nm). The presence of ‘holes’ results in a density contrast along the fibril axis with ‘overlap’ and ‘gap’ regions for each D period. The TEM image is of a negatively stained fibril.
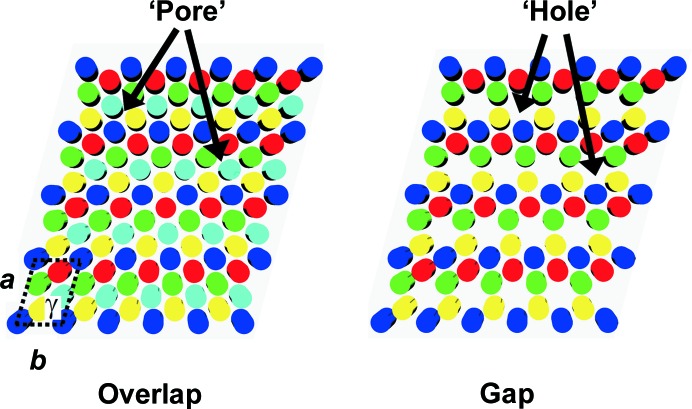
The longitudinal fibril periodicity is consistent with any conceivable lateral arrangement of collagen molecules, provided that the molecules are staggered by integral multiples of D (Hodge, 1989 ▸). Prior to the present report, sufficient data to enable a lateral structure analysis had only been obtained for rat tail tendon (RTT) and a few similar highly organized soft tissues, originally in 1971 (Miller & Wray, 1971 ▸). The equatorial SAXS data for RTT were reported to be consistent with a lateral arrangement of parallel sheets of collagen molecules on a quasi (somewhat disordered) hexagonal lattice (Hulmes & Miller, 1979 ▸; Fig. 2 ▸). In subsequent work, analysis of samples stained with phosphotungstic acid provided the basis for the description of a triclinic unit cell (Fraser et al., 1983 ▸). Diffuse scatter in the equatorial pattern could be accounted for by a model consisting of radially oriented crystalline domains with disordered grain boundaries (Hulmes et al., 1995 ▸). Removal of the diffuse background from synchrotron SAXS data allowed further indexing of reflections, which indicated a microfibril, rather than a sheet-like, structure (Wess et al., 1998a ▸). Data obtained using isomorphous heavy-atom derivatives provided additional information concerning the configurations of the nonhelical ends of collagen molecules (Orgel et al., 2000 ▸) and ultimately resulted in a three-dimensional electron-density map for type I collagen in RTT which included q-h microfibrils. These microfibrils were not spatially discrete (Orgel et al., 2006 ▸), i.e. were not evident in a lateral cross-sectional view such as that shown in Fig. 2 ▸. Discrete microfibrils have been found in corneal fibrils, which consist of 90% type I collagen and 10% type V collagen (reviewed in Meek, 2009 ▸).
Figure 2.
The quasi-hexagonal lateral packing model for RTT (Hulmes & Miller, 1979 ▸). A schematic representation of fibril cross-sections through the overlap zone (left) and gap zone (right) is shown. Disks in the same color represent cross-sections of molecules with the same axial shift (Fig. 1 ▸). A unit cell is shown at the lower left; see Table 1 ▸ for lattice constants.
Major contributors to the RTT model have noted that this model cannot explain the mineral content of bone fibrils (Wess et al., 1998b ▸). For bone, data relevant to longitudinal packing of collagen molecules have been obtainable (Glimcher, 1998 ▸, 2006 ▸); however, owing to experimental obstacles, equally informative data concerning lateral packing have been sought unsuccessfully for several decades. Since mineralization progressively distorts the fibril structure (Glimcher, 1998 ▸, 2006 ▸) and mineralization follows fibril formation very rapidly in most species, sufficient amounts of nonmineralized, unperturbed fibrils have not been easily accessible for study. In addition, collagen fibres and/or fibrils in commonly studied bone tissues are organized in a spatially complex, generally nonparallel fashion, complicating any effort to obtain SAXS structural data (Glimcher, 1998 ▸, 2006 ▸; see Supplementary Fig. S1).
The q-h model developed for RTT has been the only available description of lateral packing of collagen molecules in native fibrils. However, RTT does not mineralize under normal physiological conditions, nor does tendon collagen in mineralizing turkey leg, a popular sample for studies of mineralized tissue. [Before mineralization, turkey tendon collagen is remodeled, leaving a more bone-like collagen in place of the original tendon matrix (Yamauchi & Katz, 1993 ▸; Knott et al., 1997 ▸).] The ‘pores’ described in the q-h model (Fig. 2 ▸) are too narrow to allow PO4 3− ions to diffuse into the interior of a fibril to form a mineral phase (Katz & Li, 1972 ▸, 1973b ▸) and a single ‘hole’ does not provide sufficient room for a bone apatite crystal (Robinson, 1952 ▸; Kim et al., 1995 ▸; Burger, Zhou, Wang et al., 2008 ▸). The ‘holes’ have a cylindrical shape with a diameter of ∼1.8 nm, while a platelet-shaped mineral crystal is tens of nanometres in length and width, and about 1.5 nm in thickness (Burger, Zhou, Wang et al., 2008 ▸). The closest center-to-center intermolecular distance is about 1.5 nm, and the diameter of collagen molecules is about 1.2 nm (Supplementary Table S1), so the size of a ‘pore’ is about 0.3 nm. The ‘diameter’ of PO4 3− is about 0.4 nm for nonhydrated ions (assuming a P—O bond length of 0.15 nm) and 0.8 nm for hydrated ions (assuming a single-layer water shell) (Mason et al., 2003 ▸; Pribil et al., 2008 ▸). Thus, PO4 3− ions are too large to penetrate into RTT collagen fibrils to form mineral crystals. To resolve these issues, it has been proposed that, by reshuffling a q-h lattice, ‘holes’ could be aligned laterally into ‘channels’ that would allow the passage of mineral precursor ions into a fibril and also accommodate crystals (Katz & Li, 1973a ▸; Hodge, 1989 ▸; Weiner & Traub, 1992 ▸; Landis et al., 1993 ▸).
2. Materials and methods
2.1. Sample preparation
Intramuscular bones were dissected from herring (Clupea harengus; 3–5 years old) and shad (4–5 years old), which had been frozen in liquid nitrogen immediately after sacrifice. After dissection, the bones were immediately cooled to liquid-nitrogen temperature and then stored at −78.5°C for no more than a day or two before use. For scattering experiments, samples were sealed in capillaries to preserve their moisture. Fresh RTT samples were prepared using a similar procedure and were used without staining. Dehydrated samples were prepared by exposing them to flowing air (laboratory hood) at room temperature for 1 d. Dehydrated RTT was stretched in air for 3 min with 16.6 g weights.
2.2. X-ray scattering instrumentation
X-ray measurements were carried out on beamline X27C at the National Synchrotron Light Source, Brookhaven National Laboratory. The wavelength was 0.1371 nm. A three-pinhole collimation system was used. The beam diameter at the sample position was 0.2 mm. The typical sample-to-detector distance was about 300 mm. The exposure time ranged from 10 to 30 min. Two-dimensional SAXS patterns were recorded on Fuji imaging plates and read using a Fuji BAS 2500 imaging-plate scanner. For dry tendon analysis, the sample-to-detector distance was about 740 mm.
3. Results
3.1. SAXS analysis of fish bone
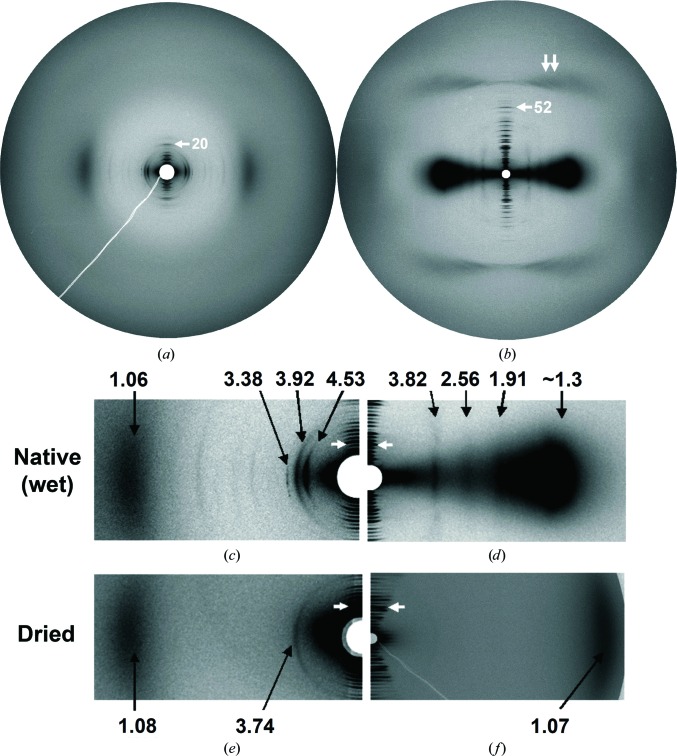
The intramuscular bones of several fish species (Supplementary Fig. S2) are composed of nearly parallel fibrils and contain significant amounts of pre-mineralized bone collagen (Lee & Glimcher, 1991 ▸), making them ideal for SAXS experiments. During dissection and analysis of these small bones, care was taken to avoid dehydration (see §2). Pre-mineralized areas from the increasing mineralization region of intramuscular herring (Figs. 3 ▸ a and 3 ▸ c) and shad bone (Supplementary Fig. S3) were studied, and also native, unstained RTT (Figs. 3 ▸ b and 3 ▸ d). Meridional reflections up to the 25th order for herring bone and up to the 57th order for RTT were observed. This analysis showed that the collagen molecule longitudinal arrangement in fish-bone fibrils was similar to that in RTT (Burger, Zhou, Sics et al., 2008 ▸). The RTT equatorial pattern is consistent with previous results on which the quasi-hexagonal model (Hulmes & Miller, 1979 ▸) was based. RTT row lines revealed the reported split (Miller & Wray, 1971 ▸) owing to a small tilt of the molecules in the fibril (Fraser et al., 1983 ▸). Meridional repeat periods were 64.4 (1) and 67.7 (2) nm for bone and tendon, respectively. For dry tendon, the longitudinal periodicity was 64.5 (1) nm; for dry bone it was 65.3 (2) nm.
Figure 3.
SAXS patterns of (a) native, pre-mineralized intramuscular herring bone and (b) native unstained rat tail tendon (RTT). The meridian, reflecting longitudinal order (in the fibril axis direction), is vertical; the equator, reflecting lateral (radial) order, is horizontal. Arrows indicate the 20th meridional order of herring bone and the 52nd meridional order of RTT. The double arrow indicates the third layer line of the collagen molecule triple helix. The center portions of the two scattering patterns in (a) and (b) are enlarged in (c) and (d), respectively. The patterns in (e) and (f) are for dehydrated samples. In (c), (d), (e) and (f), numbers are Bragg spacings (nm) and white arrows indicate the ninth meridional order. A line plot of the pattern in (c) is shown in Fig. 6 ▸(a).
In contrast to the vast majority of collagen SAXS patterns not from RTT, the bone pattern showed multiple well resolved equatorial reflections, allowing experimentally substantiated conclusions regarding collagen-molecule lateral packing. Possible alternative sources for equatorial scattering are (i) collagen fibrils oriented perpendicular to the principal bone axis and (ii) scattering from tissues other than collagen, perhaps muscle or nerve sheath. Extensive optical microscopy and TEM analysis of intramuscular fish bone (Glimcher, 1959 ▸; Lee & Glimcher, 1991 ▸; Burger, Zhou, Wang et al., 2008 ▸) did not support case (i) or case (ii). Further, the equatorial peak shapes, centers and orientations (Figs. 3 ▸ a and 3 ▸ c) were inconsistent with a series of orders of 00l reflections, as required for case (i), while they were compatible with lateral packing with small tilts and different coherence lengths in different directions.
Equatorial reflection/row-line positions differed significantly for fish bone and RTT (Figs. 3 ▸ a and 3 ▸ c, and Figs. 3 ▸ b and 3 ▸ d, respectively; Table 1 ▸). Thus, a molecular packing scheme for fish bone similar to the RTT structure was excluded. The bone equatorial reflections also had a less ordered appearance than those for RTT. The SAXS pattern for bone would not be expected to resemble that of a highly ordered structure such as RTT, since there is evidence for substantial disorder in the bone structure (see §3.3 below). Varying peak shapes and angular distributions, as observed for the bone reflections, can indicate different origins; however, considering the composition of the sample, a noncollagen origin for any of the major reflections could be easily ruled out. The punctate distribution of the 3.38 nm reflection resembled the commonly observed spotty, uneven arcs in X-ray scattering patterns of mineral crystals, but reflections arising from mineral occur in the wide-angle range (<1 nm). Further, the presence of mineral would be detected by simultaneous wide-angle analysis (Burger, Zhou, Wang et al., 2008 ▸). A noncollagen origin for the 3.38 nm reflection would have to be from a fibrous or filamentous protein that is comparable in abundance to collagen, considering the intensity of this reflection, which is similar to that of the strongest collagen meridional reflections. As mentioned above, extensive TEM studies of fish bone (extending over several decades; Glimcher, 1959 ▸; Lee & Glimcher, 1991 ▸; Burger, Zhou, Wang et al., 2008 ▸) have not revealed any major noncollagen fibrous or filamentous components. The spottiness feature could conceivably arise from a collagen–inorganic ion interaction, or could be related to the fact that 3.38 nm is the smallest Bragg spacing for the major inner equatorial reflections for bone. Variations in equatorial peak shapes and angular distributions can arise from a packing structure that includes tilts and varying coherence lengths in different directions.
Table 1. Equatorial reflections/row lines listed as Bragg spacings and h and k indices.
The two-dimensional oblique unit cell for bone collagen fibrils has lattice constants a = 4.657 nm, b = 4.029 nm, γ = 103.5°. RTT spacings are based on a refined quasi-hexagonal lattice with a = 2.667 nm, b = 3.903 nm, γ = 104.58° (Hulmes & Miller, 1979 ▸). Spacings marked with an asterisk without confidence estimates are the centers of broad maxima.
| Herring bone collagen | Rat tail tendon collagen | ||||||
|---|---|---|---|---|---|---|---|
| Observed (nm) | Calculated (nm) | h | k | Observed (nm) | Calculated (nm) | h | k |
| 4.529 (2) | 4.529 | 1 | 0 | 3.817 (1) | 3.778 | 0 | 1 |
| 3.918 (4) | 3.918 | 0 | 1 | 2.563 (6) | 2.582 | 1 | 0 |
| 3.378 (5) | 3.378 | 1 | −1 | 2.436 | 1 | −1 | |
| 2.258 (3) | 2.265 | 2 | 0 | 1.907 (6) | 1.918 | 1 | 1 |
| 1.944 (2) | 1.959 | 0 | 2 | 1.889 | 0 | 2 | |
| 1.68* | 1.689 | 2 | −2 | 1.778 (9) | 1.748 | 1 | −2 |
| 1.506 (1) | 1.510 | 3 | 0 | 1.37* | 1.369 | 1 | 2 |
| 1.29* | 1.306 | 0 | 3 | 1.328 | 2 | −1 | |
| 1.27* | 1.264 | 1 | −3 | ||||
| 1.259 | 0 | 3 | |||||
An explanation offered some time ago for a 4.9 nm reflection from tendon involved the postulated presence of multilayered phospholipids (Miller, 1976 ▸). To our knowledge, no published reports have appeared which support this suggestion. Phospholipids are not a quantitatively significant constituent of compact bone; reported levels, in percent by weight, range from about 0.002 in bovine femur to about 0.4 in rabbit femur (During et al., 2015 ▸).
In fish bone and RTT, the degree of lateral order required for well resolved patterns was destroyed by dehydration (Figs. 3 ▸ e and 3 ▸ f) and, in bone, by the onset of mineralization, which occurs adjacent to pre-mineralized areas (Burger, Zhou, Wang et al., 2008 ▸; Supplementary Fig. S2). For bone, drying did not significantly affect the interference maximum at 1.06 nm (Figs. 3 ▸ a and 3 ▸ c), representing the molecular center-to-center distance, and a new equatorial reflection appeared at 3.74 nm. In contrast, dehydration of RTT (Fig. 3f ▸) resulted in a significantly reduced average intermolecular distance (1.2–1.3 nm, as estimated from the corresponding interference maximum at about 1.07 nm).
3.2. Exclusion of adjacent-hole ‘channels’
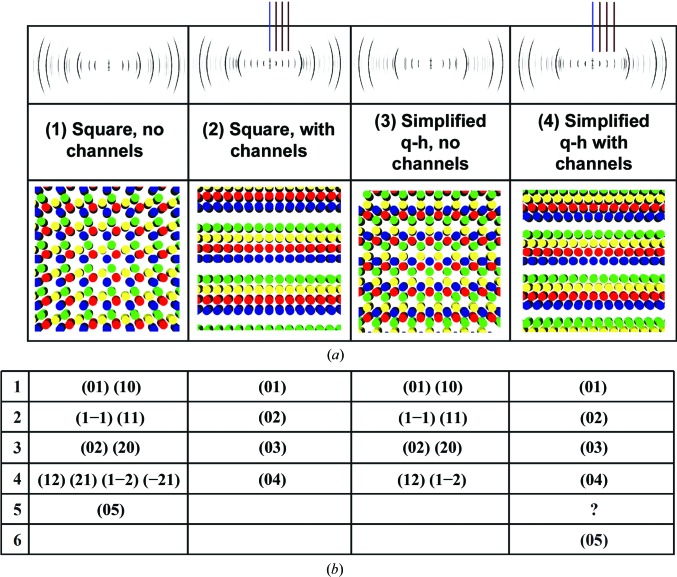
Attempts to explain internal fibril mineralization in terms of a quasi-hexagonal structure have involved putative ‘channels’, which would be composed of laterally aligned ‘holes’ (spacings between longitudinally adjacent molecules; Katz & Li, 1973a ▸; Hodge, 1989 ▸; Weiner & Traub, 1992 ▸; Landis et al., 1993 ▸). For a Hodge–Petruska structure, any regular alignment of holes into channels (i.e. out of the page in Fig. 1 ▸) would necessarily lead to a periodic array of channels, and therefore to equidistant spacing of lower-order equatorial reflections. This is shown with calculated SAXS patterns for cross-sections of regular packing models with different lateral arrangements of holes (Fig. 4 ▸). Regular lower-order spacing of this kind does not occur in data for RTT (Figs. 3 ▸ b and 3 ▸ d), and to our knowledge has never been reported. Comparison of the fish-bone pattern (Figs. 3 ▸ a and 3 ▸ c) with the calculated patterns shows no similarity, indicating a more complicated structure with lower symmetry.
Figure 4.
(a) Theoretical cross-sections of fibril ‘gap’ zones with regular lateral arrangements of holes, with or without channels, with corresponding calculated SAXS patterns and (b) the corresponding h, k indices. Simulations were performed with the methodology described previously (Che et al., 2013 ▸) using simplified rods to approximate collagen molecules in a quarter-staggered array with cross-sections shown below the simulated patterns. Only the unit-cell parameter a and appropriate angles for square and hexagonal lattices are required for these simulations. The vertical lines in (2) and (4) emphasize the equidistant spacing of low-angle reflections. In the fibril cross-section illustrations, disks with the same color represent cross-sections of molecules with the same axial shift (Fig. 1 ▸).
3.3. Lattice disorder
The patterns for bone (Figs. 3 ▸ a, 3 ▸ c and 3 ▸ e) featured an equatorial maximum at a relatively large angle with a Bragg spacing of around 1 nm (the length scale of the distance between near-neighbor molecules), which was significantly broader than the innermost equatorial reflections/row lines. For a lattice without disorder, where peak widths are determined by domain-size effects only, all peaks should have a constant width, as shown for the calculated patterns (Fig. 4 ▸). For a lattice with distortions of the second kind (which gradually limit the coherence of the lattice), peak widths should gradually increase with increasing scattering angle. For a lattice with distortions of the first kind (which displace lattice points from ideal positions without destroying the lattice coherence), peak widths should be constant, and disorder causes the appearance of an additive continuous modulated background. The abruptly broader intermolecular maximum cannot be created by homogeneously distorting a lattice (a distortion of the second kind). While the overall coherence and long-range order of the present lattice is good, as shown by the narrow equatorial peaks/row lines at small angles, the spatial correlation between individual molecules is much more locally confined than that of the lattice itself.
A simple (and possibly unique) model compatible with these findings is given by first grouping a small number of molecules into a microfibril and then packing whole microfibrils onto a regular lattice, and finally allowing for some lattice disorder, not disturbing the long-range order of the microfibril lattice (keeping inner equatorial peaks narrow) but limiting correlation of individual collagen molecules between different microfibrils. In the simplifying limit of rotational disorder (each microfibril rotated by an arbitrary amount about its axis, statistically independent from its neighbors), the scattering of idealized systems of this type can be calculated, and the broad equatorial maximum results in a fluctuation term owing to rotational disorder. According to the Laue substitution disorder approach, scattering from microfibrillar packing with ideal rotational disorder (i.e. the center of the microfibril is at the lattice point but its internal structure is randomly oriented) can be described by (1), where s is the reciprocal-lattice vector, s = |s| = 2sinθ/λ, 2θ is the scattering angle and λ is the wavelength of the incident beam,
(2) is the scattering from a single microfibril, where J 0 and J 5n are the Bessel functions of the first kind of orders zero and 5n, respectively. R is the radius of the circle passing through the five molecule centers in the Smith microfibril (illustrated in Fig. 5 ▸). The relationship between R and the center-to-center intermolecular distance d is R = d/2sin(π/5).
 |
(3) is the scattering of a rotationally averaged microfibril (i.e. a hollow cylinder). Therefore, in (4), J 5(2π·R·s)2 is the fluctuation term which produces the equatorial interference maximum at ∼1.06 nm, J 0(2π·R·s)2 is the form factor or the Fourier transform of the electron density of a rotationally averaged microfibril and |Z(s)|2 is the Fourier transform of the two-dimensional oblique lattice that describes the ordered microfibrillar packing.
Figure 5.
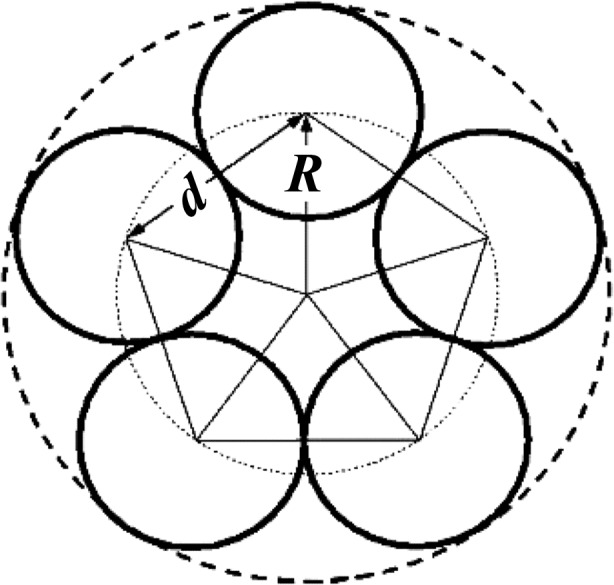
Cross section of a Smith microfibril showing the radius R and the center-to-center intermolecular distance d.
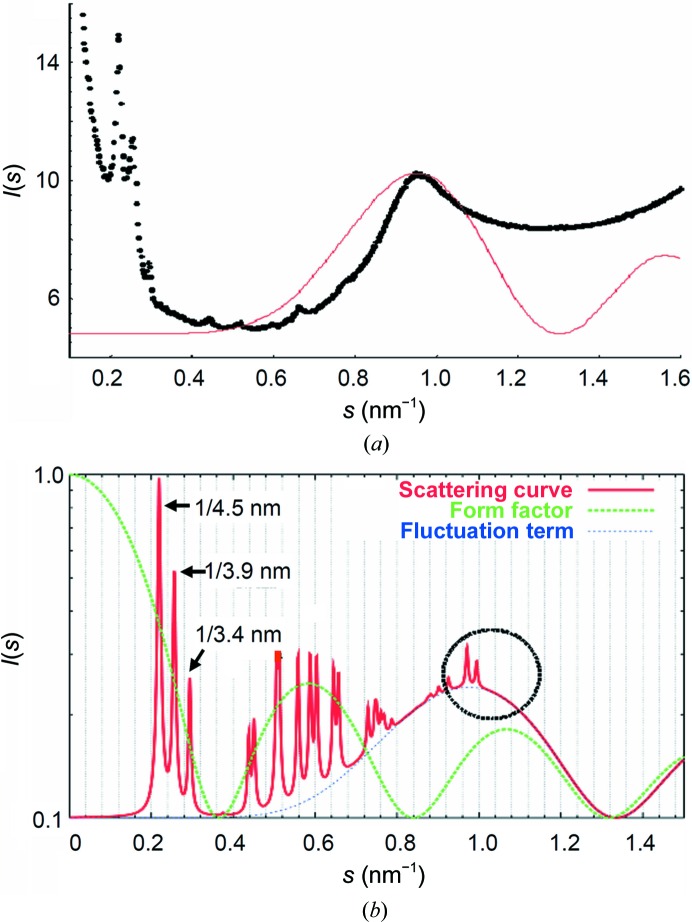
However, the measured equatorial interference maximum at ∼1.06 nm cannot be completely described by the simple model that assumes ideal rotational disorder for microfibrils in the two-dimensional oblique lattice. The fluctuation term produced a broader peak profile than the measured one (Fig. 6 ▸ a) and there were unobserved peaks in the calculated diffraction pattern (Fig. 6 ▸ b). If, on the other hand, the positions of molecules in different microfibrils were in register, i.e. there were no rotational disorder for microfibrils in the two-dimensional oblique lattice, the fluctuation term would disappear and one would only expect a number of discrete narrow peaks at the position corresponding to the interference maximum (Fig. 6 ▸ b). The exact positions of these peaks depend on the orientation of the microfibrils with respect to the unit-cell vectors of the two-dimensional oblique lattice. The actual situation in bone collagen fibrils is evidently an intermediate case; i.e. partial rotational disorder. Fig. 6 ▸(a) shows the observed equatorial intensity profile for native, nonmineralized herring bone collagen (black) compared with the fluctuation term (red) owing to ideal rotational disorder of the microfibrils. The center-to-center intermolecular distance (d ≃ 1.26 nm) was chosen to bring the center of the fluctuation term to that of the observed interference maximum. Fig. 6 ▸(b) shows the calculated overall intensity for the microfibrillar packing in bone collagen fibrils based on (4). More peaks were observed in the calculated pattern. The (11) reflection at 1/2.670 nm−1 was suppressed by the form factor.
Figure 6.
Lattice disorder in the bone collagen supramolecular structure. (a) The observed equatorial intensity profile for native, pre-mineralized herringbone collagen (black) and the fluctuation term (red) for ideal rotational disorder of the microfibrils. (b) The calculated diffraction pattern using (4).
Further information about the partial rotational disorder, the deviation of the microfibrillar cross-section from the ideal pentagon shape (owing to cross-linking between molecules in different microfibrils and other inter- or intra-microfibrillar interactions) and the internal structure of the microfibril is needed to refine the structure model. Agreement with the data is not quantitative, indicating that the idealized model is overly simplified. However, independent of the quantitative nature of the disorder, there is strong evidence for the presence of spatially discrete, rotationally disordered microfibrils.
3.4. Lateral packing of microfibrils
The number of well resolved equatorial reflections/row lines (Figs. 3 ▸ a and 3 ▸ c) allowed the determination of a microfibril packing lattice with sufficient confidence. Since the equatorial arcs were not resolved into individual reflections composing row lines, only a two-dimensional lattice was given. As noted above, simple two-dimensional symmetries do not apply. All observed peaks could be indexed with a two-dimensional oblique lattice with parameters a = 4.657 nm, b = 4.029 nm and γ = 103.5°, as shown in Table 1 ▸.
A discrete microfibril model would also account for the SAXS pattern for dehydrated bone (Fig. 3 ▸ e). Removal of inter-microfibrillar water would cause the microfibril lattice to collapse, which would alter the corresponding equatorial peaks/row lines, while leaving the center-to-center intermolecular distances inside microfibrils essentially unchanged, as indicated by the broad equatorial maximum with a Bragg spacing of around 1 nm. In contrast, dehydration of RTT (Fig. 3 ▸ f) significantly altered the Bragg spacing representing intermolecular distances, and left no evidence, in the form of inner equatorial reflections, of discrete supramolecular structures remaining after drying. In contrast to fish bone, the direct building blocks of RTT fibrils are collagen molecules (rather than microfibrils; Fig. 2 ▸), which are more widely spaced in the quasi-hexagonal lattice. The average center-to-center intermolecular distance is about 1.5 nm and the corresponding interference maximum is located at about 1.3 nm (Fraser et al., 1983 ▸; Hulmes & Miller, 1979 ▸; Wess et al., 1998a ▸). The tissue water is evenly distributed among the intermolecular gaps. Dehydration destroys the long-range order for lateral packing of collagen molecules, which then adopt a liquid-like packing (Fratzl et al., 1993 ▸; Woodhead-Galloway & Machin, 1976 ▸).
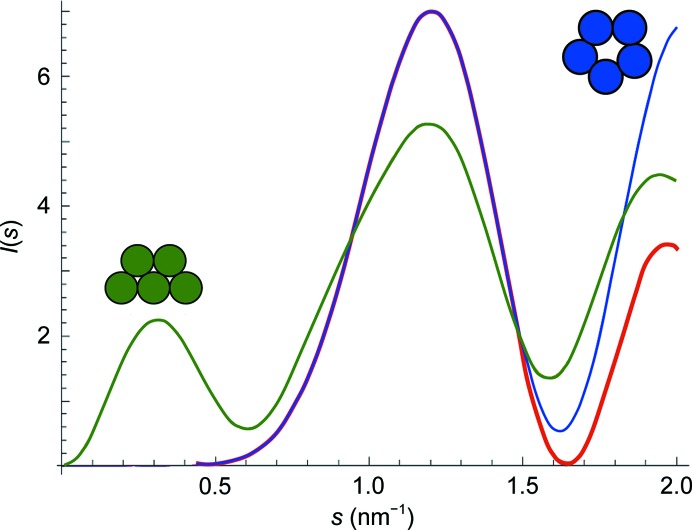
The close molecular packing in bone, indicated by the center-to-center distance, was in contrast to the looser molecular packing described for the q-h lattice of RTT (Orgel et al., 2006 ▸). A q-h microfibril with more tightly packed molecules would also be inconsistent with the SAXS pattern for bone, since it would result in an additional broad, lower-angle peak, which is not experimentally observed (Fig. 7 ▸).
Figure 7.
Calculated scattered intensities for different microfibril model cross-sections: compressed (q-h) (green) and pentagonal (Smith) (blue), calculated using (5), and an approximation to the pentagonal model with a more elegant format and higher computational efficiency (red), calculated using (6). A broad peak appears at lower angles in the predicted pattern for a q-h cross-section, but not for a pentagonal cross-section. These calculations are based on the geometry of the two simplified microfibril cross-sections. Comparison to SAXS data excludes the q-h cross-section for bone, since the bone pattern has only one broad peak.
The equatorial reflections in Figs. 3 ▸(a) and 3 ▸(c) have varying peak widths and angular distributions. All reflections would have the same radial width and angular distribution if they were generated by a lattice with the same lateral extensions and the same degree of homogeneous disorder in all possible directions. This is improbable, however, for an arrangement of discrete microfibrils in a fibril cross-section. As one example, any kind of radially layered arrangement would lead to significantly different lateral extensions and probably also degrees of order for the coherently scattering regions, which would account for the observed variations in the bone equatorial reflection characteristics.
3.5. Structural characteristics of the bone microfibril
Considering the ratio of molecule length to repeat period, a microfibril should consist of five collagen molecule segments in overlap regions and four in gap regions (Smith, 1968 ▸). The unit-cell size accommodates a single microfibril, the internal structure of which cannot be deduced in detail from these data. The simplest model is a regular pentagonal arrangement of molecules in a Smith-type microfibril cross-section, with rotational disorder between a microfibril and its neighbors. The bone microfibril is at least similar to the Smith microfibril. A substantial deviation from a pentagonal cross-section (as for a q-h cross-section) would not be consistent with the data, as shown by calculated scattering patterns for different microfibril cross-sections (Fig. 7 ▸). For a dense system with the space being completely filled with perfectly oriented microfibrils, the scattered intensity I(s) from the two-dimensional cross-sections of the microfibrils can be calculated as
 |
where s is the scattering vector (s = 2sinθ/λ; θ is half the scattering angle and λ is the wavelength of the incident radiation), p m,1, p m,2, p n,1 and p n,2 are the two-dimensional Cartesian coordinates of the scattering units (molecules) m and n, respectively, N is the total number of the scattering units in a microfibril and J 0 is the Bessel function of the first kind with order 0. The first term in the formula represents a Debye function describing the scattering from the inter-unit interferences in a microfibril, while the second term calculates the scattering from the shape of a single microfibril, which should be subtracted from the first term for a dense system. For both pentagonal and compressed models, it was assumed that a single microfibril was composed of five constituent units (collagen molecules) with configurations illustrated in the plot. To compare the scattered intensities of the two models, the Cartesian coordinates of the constituent units in each model were generated directly from the geometrical pattern of the model, assuming for simplicity that the diameter of a collagen molecule was 1 nm. In addition, a more elegant mathematical approximation for the pentagonal model was used,
where J 5 is the Bessel function of the first kind with order 5. As the plot (Fig. 7 ▸) shows, in the initial s region (s ≃ 0–1.4 nm−1) the agreement between the scattered intensities for the pentagonal model (blue) and for its approximation (red) is very high. Calculations, including coordinate determination and model plotting, were performed using Mathematica.
Additional evidence for fundamental differences between bone and tendon collagen packing structures can therefore be found in the number of broad peaks corresponding to near-neighbor intermolecular distances (one for bone and more than one for tendon; see Fig. 3 ▸).
4. Discussion
Given that the strong equatorial reflections in the bone pattern (Figs. 3 ▸ a and 3 ▸ c) can only originate from collagen (see §3), the lateral structure model described here is, to our knowledge, the sole logical interpretation of the data. This model supports structure-based explanations for (i) how mineral crystals can nucleate and grow inside fully formed collagen fibrils and (ii) why mineralized tissues have a unique pattern of collagen post-translational modifications (see §5).
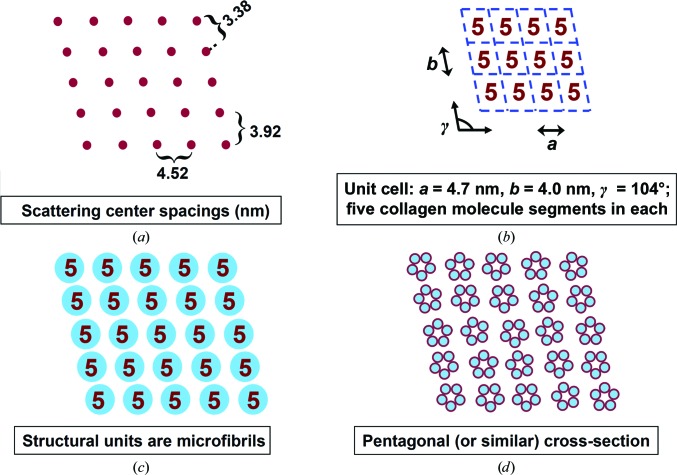
The evidentiary basis for the model is illustrated in Fig. 8 ▸. The key feature of the model, the presence of spatially discrete microfibrils, is supported by two lines of evidence: equatorial reflections for native bone (Figs. 3 ▸ a and 3 ▸ c) and equatorial reflections for dehydrated bone compared with dehydrated RTT (Figs. 3 ▸ e and 3 ▸ f). In the dehydrated bone pattern, the single strong equatorial reflection at 3.74 nm is consistent with a laterally disordered array of microfibrils that is more closely packed after the removal of inter-microfibrillar water. This pattern is fundamentally different from that of dehydrated RTT, which has no strong inner equatorial reflections that might indicate the presence of discrete supramolecular structures. The dehydrated RTT pattern is consistent with an array of individual collagen molecules that are laterally disordered and more closely packed.
Figure 8.
Summary of the evidence for the bone fibril lateral structure model. (a) Scattering center spacings and two-dimensional unit-cell parameters are given by low-angle row lines (Figs. 3 ▸ a and 3 ▸ c). (b) The quarter-stagger model of longitudinal collagen packing (Hodge & Petruska, 1963 ▸; Fig. 1 ▸) specifies 5n collagen molecule segments per unit cell in the overlap region. (c) The near-neighbor spacing of collagen molecules, deduced by semi-quantitative fitting (Fig. 6 ▸) to the broad peak at ∼1 nm in Figs. 3 ▸(a) and 3 ▸(c), is similar to the diameter of a single collagen molecule, so the molecules are closely packed. Since the five close-packed molecules do not occupy an entire unit cell, they are in a spatially discrete microfibril. Dehydrated sample data (Figs. 3 ▸ e and 3 ▸ f) also support the presence of discrete microfibrils (see §3.4). (d) Significant deviations from a pentagonal cross-section, such as a q-h cross-section, would not be consistent with the data (Fig. 7 ▸).
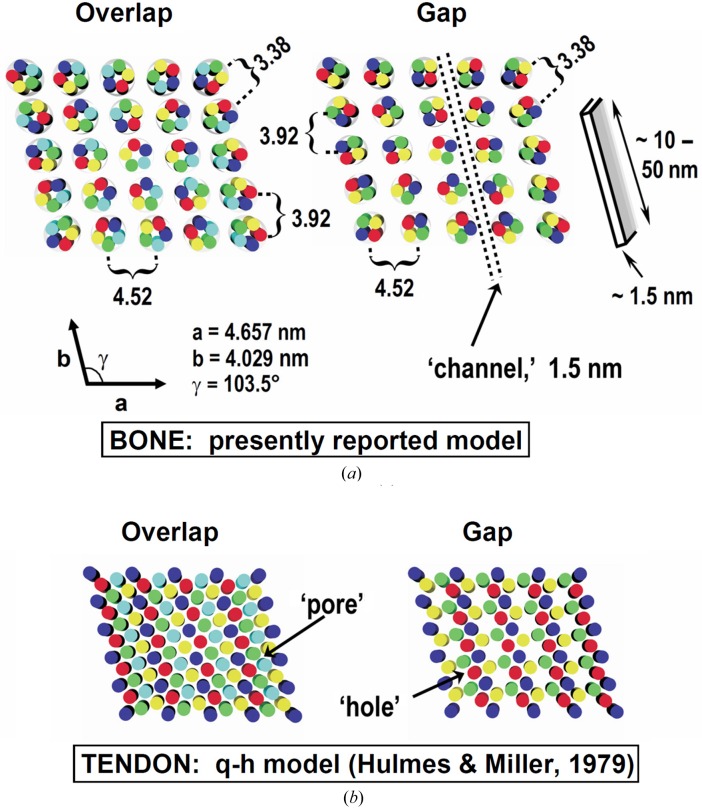
The bone and RTT lateral structure models are compared in Fig. 9 ▸. The bone model includes a near-neighbor molecular center-to-center distance of 1.26 nm, which is in good agreement with reported values (Katz & Li, 1973b ▸; Woodhead-Galloway & Machin, 1976 ▸; Fratzl et al., 1993 ▸; Bella et al., 1994 ▸; Berisio et al., 2002 ▸; Supplementary Table S1), and the microfibril diameter in the overlap zone is about 3.4 nm. The proposed channels have a breadth of around 1.5 nm, which is sufficient for hydrated phosphate and other ions to diffuse into the fibril interior (Mason et al., 2003 ▸; Pribil et al., 2008 ▸). The channel length is estimated to be more than 50 nm from the widths of equatorial reflections. The average thickness of apatite platelets in lightly mineralized regions of fish bone is about 1.5 nm and their widths observed by TEM cross-section images are in the range 10–50 nm (Burger, Zhou, Wang et al., 2008 ▸). These platelets could be accommodated by channels of the predicted dimensions. Since the channels are in the gap regions, the model is consistent with observations that the nucleation and initial growth of apatite crystals also occur in the gap regions (Glimcher, 1959 ▸, 1968 ▸).
Figure 9.
(a) Left, a schematic cross-section of a fish-bone fibril overlap region; right, a gap region. The microfibril diameter is smaller in the gap (about 3.0 nm) compared with the overlap region (about 3.4 nm), creating a ‘channel’ in the gap region that differs from the channels obtained by hole alignment in a structure composed of separate collagen molecules (see Fig. 4 ▸). At the upper right is an illustration of a herring bone apatite crystal (Burger, Zhou, Wang et al., 2008 ▸). The q-h model for RTT is shown in (b). No apatite-crystal-sized spaces exist. Bone microfibrils in (a) are shown with an ideal pentagonal cross-section; the channel dimensions are not significantly affected by the details of the microfibril internal structure. Disks in the same color represent cross-sections of molecules with the same axial shift (Fig. 1 ▸).
5. Conclusion
SAXS analysis provides evidence that bone collagen molecules are organized into spatially discrete microfibrils. Two fundamental questions about bone collagen can be answered in the context of a discrete microfibril structure model: specifically, how collagen fibrils can internally accommodate mineral crystals and why collagen intermolecular cross-linking is different in mineralized versus nonmineralized tissues. Mature mineralized tissues have a high content of dipeptidyl (two-chain) intermolecular cross-links compared with mature nonmineralized tissues, owing in part to specific modifications of cross-link precursor residues (Terajima et al., 2014 ▸). The function of additional dipeptidyls in mature bone can be understood in terms of a mechanical requirement for longitudinal tensile strength (see §S1 in the Supporting Information). The pyrrole tripeptidyl cross-links are found almost exclusively in mineralized tissues (Eyre & Weis, 2013 ▸; Knott & Bailey, 1998 ▸; Yamauchi & Sricholpech, 2012 ▸). The need for pyrroles can be explained by considering the geometry of intermicrofibrillar cross-linking and the proximity of some cross-linking loci to spaces available for apatite crystal formation (see §S1 in the Supporting Information). A discrete microfibril model is consistent with current knowledge of collagen post-translational modifications in bone; furthermore, it supports long-sought explanations for some of the unique features of these modifications.
6. Related literature
The following references are cited in the Supporting Information for this article: Acharya & Sussman (1984 ▸), Bailey et al. (1999 ▸), Banse et al. (2002 ▸), Brodsky & Persikov (2005 ▸), Brodsky & Shah (1995 ▸), Brown et al. (1997 ▸), Chen et al. (1991 ▸), Connolly & Yelick (2010 ▸), Dubois et al. (2002 ▸), Eyre (1981 ▸, 1987 ▸), Eyre et al. (1984 ▸, 1988 ▸, 2011 ▸), Eyre & Oguchi (1980 ▸), Fisher et al. (2003 ▸), Hanson & Eyre (1996 ▸), Kivirikko et al. (1989 ▸), Knott et al. (1995 ▸), Massé et al. (1996 ▸), Mechanic et al. (1985 ▸), Nagan & Kagan (1994 ▸), Rho et al. (2001 ▸), Risteli et al. (1977 ▸), Saito et al. (2001 ▸), Shiiba et al. (2001 ▸, 2002 ▸) and Strausberg et al. (2002 ▸).
Supplementary Material
Supporting Information.. DOI: 10.1107/S2059798316011864/wa5109sup1.pdf
Acknowledgments
Dedicated to the memory of Melvin J. Glimcher (1925–2014), who conceived the project, was the primary supervisor for the experimental work and contributed to the manuscript. We thank Drs I. Sics, L. Rong and D. Fang for assistance with the SAXS experiments and pattern analysis, and Ying Su for assistance with Mathematica calculations. This work was supported in part by NIH 2R01AG014701-17A2 (to Melvin J. Glimcher; BSH subcontractor), the Peabody Foundation (to MJG), the Department of Orthopaedic Surgery, Children’s Hospital Boston and DOE DEFG0299ER45760 (to BSH and BC).
References
- Acharya, A. S. & Sussman, L. G. (1984). J. Biol. Chem. 259, 4372–4378. [PubMed]
- Bailey, A. J., Sims, J., Ebbesen, E. N., Mansell, J. P., Thomsen, J. S. & Mosekilde, L. (1999). Calcif. Tissue Int. 65, 203–210. [DOI] [PubMed]
- Banse, X., Sims, T. J. & Bailey, A. J. (2002). J. Bone Miner. Res. 17, 1621–1628. [DOI] [PubMed]
- Bear, R. S. (1944). J. Am. Chem. Soc. 66, 1297–1305.
- Bella, J., Eaton, M., Brodsky, B. & Berman, H. M. (1994). Science, 266, 75–81. [DOI] [PubMed]
- Berisio, R., Vitagliano, L., Mazzarella, L. & Zagari, A. (2002). Protein Sci. 11, 262–270. [DOI] [PMC free article] [PubMed]
- Brodsky, B. & Persikov, A. V. (2005). Adv. Protein Chem. 70, 301–339. [DOI] [PubMed]
- Brodsky, B. & Shah, N. K. (1995). FASEB J. 9, 1537–1546. [DOI] [PubMed]
- Brown, E. M., King, G. & Chen, J. M. (1997). J. Am. Leather Chem. Assoc. 92, 1–7.
- Burger, C., Zhou, H., Sicŝ, I., Hsiao, B. S., Chu, B., Graham, L. & Glimcher, M. J. (2008). J. Appl. Cryst. 41, 252–261.
- Burger, C., Zhou, H., Wang, H., Sics, I., Hsiao, B. S., Chu, B., Graham, L. & Glimcher, M. J. (2008). Biophys. J. 95, 1985–1992. [DOI] [PMC free article] [PubMed]
- Che, J., Burger, C., Toki, S., Rong, L., Hsiao, B. S., Amnuaypornsri, S. & Sakdapipanich, J. (2013). Macromolecules, 46, 4520–4528.
- Chen, J. M., Kung, C. E., Feairheller, S. H. & Brown, E. M. (1991). J. Protein Chem. 10, 535–552. [DOI] [PubMed]
- Connolly, M. H. & Yelick, P. C. (2010). J. Appl. Ichthyol. 26, 274–277.
- Dubois, G. M., Haftek, Z., Crozet, C., Garrone, R. & Le Guellec, D. (2002). Gene, 294, 55–65. [DOI] [PubMed]
- During, A., Penel, G. & Hardouin, P. (2015). Prog. Lipid Res. 59, 126–146. [DOI] [PubMed]
- Eyre, D. R. (1981). The Chemistry and Biology of Mineralized Connective Tissues, edited by A. Veis, pp. 51–55. Amsterdam: Elsevier.
- Eyre, D. R. (1987). Methods Enzymol. 144, 115–139. [DOI] [PubMed]
- Eyre, D. R., Dickson, I. R. & Van Ness, K. (1988). Biochem. J. 252, 495–500. [DOI] [PMC free article] [PubMed]
- Eyre, D. R., Koob, T. J. & Van Ness, K. P. (1984). Anal. Biochem. 137, 380–388. [DOI] [PubMed]
- Eyre, D. R. & Oguchi, H. (1980). Biochem. Biophys. Res. Commun. 92, 403–410. [DOI] [PubMed]
- Eyre, D. R. & Weis, M. A. (2013). Calcif. Tissue Int. 93, 338–347. [DOI] [PMC free article] [PubMed]
- Eyre, D. R., Weis, M. A., Hudson, D., Wu, J.-J. & Kim, L. (2011). J. Biol. Chem. 286, 7732–7736. [DOI] [PMC free article] [PubMed]
- Fisher, S., Jagadeeswaran, P. & Halpern, M. E. (2003). Dev. Biol. 264, 64–76. [DOI] [PubMed]
- Fraser, R. D., MacRae, T. P., Miller, A. & Suzuki, E. (1983). J. Mol. Biol. 167, 497–521. [DOI] [PubMed]
- Fratzl, P., Fratzl-Zelman, N. & Klaushofer, K. (1993). Biophys. J. 64, 260–266. [DOI] [PMC free article] [PubMed]
- Glimcher, M. J. (1959). Rev. Mod. Phys. 31, 359–393.
- Glimcher, M. J. (1968). Clin. Orthop. Relat. Res. 61, 16–36. [PubMed]
- Glimcher, M. J. (1998). Metabolic Bone Disease and Clinically Related Disorders, edited by L. V. Avioli & S. M. Krane, pp. 23–50. San Diego: Academic Press.
- Glimcher, M. J. (2006). Rev. Mineral. Geochem. 64, 223–282.
- Hanson, D. A. & Eyre, D. R. (1996). J. Biol. Chem. 271, 26508–26516. [DOI] [PubMed]
- Hodge, A. (1989). Connect. Tissue Res. 21, 137–147. [DOI] [PubMed]
- Hodge, A. J. & Petruska, J. A. (1963). Aspects of Protein Structure, edited by G. N. Ramachandran, pp. 289–300. New York: Academic Press.
- Hulmes, D. J. S. & Miller, A. (1979). Nature (London), 282, 878–880. [DOI] [PubMed]
- Hulmes, D. J. S., Wess, T. J., Prockop, D. J. & Fratzl, P. (1995). Biophys. J. 68, 1661–1670. [DOI] [PMC free article] [PubMed]
- Katz, E. P. & Li, S.-T. (1972). Biochem. Biophys. Res. Commun. 46, 1368–1373. [DOI] [PubMed]
- Katz, E. P. & Li, S.-T. (1973a). J. Mol. Biol. 80, 1–15. [DOI] [PubMed]
- Katz, E. P. & Li, S.-T. (1973b). J. Mol. Biol. 73, 351–369. [DOI] [PubMed]
- Kim, H.-M., Rey, C. & Glimcher, M. J. (1995). J. Bone Miner. Res. 10, 1589–1601. [DOI] [PubMed]
- Kivirikko, K. I., Myllylä, R. & Pihlajaniemi, T. (1989). FASEB J. 3, 1609–1617. [PubMed]
- Knott, L. & Bailey, A. J. (1998). Bone, 22, 181–187. [DOI] [PubMed]
- Knott, L., Tarlton, J. F. & Bailey, A. J. (1997). Biochem. J. 322, 535–542. [DOI] [PMC free article] [PubMed]
- Knott, L., Whitehead, C. C., Fleming, R. H. & Bailey, A. J. (1995). Biochem. J. 310, 1045–1051. [DOI] [PMC free article] [PubMed]
- Landis, W. J., Song, M. J., Leith, A., McEwen, L. & McEwen, B. F. (1993). J. Struct. Biol. 110, 39–54. [DOI] [PubMed]
- Lee, D. D. & Glimcher, M. J. (1991). J. Mol. Biol. 217, 487–501. [DOI] [PubMed]
- Mason, P. E., Cruickshank, J. M., Neilson, G. W. & Buchanan, P. (2003). Phys. Chem. Chem. Phys. 5, 4686–4690.
- Massé, P. G., Rimnac, C. M., Yamauchi, M., Coburn, S. P., Rucker, R. B., Howell, D. S. & Boskey, A. L. (1996). Bone, 18, 567–574. [DOI] [PubMed]
- Mechanic, G. L., Banes, A. J., Henmi, M. & Yamauchi, M. (1985). The Chemistry and Biology of Mineralized Tissues, edited by W. T. Butler, pp. 98–102. Birmingham: EBSCO.
- Meek, K. M. (2009). Biophys. Rev. 1, 83–93. [DOI] [PMC free article] [PubMed]
- Miller, A. (1976). Biochemistry of Collagen, edited by G. N. Ramachandran & A. H. Reddi, pp. 85–136. New York: Plenum.
- Miller, A. & Wray, J. (1971). Nature (London), 230, 437–439. [DOI] [PubMed]
- Murshed, M., Harmey, D., Millán, J. L., McKee, M. D. & Karsenty, G. (2005). Genes Dev. 19, 1093–1104. [DOI] [PMC free article] [PubMed]
- Nagan, N. & Kagan, H. M. (1994). J. Biol. Chem. 269, 22366–22371. [PubMed]
- Orgel, J. P., Irving, T. C., Miller, A. & Wess, T. J. (2006). Proc. Natl Acad. Sci. USA, 103, 9001–9005. [DOI] [PMC free article] [PubMed]
- Orgel, J., Wess, T. & Miller, A. (2000). Structure, 8, 137–142. [DOI] [PubMed]
- Pribil, A. B., Hofer, T. S., Randolf, B. R. & Rode, B. M. (2008). J. Comput. Chem. 29, 2330–2334. [DOI] [PubMed]
- Rho, J. Y., Mishra, S. R., Chung, K., Bai, J. & Pharr, G. M. (2001). Ann. Biomed. Eng. 29, 1082–1088. [DOI] [PubMed]
- Risteli, J., Tryggvason, K. & Kivirikko, K. I. (1977). Eur. J. Biochem. 73, 485–492. [DOI] [PubMed]
- Robinson, R. (1952). J. Bone Joint Surg. 34–A, 389–435. [PubMed]
- Saito, M., Takenouchi, Y., Kunisaki, N. & Kimura, S. (2001). Eur. J. Biochem. 268, 2817–2827. [DOI] [PubMed]
- Schmitt, F. O., Hall, C. E. & Jakus, M. A. (1942). J. Cell. Comp. Physiol. 20, 11–33.
- Shiiba, M., Arnaud, S. B., Tanzawa, H., Kitamura, E. & Yamauchi, M. (2002). J. Bone Miner. Res. 17, 1639–1645. [DOI] [PubMed]
- Shiiba, M., Arnaud, S. B., Tanzawa, H., Uzawa, K. & Yamauchi, M. (2001). Connect. Tissue Res. 42, 303–311. [DOI] [PubMed]
- Smith, J. (1968). Nature (London), 219, 157–158.
- Strausberg, R. L. et al. (2002). Proc. Natl Acad. Sci. USA, 99, 16899–16903.
- Terajima, M., Perdivara, I., Sricholpech, M., Deguchi, Y., Pleshko, N., Tomer, K. B. & Yamauchi, M. (2014). J. Biol. Chem. 289, 22636–22647. [DOI] [PMC free article] [PubMed]
- Trus, B. & Piez, K. (1980). Nature (London), 286, 300–301. [DOI] [PubMed]
- Weiner, S. & Traub, W. (1992). FASEB J. 6, 879–885. [PubMed]
- Wess, T. J., Hammersley, A. P., Wess, L. & Miller, A. (1998a). J. Mol. Biol. 275, 255–267. [DOI] [PubMed]
- Wess, T. J., Hammersley, A. P., Wess, L. & Miller, A. (1998b). J. Struct. Biol. 122, 92–100. [DOI] [PubMed]
- Woodhead-Galloway, J. & Machin, P. A. (1976). Acta Cryst. A32, 368–372.
- Yamauchi, M. & Katz, E. P. (1993). Connect. Tissue Res. 29, 81–98. [DOI] [PubMed]
- Yamauchi, M. & Sricholpech, M. (2012). Essays Biochem. 52, 113–133. [DOI] [PMC free article] [PubMed]
Associated Data
This section collects any data citations, data availability statements, or supplementary materials included in this article.
Supplementary Materials
Supporting Information.. DOI: 10.1107/S2059798316011864/wa5109sup1.pdf


